Price Repaired Faster Than Internals as Cross-Sectional Stress Spiked
The S&P nearly repaired MA20 and equal-weight price rose, but breadth stayed weak, dispersion jumped above +2z and late order flow achieved only a partial neutral reclaim.
Horizon: 3-10 trading days.
This research is designed for 3-10 trading-day swing setups. The signals and conclusions may not transfer to intraday trading or longer-horizon investing.
Price Repaired Faster Than Internals as Cross-Sectional Stress Spiked
Thursday's index rebound repaired more price than market structure. The S&P 500 finished just 0.06% below its 20-day average and the Nasdaq retained a 1.03% MA20 cushion, while the equal-weight universe gained 0.63% from open to close. Those are materially better price outcomes than the previous session. But breadth remained weak at 0.380, the short-horizon breadth oscillator stayed negative, and cross-sectional volatility jumped to +2.22z - the clearest fresh damage signal in the private stack.
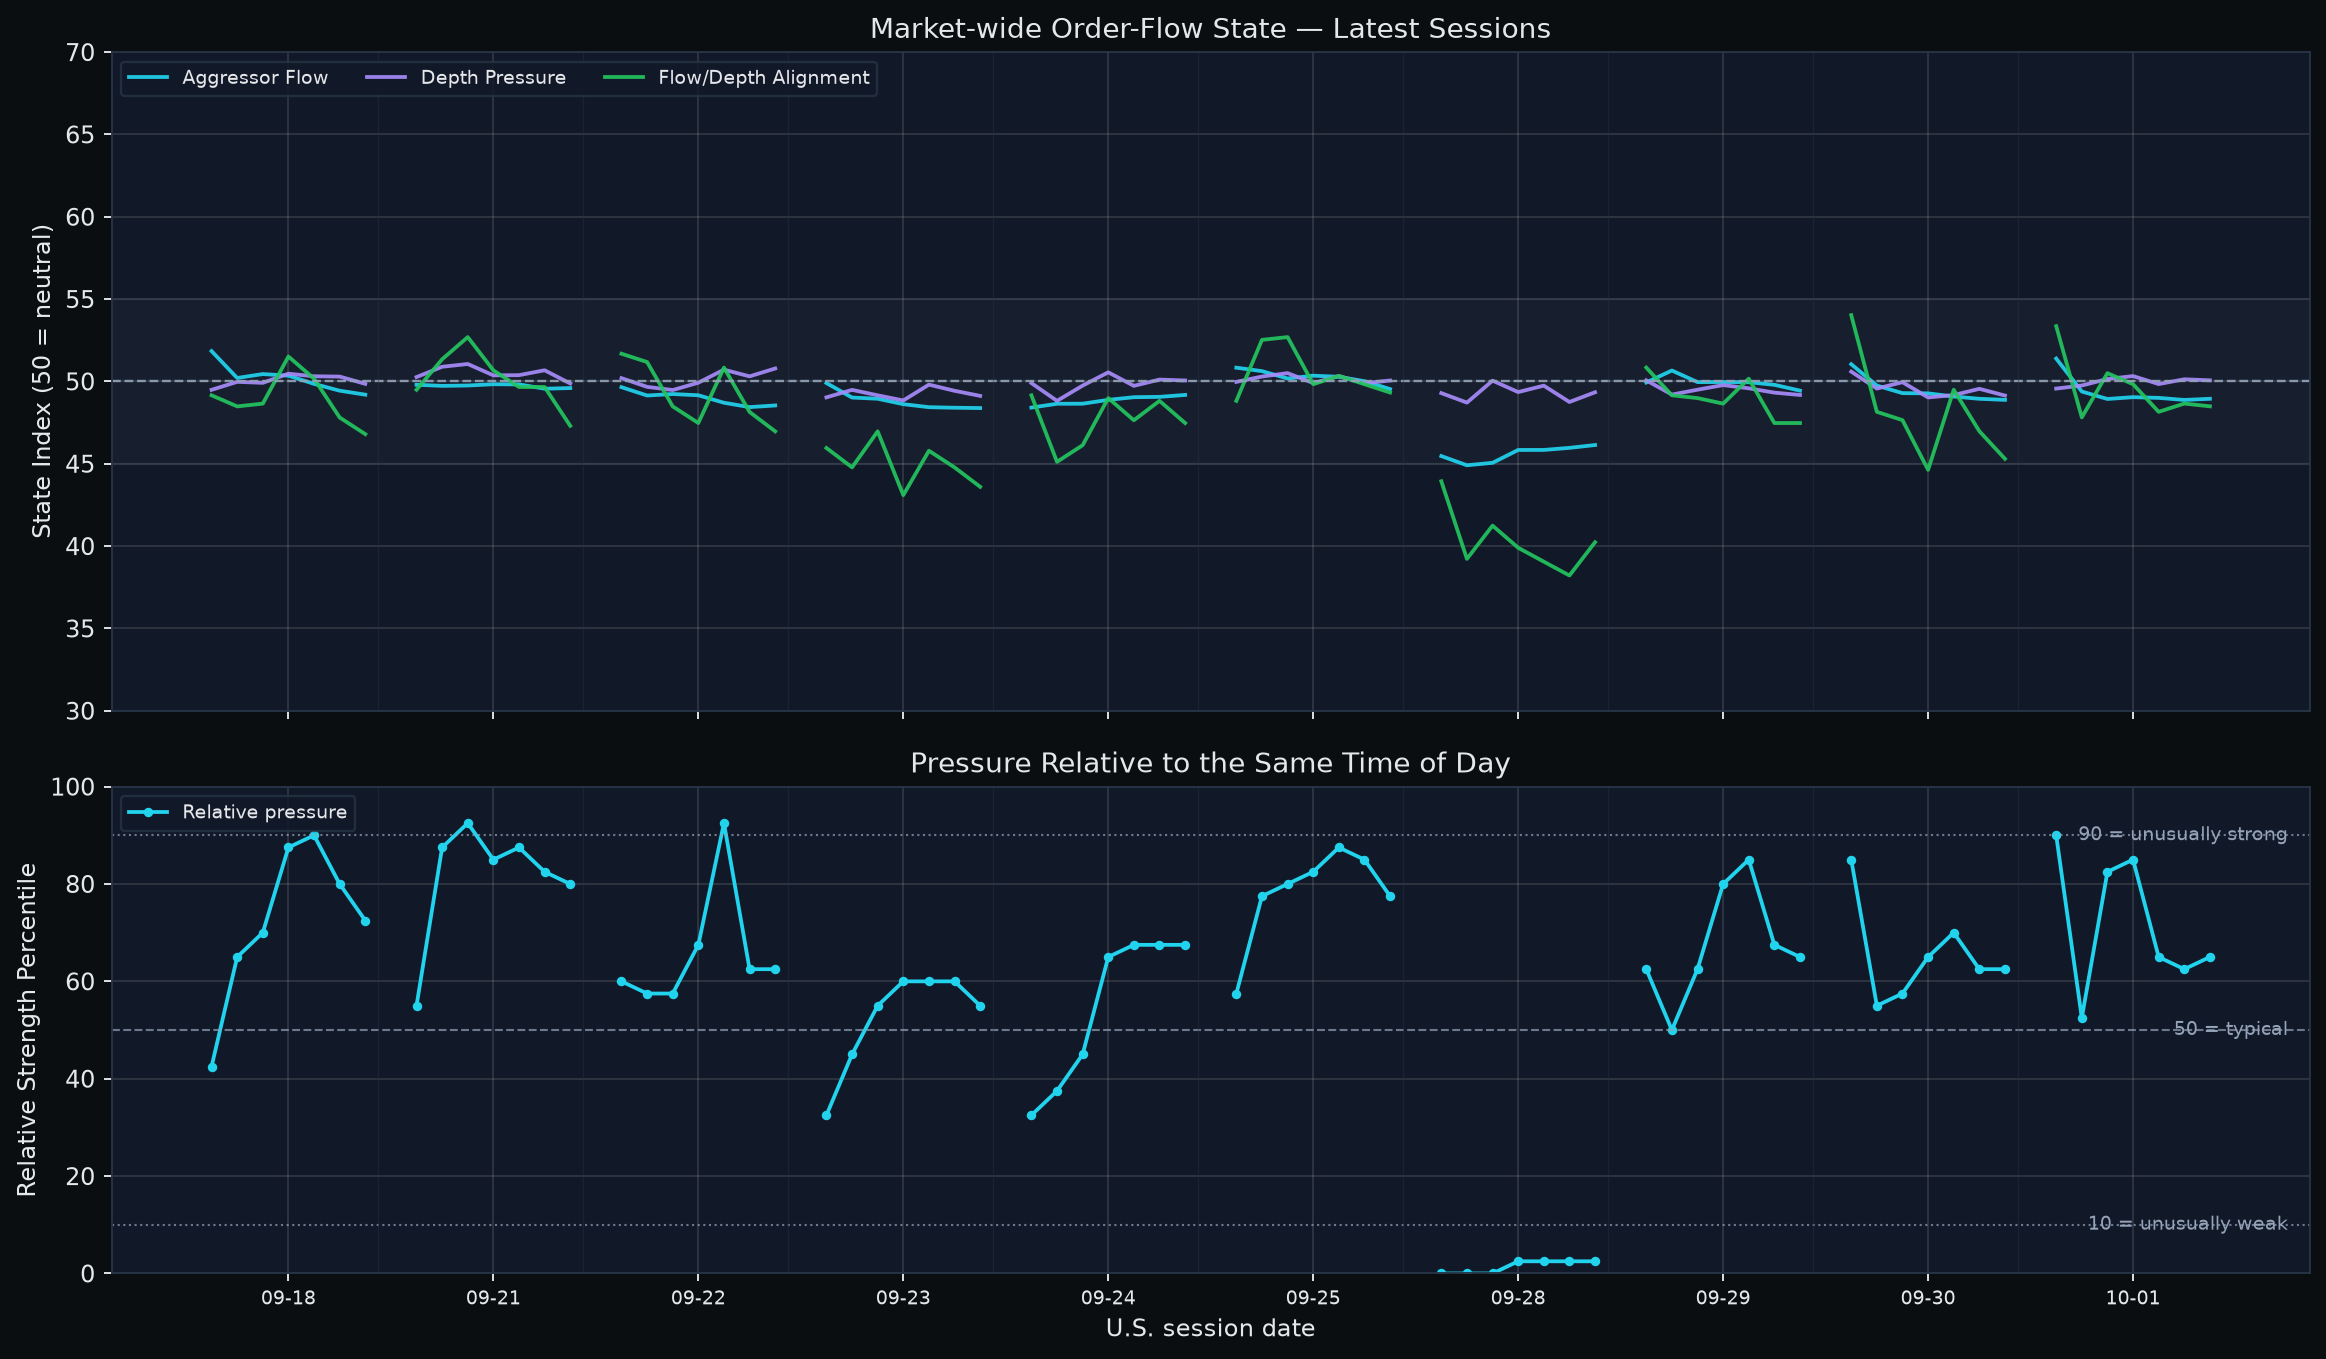
The order-flow path tells the same story in a different way. Aggressor Flow and Flow/Depth Alignment opened above the 50 neutral reference, with the opening state at the 90th same-time percentile. That strength failed quickly. Depth Pressure managed to finish slightly above neutral at 50.07, but Aggressor closed at 48.95 and Alignment at 48.49. Late-session direction improved modestly from the 13:30 lows, yet only one of three state axes reclaimed neutral. That is partial repair, not a repaired state.
At the same time, the damage is not yet a synchronized liquidation event. The share of stocks falling 3% or more is still below its historical mean at -0.87z, 20-day new-low pressure is below +1z, and the systemic propagation checks remain inactive. The unusual feature is dispersion: cross-sectional volatility is +2.22z even while equal-weight price rose. That combination is consistent with a market in which winners and losers are separating aggressively rather than everything being sold together.
My 3-10TD base case is therefore an index-level repair with incomplete internal confirmation and a higher premium on stock-specific support. Asset Management & Capital Markets is the cleanest current Bull sector, but Semiconductors and Enterprise Software are simultaneously Bull leaders and top Bear-risk sectors. The final stock list - ARM, INTC, WULF, BMNR, MDB and NBIS - all passed the upstream recent-support gate, but their medium-term trend and slower context differ sharply. The broad tape can improve from here, but it still owes evidence: early order-flow neutral reclaim, breadth stabilization and a reduction in dispersion stress.
How to read today's indicators
| Indicator | Reader scale | Interpretation |
|---|---|---|
| Market-wide order-flow state | Three component indices; 50 = neutral | Aggressor Flow, Depth Pressure and Flow/Depth Alignment answer different questions. Read confirmation or divergence across the three; they are not probabilities. |
| Same-time order-flow percentile | 0-100; 50 = same-time historical median | 90 is unusually strong and 10 unusually weak for that intraday slot. This is historical context, not event probability. |
| Flow × depth state breadth | Cross-sectional percentages | Bull/Bear aligned show joint direction; absorption-compatible states describe divergence only, not proven actor intent. |
| Market breadth | 0-1; practical balance ~0.50 | Above 0.50 means broader participation. Direction and slope show whether participation is improving or fading. |
| z-score | 0 = historical mean | |z| ~1 is notable and |z| ~2 is unusual. It is standardized distance, not probability. |
| Historical percentile | 0-100; 50 = median | 90+ is historically elevated. A percentile is not an event probability. |
| FLOW_SCORE_RANK | 0-1; 0.50 = median | 0.80+ is relatively strong slow context. It is confirmation/context, not a standalone entry signal. |
| Financial / 13F price divergence | Approx. -1 to +1; 0 = little gap | Positive means slow context is ahead of price; negative means price is ahead. ±0.20 / ±0.50 are reader bands only, not learned thresholds. |
| Expected next-session range | Non-directional high-low amplitude | Always pair the raw estimate with its same-day cross-sectional percentile. It is not an upside target. |
1. Price, breadth and damage: better closes, but fresh dispersion damage
| Layer | Current reading | Interpretation |
|---|---|---|
| S&P 500 | 7,666.45; -0.22% vs MA5; -0.06% vs MA20; close at 73% of daily range | The index nearly repaired MA20 and finished well off the low, but fast momentum is not yet positive. |
| Nasdaq Composite | 26,871.60; -0.05% vs MA5; +1.03% vs MA20; close near mid-range | Medium-term price structure remains better than the S&P, though the close did not show strong upside control. |
| Market breadth | 0.380; 5TD change -0.025; 17th historical percentile | Participation remains weak despite the index rebound. |
| McClellan-style breadth | -0.74z; 5TD change -0.26z | Short-horizon participation is still below normal, but less damaged than a full washout. |
| New-low pressure | 20D +0.90z; 252D +1.83z | Long-horizon weak-tail damage remains elevated; the shorter window is only moderately stressed. |
| Fresh propagation checks | Down-3% breadth -0.87z; cross-sectional vol +2.22z | Dispersion is unusually high, but broad large-decline participation is absent: fresh damage without synchronized liquidation. |
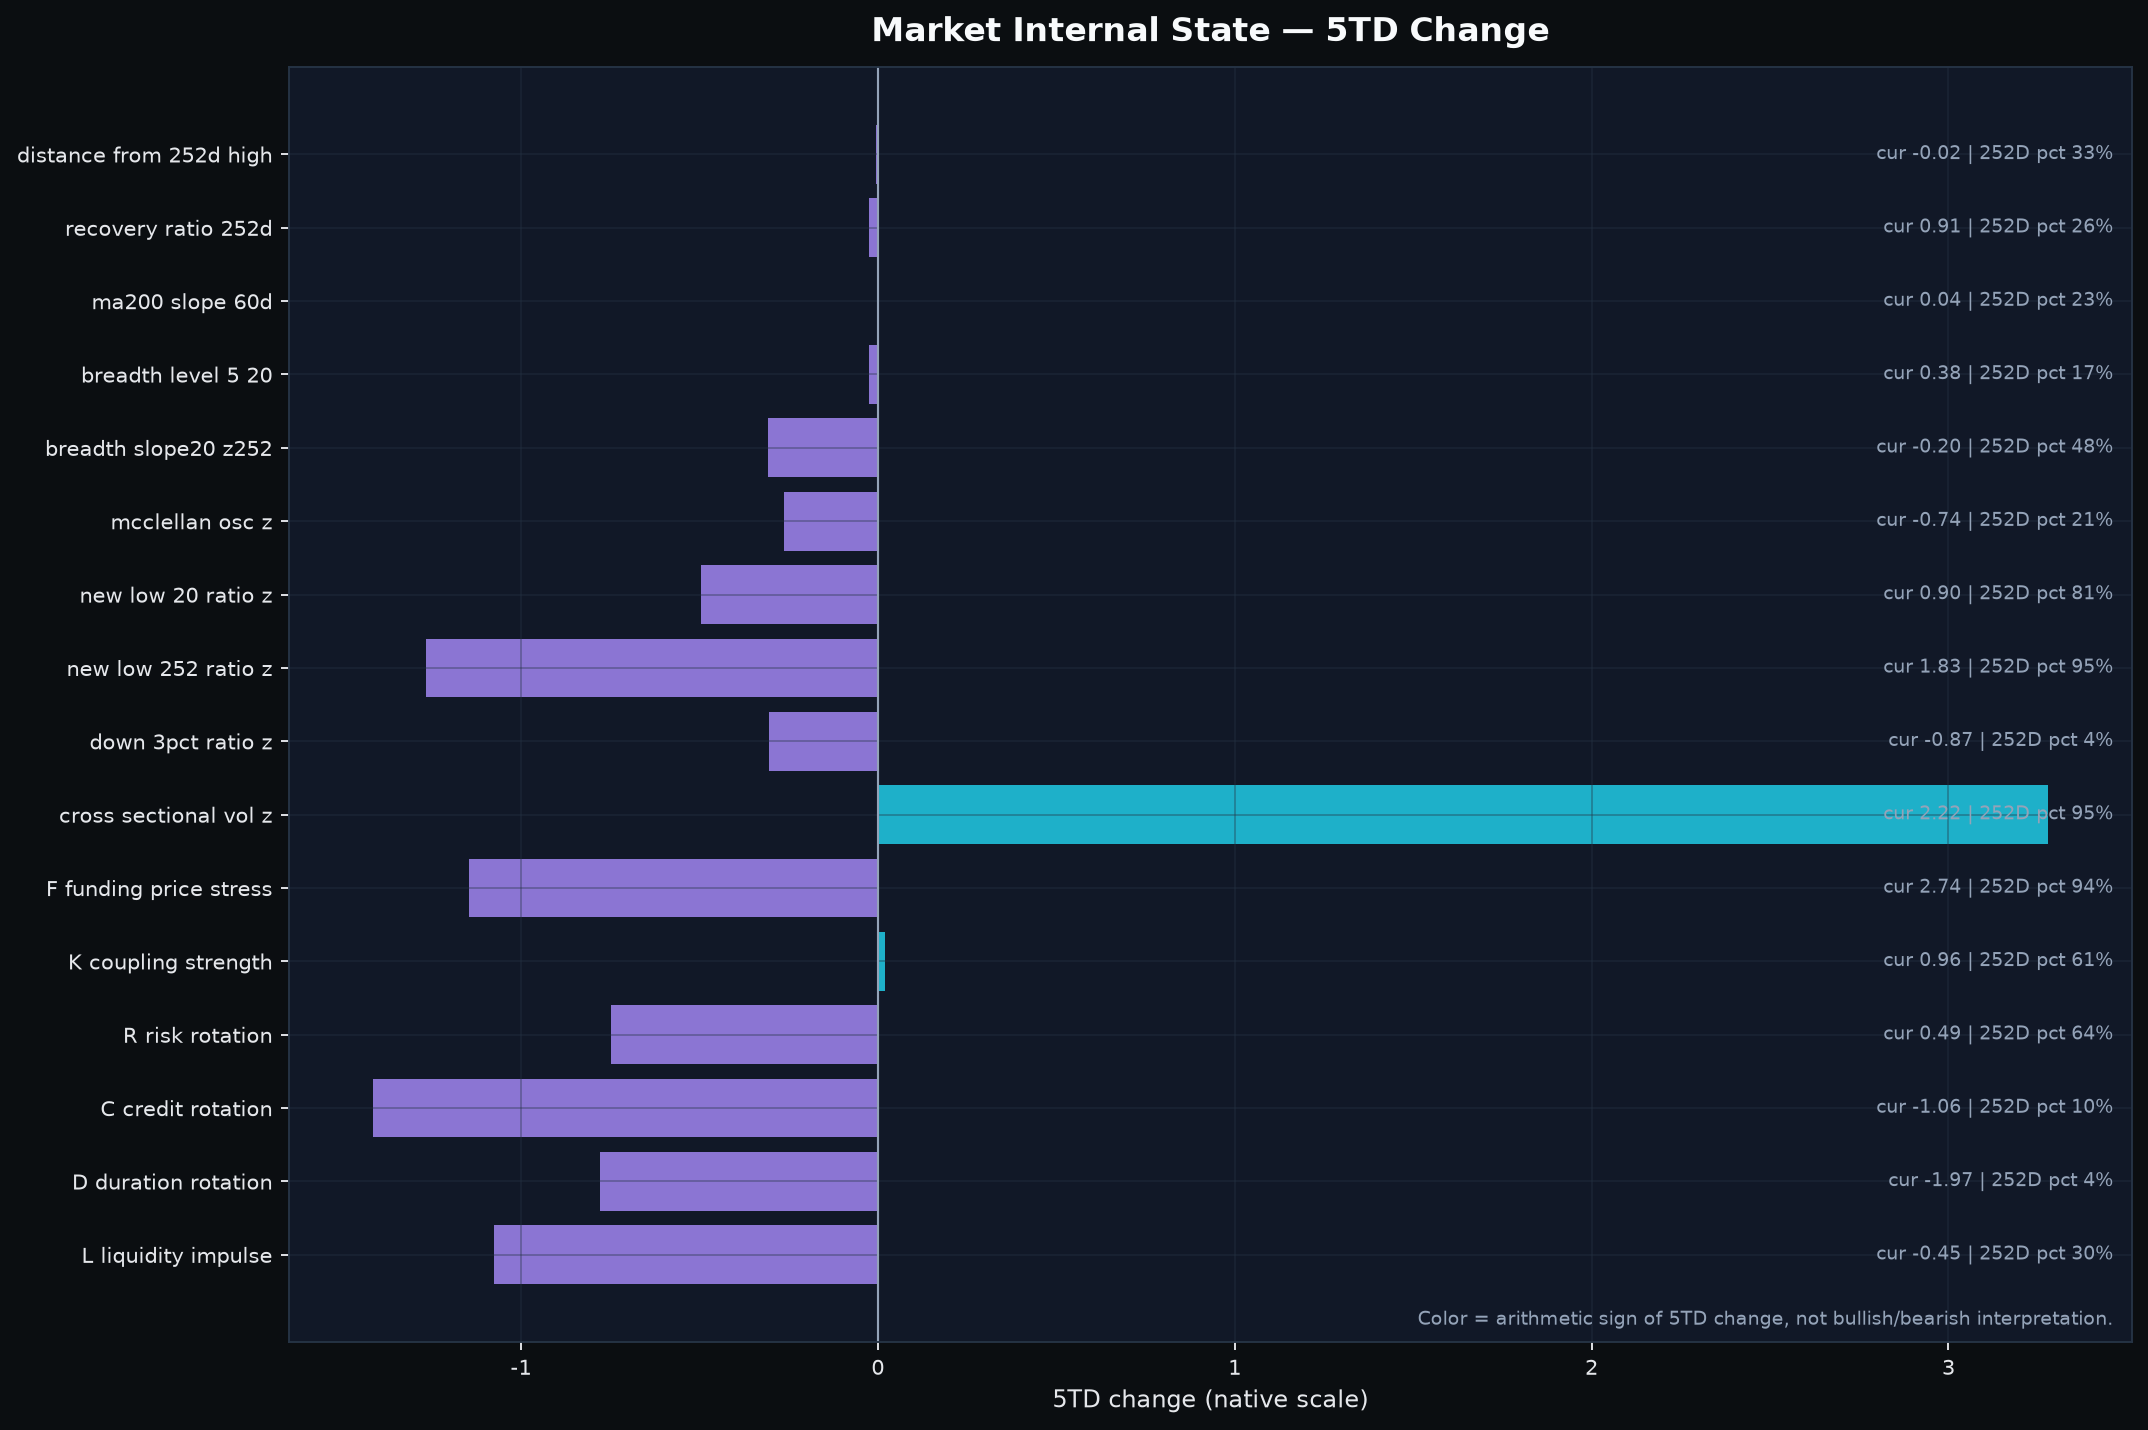
The key change is that the market's damage type shifted. Price recovered enough to put the S&P almost back on MA20, yet the cross-section became more unstable. A +2.22z dispersion reading means the average stock experience is increasingly different from the index experience. That raises the cost of treating a modest index rebound as proof of broad repair.
The counterevidence is important. The equal-weight universe gained 0.63% from open to close, down-3% breadth is not elevated, and 20-day new-low stress is still below +1z. So today's high dispersion should not be translated into “broad liquidation.” A more precise description is fresh live cross-sectional damage inside an index tape that partially repaired.
Falsifier: the selective-repair thesis strengthens if breadth turns higher, dispersion falls back below unusually elevated territory and the S&P holds above MA20. It fails in the bearish direction if high dispersion becomes broad large-decline breadth, new-low pressure re-accelerates and the Nasdaq loses its MA20 cushion.
2. Order flow: late effort improved the path, but only Depth reclaimed neutral
| Time | Aggressor | Depth | Alignment | Same-time pct. | Bull aligned | Bear aligned | Buy absorption | Sell absorption | EW bar |
|---|---|---|---|---|---|---|---|---|---|
| 09:30 | 51.39 | 49.57 | 53.36 | 90.0 | 20.5% | 13.8% | 14.4% | 18.1% | -0.37% |
| 10:30 | 49.39 | 49.75 | 47.82 | 52.5 | 12.4% | 16.8% | 17.1% | 14.8% | -0.03% |
| 11:30 | 48.94 | 50.15 | 50.50 | 82.5 | 17.1% | 16.1% | 20.1% | 13.8% | +0.23% |
| 12:30 | 49.05 | 50.33 | 49.83 | 85.0 | 18.5% | 18.8% | 15.8% | 11.7% | +0.47% |
| 13:30 | 49.00 | 49.84 | 48.15 | 65.0 | 14.8% | 18.5% | 14.8% | 13.4% | -0.07% |
| 14:30 | 48.88 | 50.13 | 48.66 | 62.5 | 15.8% | 18.5% | 14.1% | 10.7% | +0.05% |
| 15:30 | 48.95 | 50.07 | 48.49 | 65.0 | 14.4% | 17.4% | 15.8% | 13.1% | +0.00% |
The opening state looked powerful at first glance. Aggressor Flow was 51.39 and Alignment 53.36, while the composite same-time reading sat at the 90th percentile. Depth, however, started slightly below neutral at 49.57. The opening impulse then failed almost immediately: by 10:30 Aggressor was 49.39 and Alignment 47.82, while Depth was still only 49.75. The market lost the strongest part of the opening state before the equal-weight price recovery had fully developed.
Midday repair was real but incomplete. Depth moved above 50 at 11:30 and stayed close to neutral through the rest of the day. Alignment briefly reclaimed 50.50 at 11:30, but could not sustain it; by 13:30 it was back to 48.15. The late window from 13:30 to the close then showed small positive path changes in Depth (+0.23) and Alignment (+0.34), while Aggressor was essentially flat. The distinction is crucial: two axes improved in direction, but only Depth finished above 50. The close was 1.05 points below neutral for Aggressor and 1.51 points below for Alignment.
The breadth states also resist a clean “buyers repaired control” interpretation. Bull-aligned breadth fell from 20.5% at the open to 14.4% at the close, while Bear-aligned breadth rose from 13.8% to 17.4%. Buy-absorption-compatible breadth increased modestly and sell-absorption-compatible breadth fell, which is constructive at the margin, but those are divergence states rather than evidence of actor intent. The final hour itself was mixed: Aggressor rose only 0.07, Depth slipped 0.06, Alignment fell 0.17, Bull breadth decreased 1.34 percentage points and Bear breadth eased 1.01 points.
The 65th same-time percentile at the close is another useful counterweight. The state was not historically extreme for that time of day even though two axes were below neutral. This is why the correct label is late repair without full neutral reclaim, not collapse. The next session inherits a partial repair burden: Aggressor and Alignment need an early move above 50 that persists through midday, and breadth/price must confirm rather than leaving Depth as the only repaired axis.
3. Cross-asset context: funding stress is high, but the fresh rate shock is easing
| Layer | Current evidence | What it says | What it does not say |
|---|---|---|---|
| F - price-of-money stress | State +2.44z; 5D shock -1.28z; 2Y component -9.5bp over 5D; real 10Y -1.5bp | Absolute financing stress remains historically high, but the newest impulse is easing, especially at the front end. | A high F state is not the same as a fresh tightening shock or funding crisis. |
| L - liquidity state | -0.41z; 5D shock -0.69z | No broad liquidity confirmation of a new stress acceleration. | Does not neutralize rate or dispersion risk. |
| R - relative preference | 20D change +0.229; leading positive destinations: short Treasuries, precious metals, industrial metals | Price-implied preference is broadening outside equities. | This is not observed dollar flow and does not identify where cash came from. |
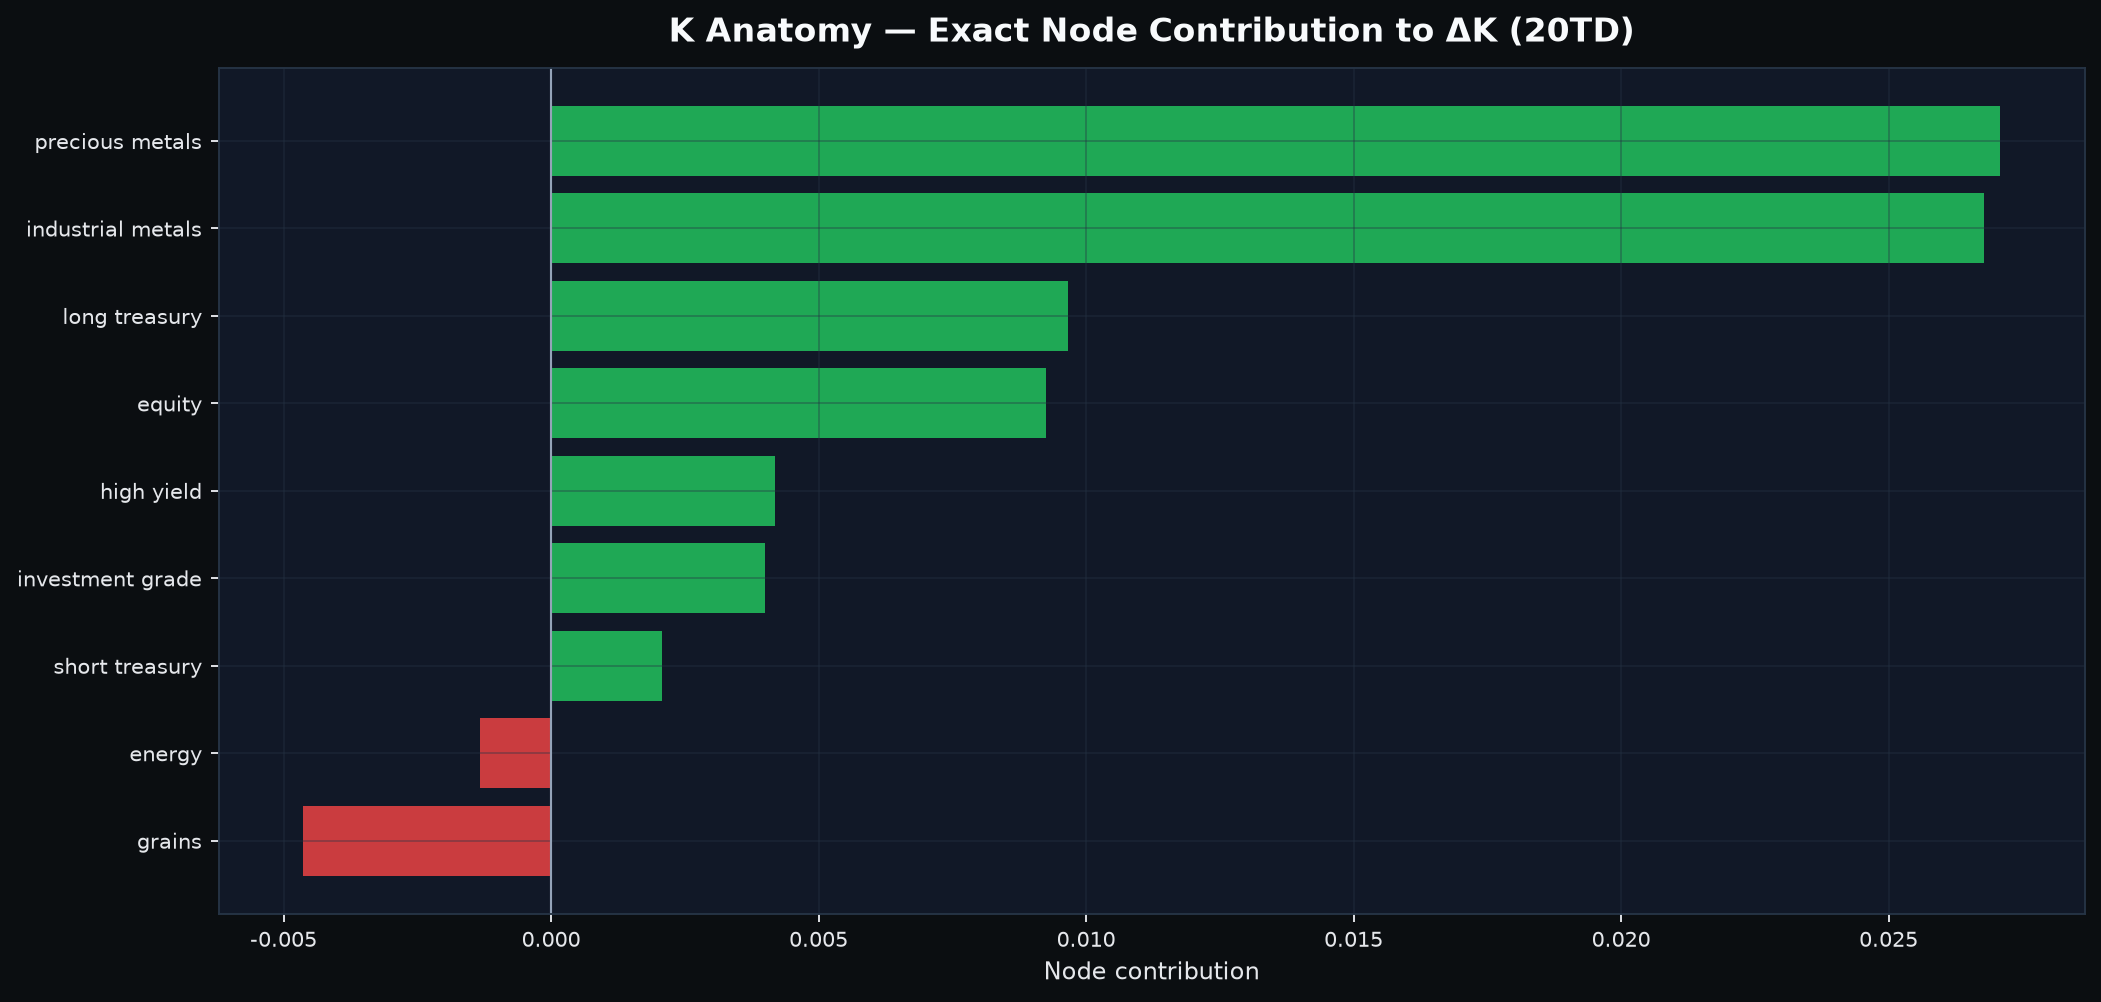
| K - coupling strength | Raw 0.508; 20D change +0.077; +0.96z | Cross-asset common-mode strength increased. | K is not directional. Metals account for most of the node increase; equity is only ~12% of the change. |
| CFTC | Latest report Sep. 22; 7 trading-day lag; equity ratio +30.8%, +3.12pp over 4 reports; overall R confirmation negative/mixed | Weekly positioning is current by release schedule but does not cleanly confirm the current price-implied rotation. | It is not same-day flow and should not override fast evidence. |
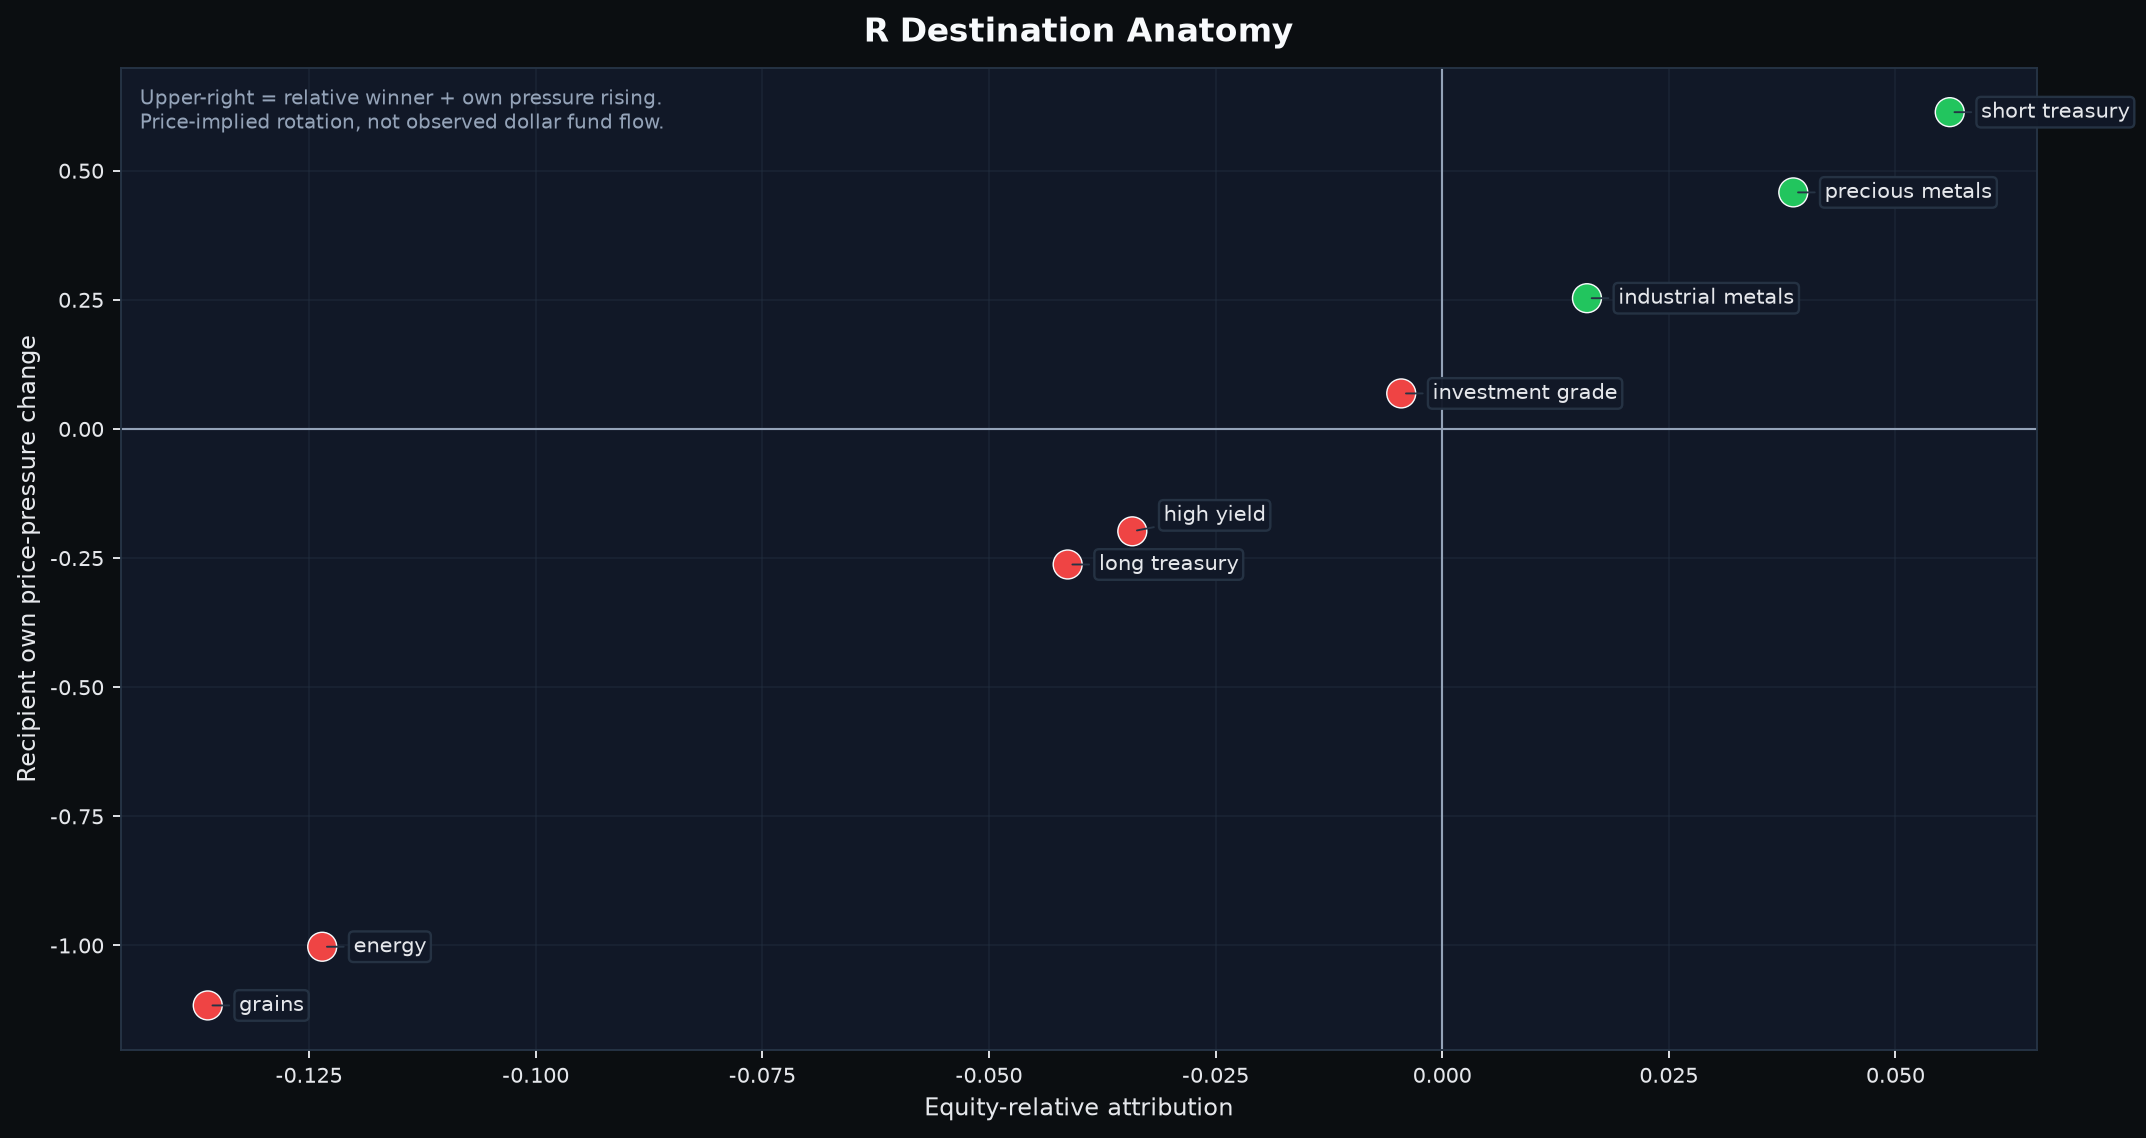
The macro layer is therefore less bearish than the absolute F level alone would suggest. Front-end and real-rate contributions remain high in level, but the five-day shock is negative. Reuters' post-close recap of the completed October 1 session reported that Treasury yields had surged earlier and then receded as the day progressed. That public tape description is consistent with the private state/shock distinction; it is used here as a recap, not as a retroactive causal explanation of the private signal.
R and K also argue against a simple equity-risk conclusion. Short Treasuries are the largest positive R destination over 20 days, but precious and industrial metals also participate. In K, precious and industrial metals together account for roughly 70% of the increase in common-mode node contribution, with long Treasuries next and equity around 12%. A stronger K reading therefore means “more assets moving under common macro forces,” not “equities must fall.”
CFTC adds a slower disagreement. The latest available report is dated September 22 and was released September 25, in line with the official Friday/previous-Tuesday schedule. Equity positioning remains net long and strengthened over four reports, while the short-Treasury sleeve is net short and also moved further short. The aggregate CFTC-to-R confirmation is negative/mixed. Given the seven-trading-day lag, that is useful as positioning context, not as a same-session refutation.
4. Sector leadership: one clean leader, two major conflicts, and two narrow Bull-dominant satellites
| Bull rank | Sector | Bear-risk rank | Balance state | Representative tickers | Public read |
|---|---|---|---|---|---|
| 1 | Asset Management & Capital Markets | 18 | Bull-dominant | RIOT, IREN, WULF, HOOD, MARA, CRCL, BMNR | The cleanest Bull/Bear balance, but leadership is concentrated in crypto, trading and power-linked names rather than broad traditional asset managers. |
| 2 | Semiconductors & Tech Hardware | 1 | Two-sided conflict | ASTS, QCOM, DELL, INTC, CRDO, ARM, HPE | Strong Bull representation coexists with the market's highest sector Bear risk. |
| 3 | Enterprise Software & IT Services | 2 | Two-sided conflict | MDB, APLD, CIFR, MSTR, DDOG, SNPS, ORCL | AI/data-platform themes are strong, but downside-model pressure is almost equally prominent. |
| 4 | Healthcare Providers & Services | 15 | Bull-dominant | TEM, ELV, CI, MCK, CVS, HCA, UNH | Eligible Bull #4 despite raw Bull #5; balance is constructive, but the signal is heavily concentrated in TEM rather than broad managed-care participation. |
| 5 | Internet, Media & Telecom | 14 | Bull-dominant | NBIS, APP, RBLX, META, CMCSA, RDDT, GOOGL | Eligible Bull #5 despite raw Bull #6; leadership is narrow, with NBIS the only Bull Top30 name in the current sector packet. |
| Sector | Current leading subcluster(s) | Key names | Economic linkage | Quant / price-support confirmation | Why now / public mechanism | Strongest counterevidence |
|---|---|---|---|---|---|---|
| Asset Management & Capital Markets | Crypto platforms, miners and power-rich digital infrastructure | RIOT, IREN, WULF, MARA, CRCL, BMNR | Crypto beta plus scarce power/interconnection assets that can migrate toward AI/HPC demand | Bull #1 / Bear #18; WULF and BMNR are in the final support-confirmed list | Reuters Breakingviews has highlighted power capacity as the scarce AI asset; TeraWulf's 20-year Anthropic lease demonstrates the AI/HPC monetization path, while BitMine remains directly sensitive to ETH treasury value | RIOT, HOOD and MARA show weak short price geometry; WULF is still 7.5% below MA20 and its financial/cash-flow context is weak |
| Semiconductors & Tech Hardware | AI compute architecture, data-center processors and systems | INTC, ARM, DELL, CRDO, QCOM | AI training/inference capex and data-center compute demand | Bull #2 / Bear #1; ARM and INTC have fresh Step14 support confirmations and are above MA20 | South Korea's September semiconductor exports hit a record on AI demand; Arm reported data-center royalties more than doubled and Intel continues to push an open, scalable AI-infrastructure stack | Bear-risk #1 shows severe internal bifurcation; several leaders remain volatile and high-duration |
| Enterprise Software & IT Services | AI-era data platforms and infrastructure software | MDB, DDOG, ORCL, SNPS | Enterprise data, observability and developer infrastructure needed for AI workloads | Bull #3 / Bear #2; MDB passed support confirmation but is 7.3% below MA20 | MongoDB 9.0 and Atlas Infinite target AI-scale elasticity and workload spikes | MongoDB's CEO transition adds governance uncertainty; sector Bear risk remains #2 and MDB still lacks medium-term price repair |
| Healthcare Providers & Services | Data-enabled health services led by TEM, with managed care as secondary context | TEM, ELV, CI, CVS, UNH | Healthcare utilization, data services and payer economics | Eligible Bull #4 / Bear #15 (raw Bull #5); TEM is Bull #10 while most large managed-care names rank far lower | No single session-safe public catalyst is needed to explain the quant rank; the evidence is better read as a narrow TEM-led health-services pocket | The breadth of leadership is weak and there is no final publication stock from the sector |
| Internet, Media & Telecom | AI cloud infrastructure plus digital platforms | NBIS, APP, RBLX, META, GOOGL | AI compute demand, digital-platform monetization and communications infrastructure | Eligible Bull #5 / Bear #14 (raw Bull #6); NBIS is Bull #15 and the only Bull Top30 name in the current sector packet | Nebius's Sep. 8 Palantir partnership provides a dated AI-cloud mechanism for the leading NBIS subcluster; it is context for the business exposure, not a claim that the announcement caused the Oct. 1 rank | Leadership is narrow across the broader sector, with most internet/media names well outside the Bull Top30 |
The sector layer is not a broad “AI risk-on” signal. Asset Management is cleanest, but its leading subcluster is unusual: miners, crypto platforms and power-rich infrastructure names. Semiconductors and Enterprise Software are both high Bull and high Bear-risk, which is the definition of a two-sided regime. Healthcare and Internet/Media/Telecom complete the eligible Bull Top5, but both are narrow: TEM carries much of the healthcare signal, while NBIS is the only Internet/Media/Telecom name in the Bull Top30. The common denominator is selectivity, not synchronized cyclicality.
5. Stocks: six support-confirmed names, four distinct setup types
| Priority | Stock | Sector | Selection tier/role | Bull rank (of 295) | Bear rank (of 295) | Recent support confirmation | Live S1 zone | Distance from S1 | MA20 | Slower context |
|---|---|---|---|---|---|---|---|---|---|---|
| 1 | ARM | Semiconductors & Tech Hardware | B - support-confirmed | #27 | #40 | Oct. 1, next-day confirmation after a Sep. 30 lower-wick test | $286.75-$295.16 | +0.52%; 0.08 ATR | +4.99% | Financial context unavailable; delayed 13F rank 0.83 with +0.67 price divergence |
| 2 | INTC | Semiconductors & Tech Hardware | A+ - support-confirmed | #8 | #61 | Oct. 1, same-day bullish hold/reclaim | $118.58-$120.34 | +0.69%; 0.14 ATR | +8.84% | Financial rank 0.87 / +0.48 divergence; delayed 13F rank 0.81 / +0.60 divergence |
| 3 | WULF | Asset Management & Capital Markets | A+ - support-confirmed | #14 | #177 | Oct. 1, next-day confirmation after a Sep. 30 lower-wick test | $14.20-$14.83 | +2.78%; 0.39 ATR | -7.54% | Financial rank 0.07; delayed 13F rank 0.72; secondary CBVR context is internally mixed and treated as neutral |
| 4 | BMNR | Asset Management & Capital Markets | B - support-confirmed | #30 | #66 | Oct. 1, same-day bullish hold/reclaim | $25.61-$26.34 | +2.37%; 0.39 ATR | +3.11% | Official-filing fallback: very high revenue growth but deeply negative CFO/FCF margins; ownership snapshot is not a 13F flow rank |
| 5 | MDB | Enterprise Software & IT Services | A - support-confirmed | #2 | #56 | Sep. 30, same-day bullish hold/reclaim (1TD ago) | $333.15-$347.53 | +3.52%; 0.44 ATR | -7.25% | Financial rank 0.94 / -0.19 divergence versus delayed 13F rank 0.06 / -0.67 divergence |
| 6 | NBIS | Internet, Media & Telecom | A+ - support-confirmed | #15 | #32 | Sep. 29, same-day bullish hold/reclaim (2TD ago) | $222.57-$229.03 | +3.15%; 0.44 ATR | +1.92% | Financial context unavailable; delayed 13F rank 0.73 with +0.37 price divergence |
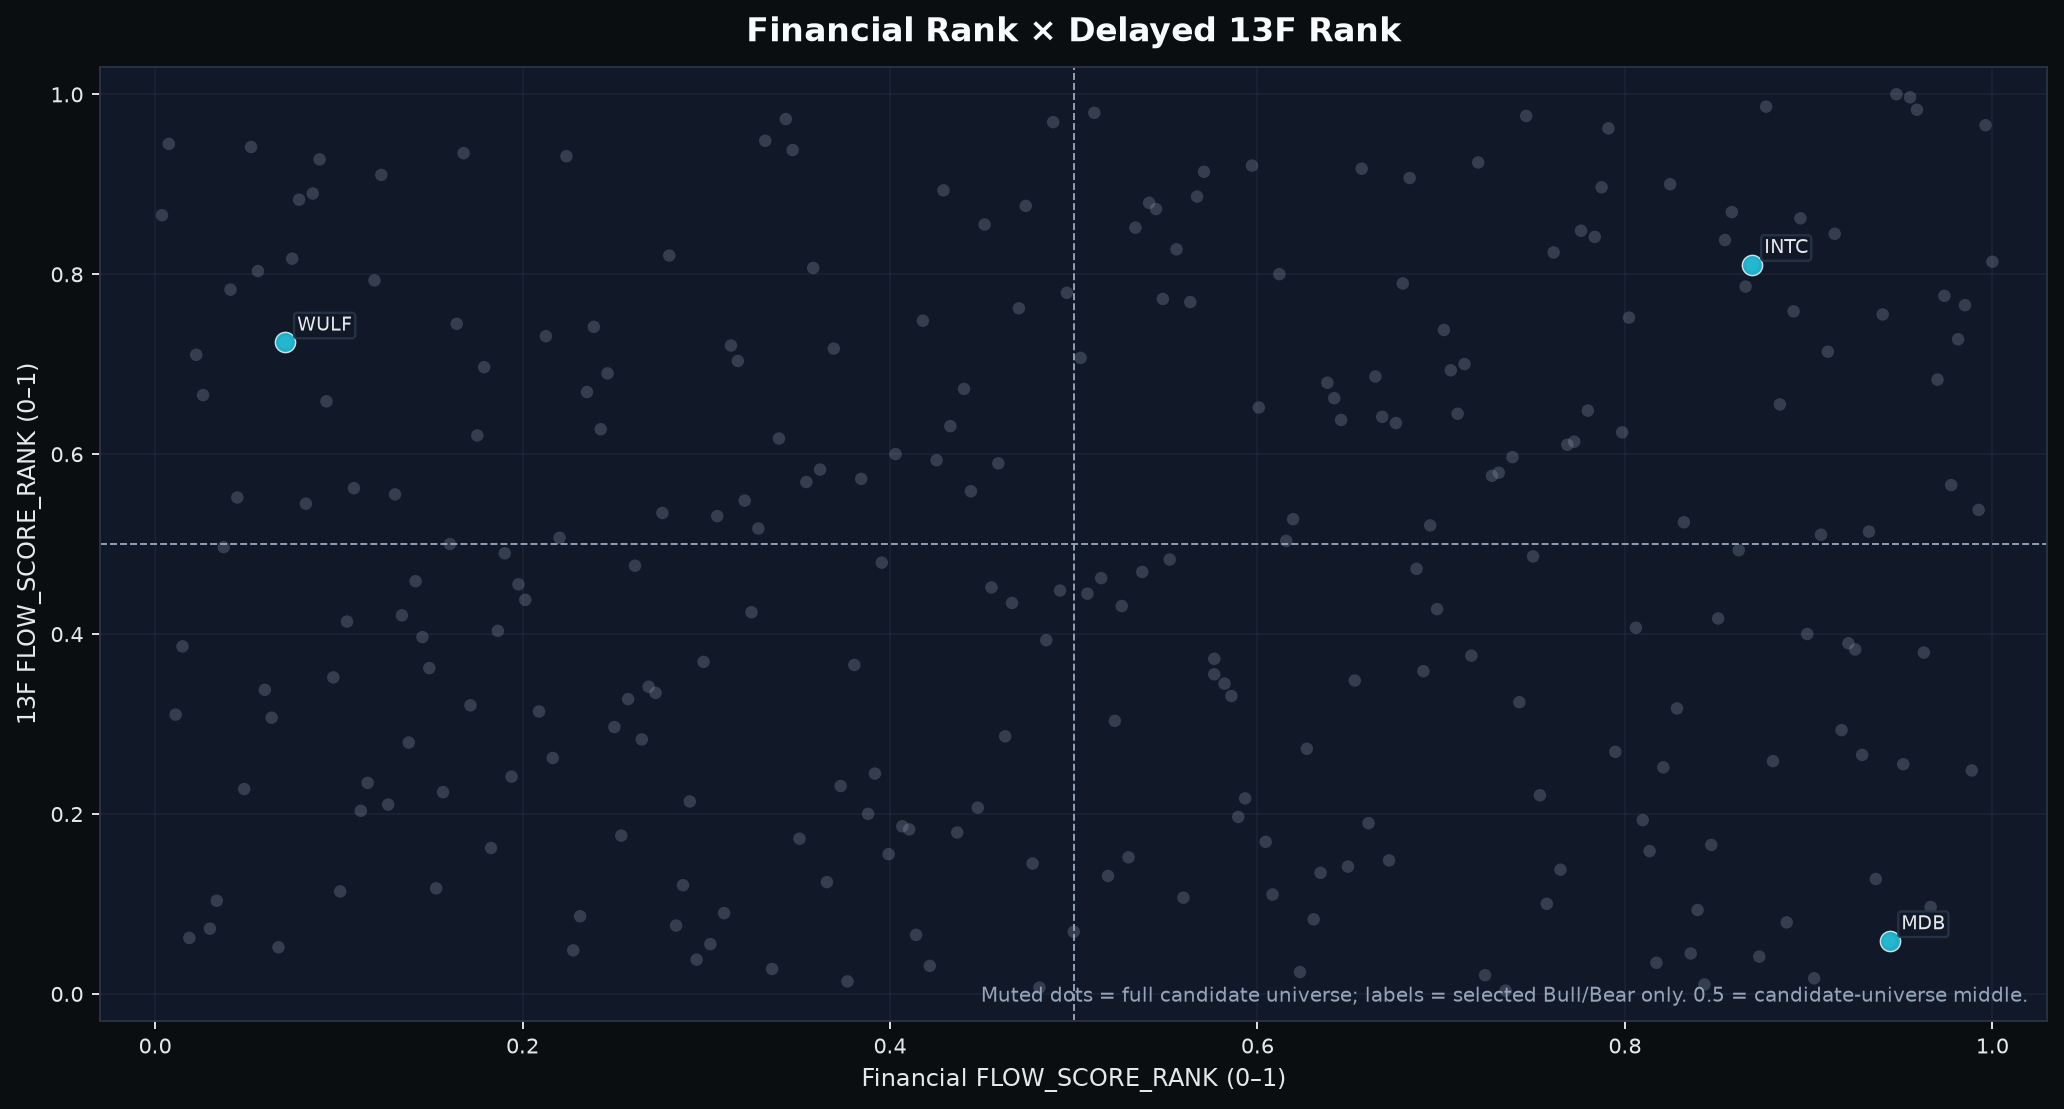
The upstream support gate fixes membership and order. ARM is first because it is closest to current live S1, not because public news or slower fundamentals outrank INTC's Bull score. The A+/A/B selection tier is display/context metadata; it does not override membership or publication order. All six names have recent causal support confirmation, but that local setup says nothing by itself about whether the medium-term trend is repaired.
ARM and INTC: the cleanest support-plus-trend semiconductor pair
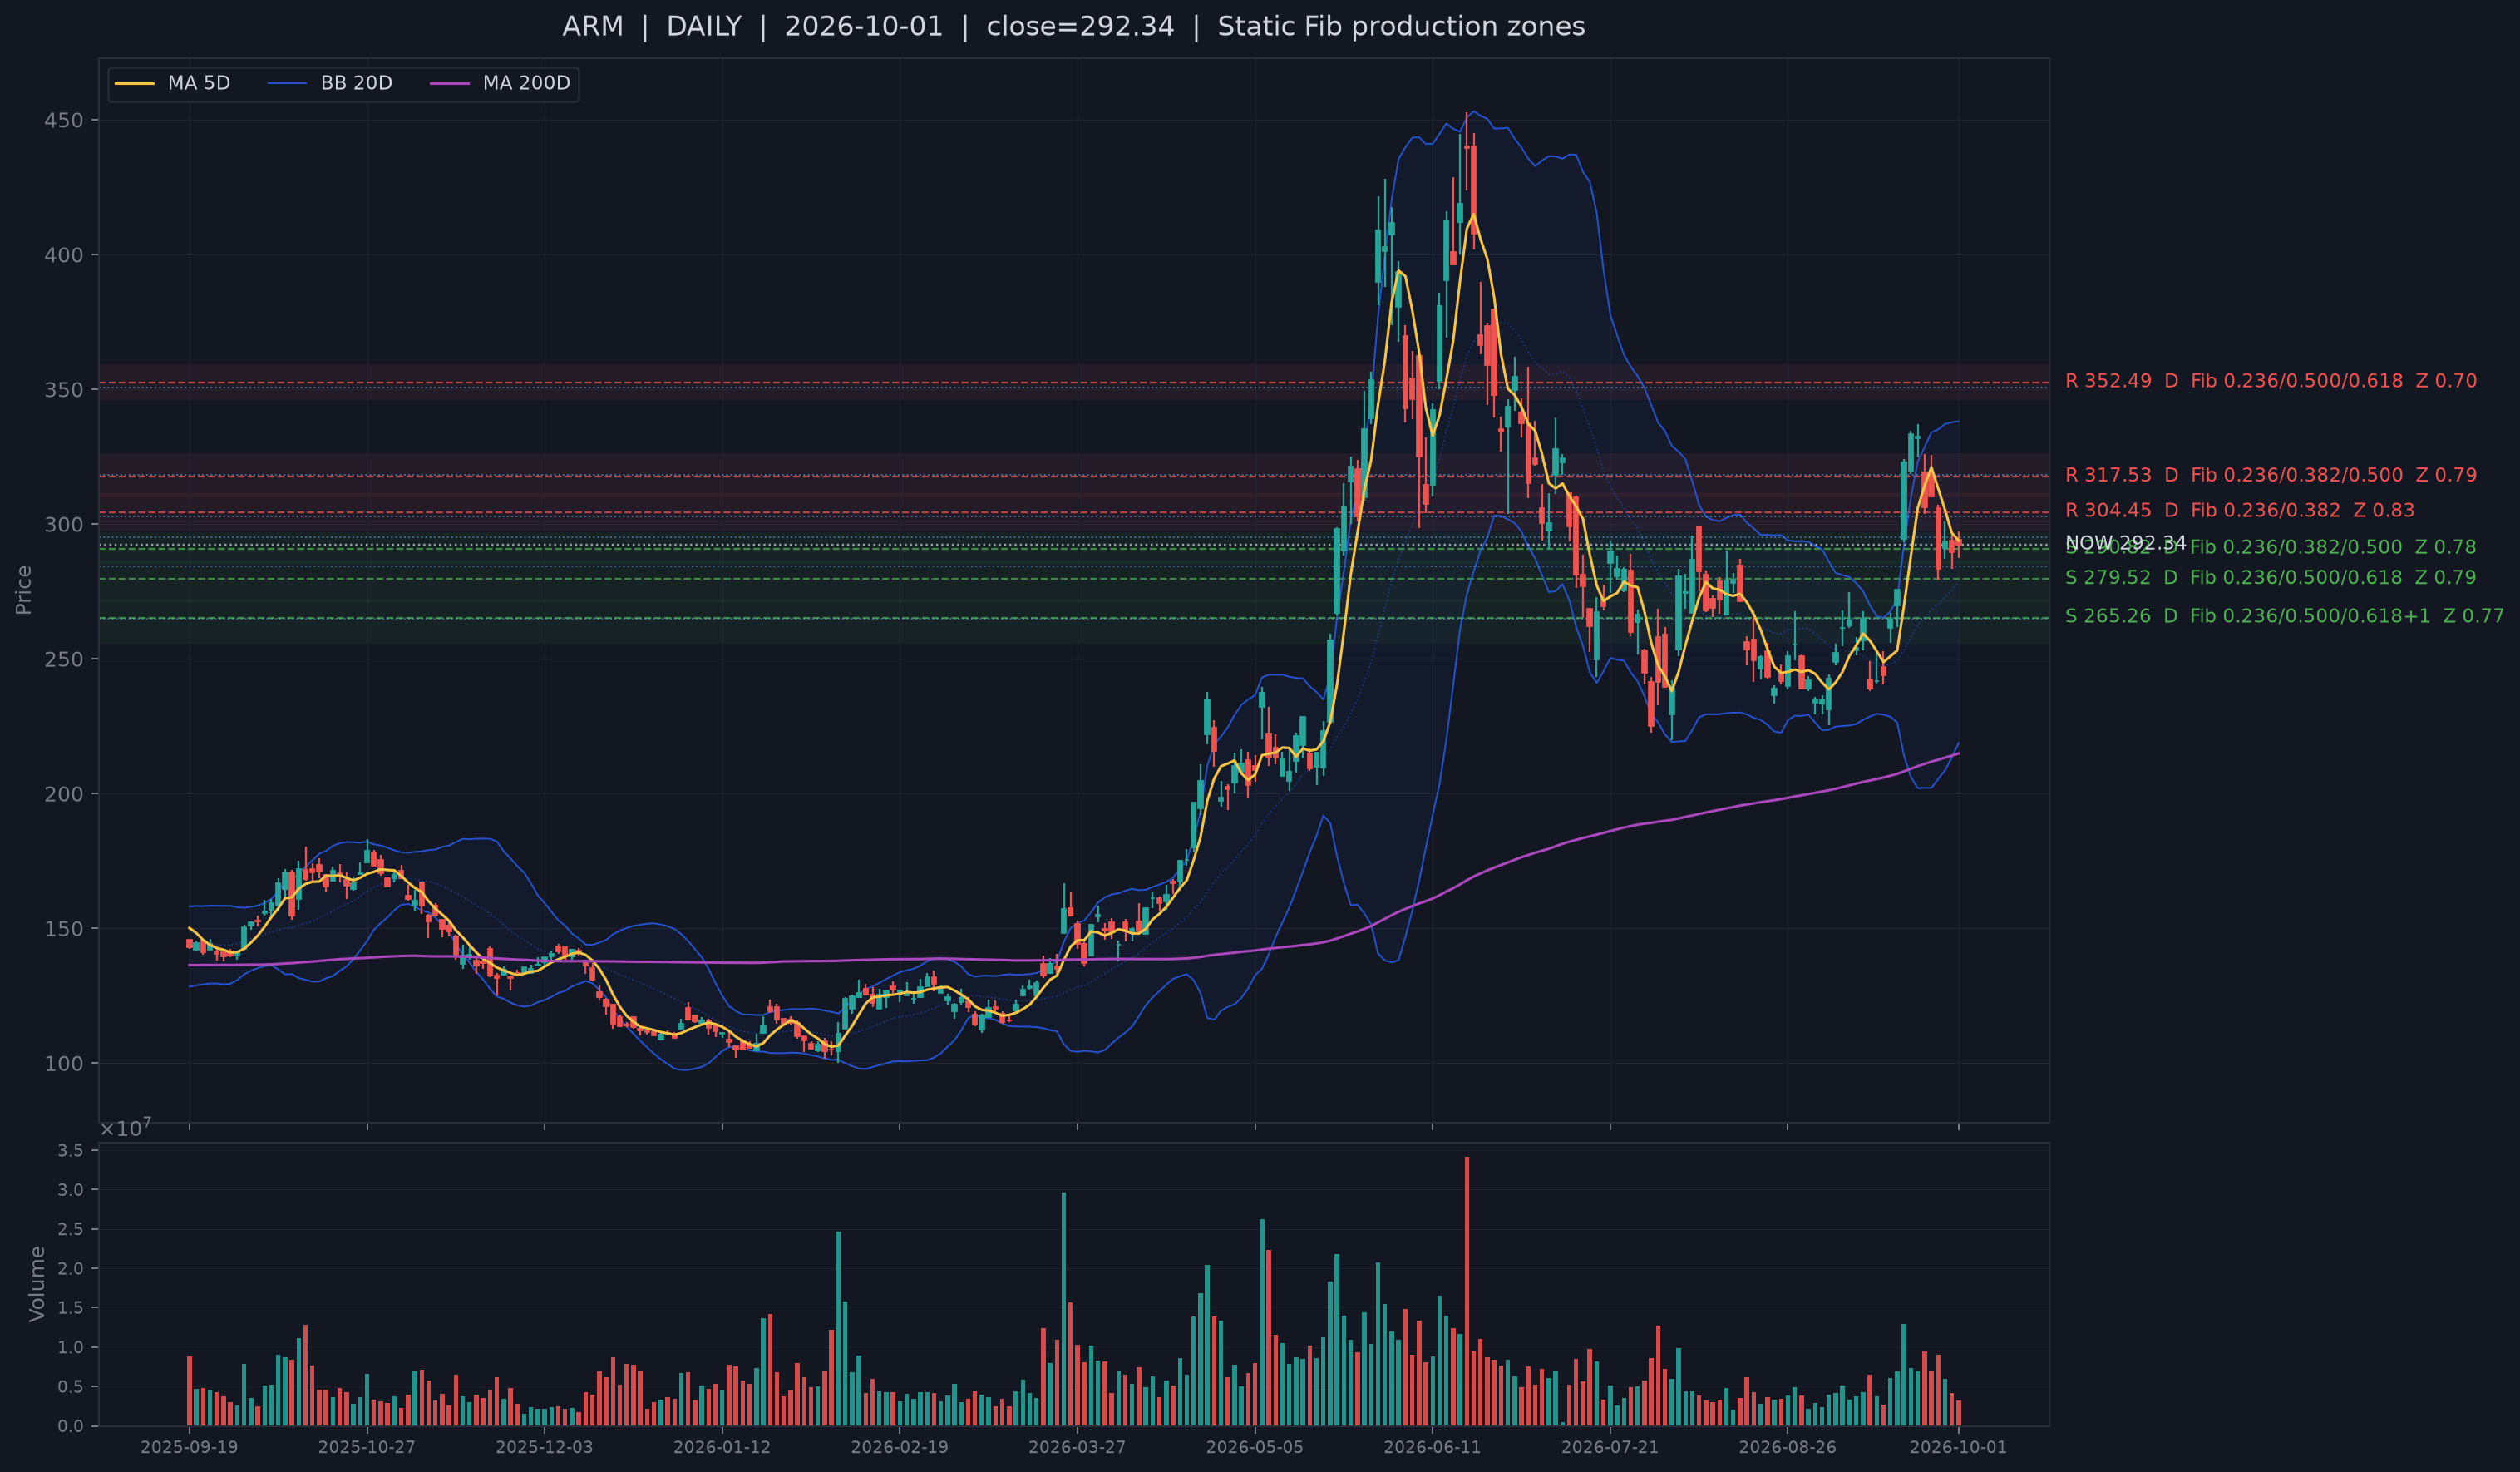
ARM is just 0.08 ATR from its live S1 center after a lower-wick test on September 30 received next-day confirmation. It also remains 5.0% above MA20. Arm's July quarter supplied a plausible business mechanism well before today's session: revenue rose 22% year over year to $1.29 billion, data-center royalties more than doubled, and the company said AGI CPU demand exceeded $2 billion across FYE27-FYE28. The counterevidence is its two-sided sector: Semiconductors is Bear-risk #1, and ARM itself has appeared frequently in recent Bear Top30 windows.
INTC is slightly farther from S1 at 0.14 ATR, but its Bull rank is much stronger at #8 and it is 8.8% above MA20. Intel's current strategy explicitly targets open, scalable AI infrastructure across cloud, enterprise and edge. Together, ARM and INTC are the clearest cases where fresh support and medium-term trend agree. Their burden is sector-level: if the semiconductor conflict resolves through Bear-risk rather than Bull leadership, individual support can still fail.
WULF and BMNR: similar sector rank, very different economic exposure
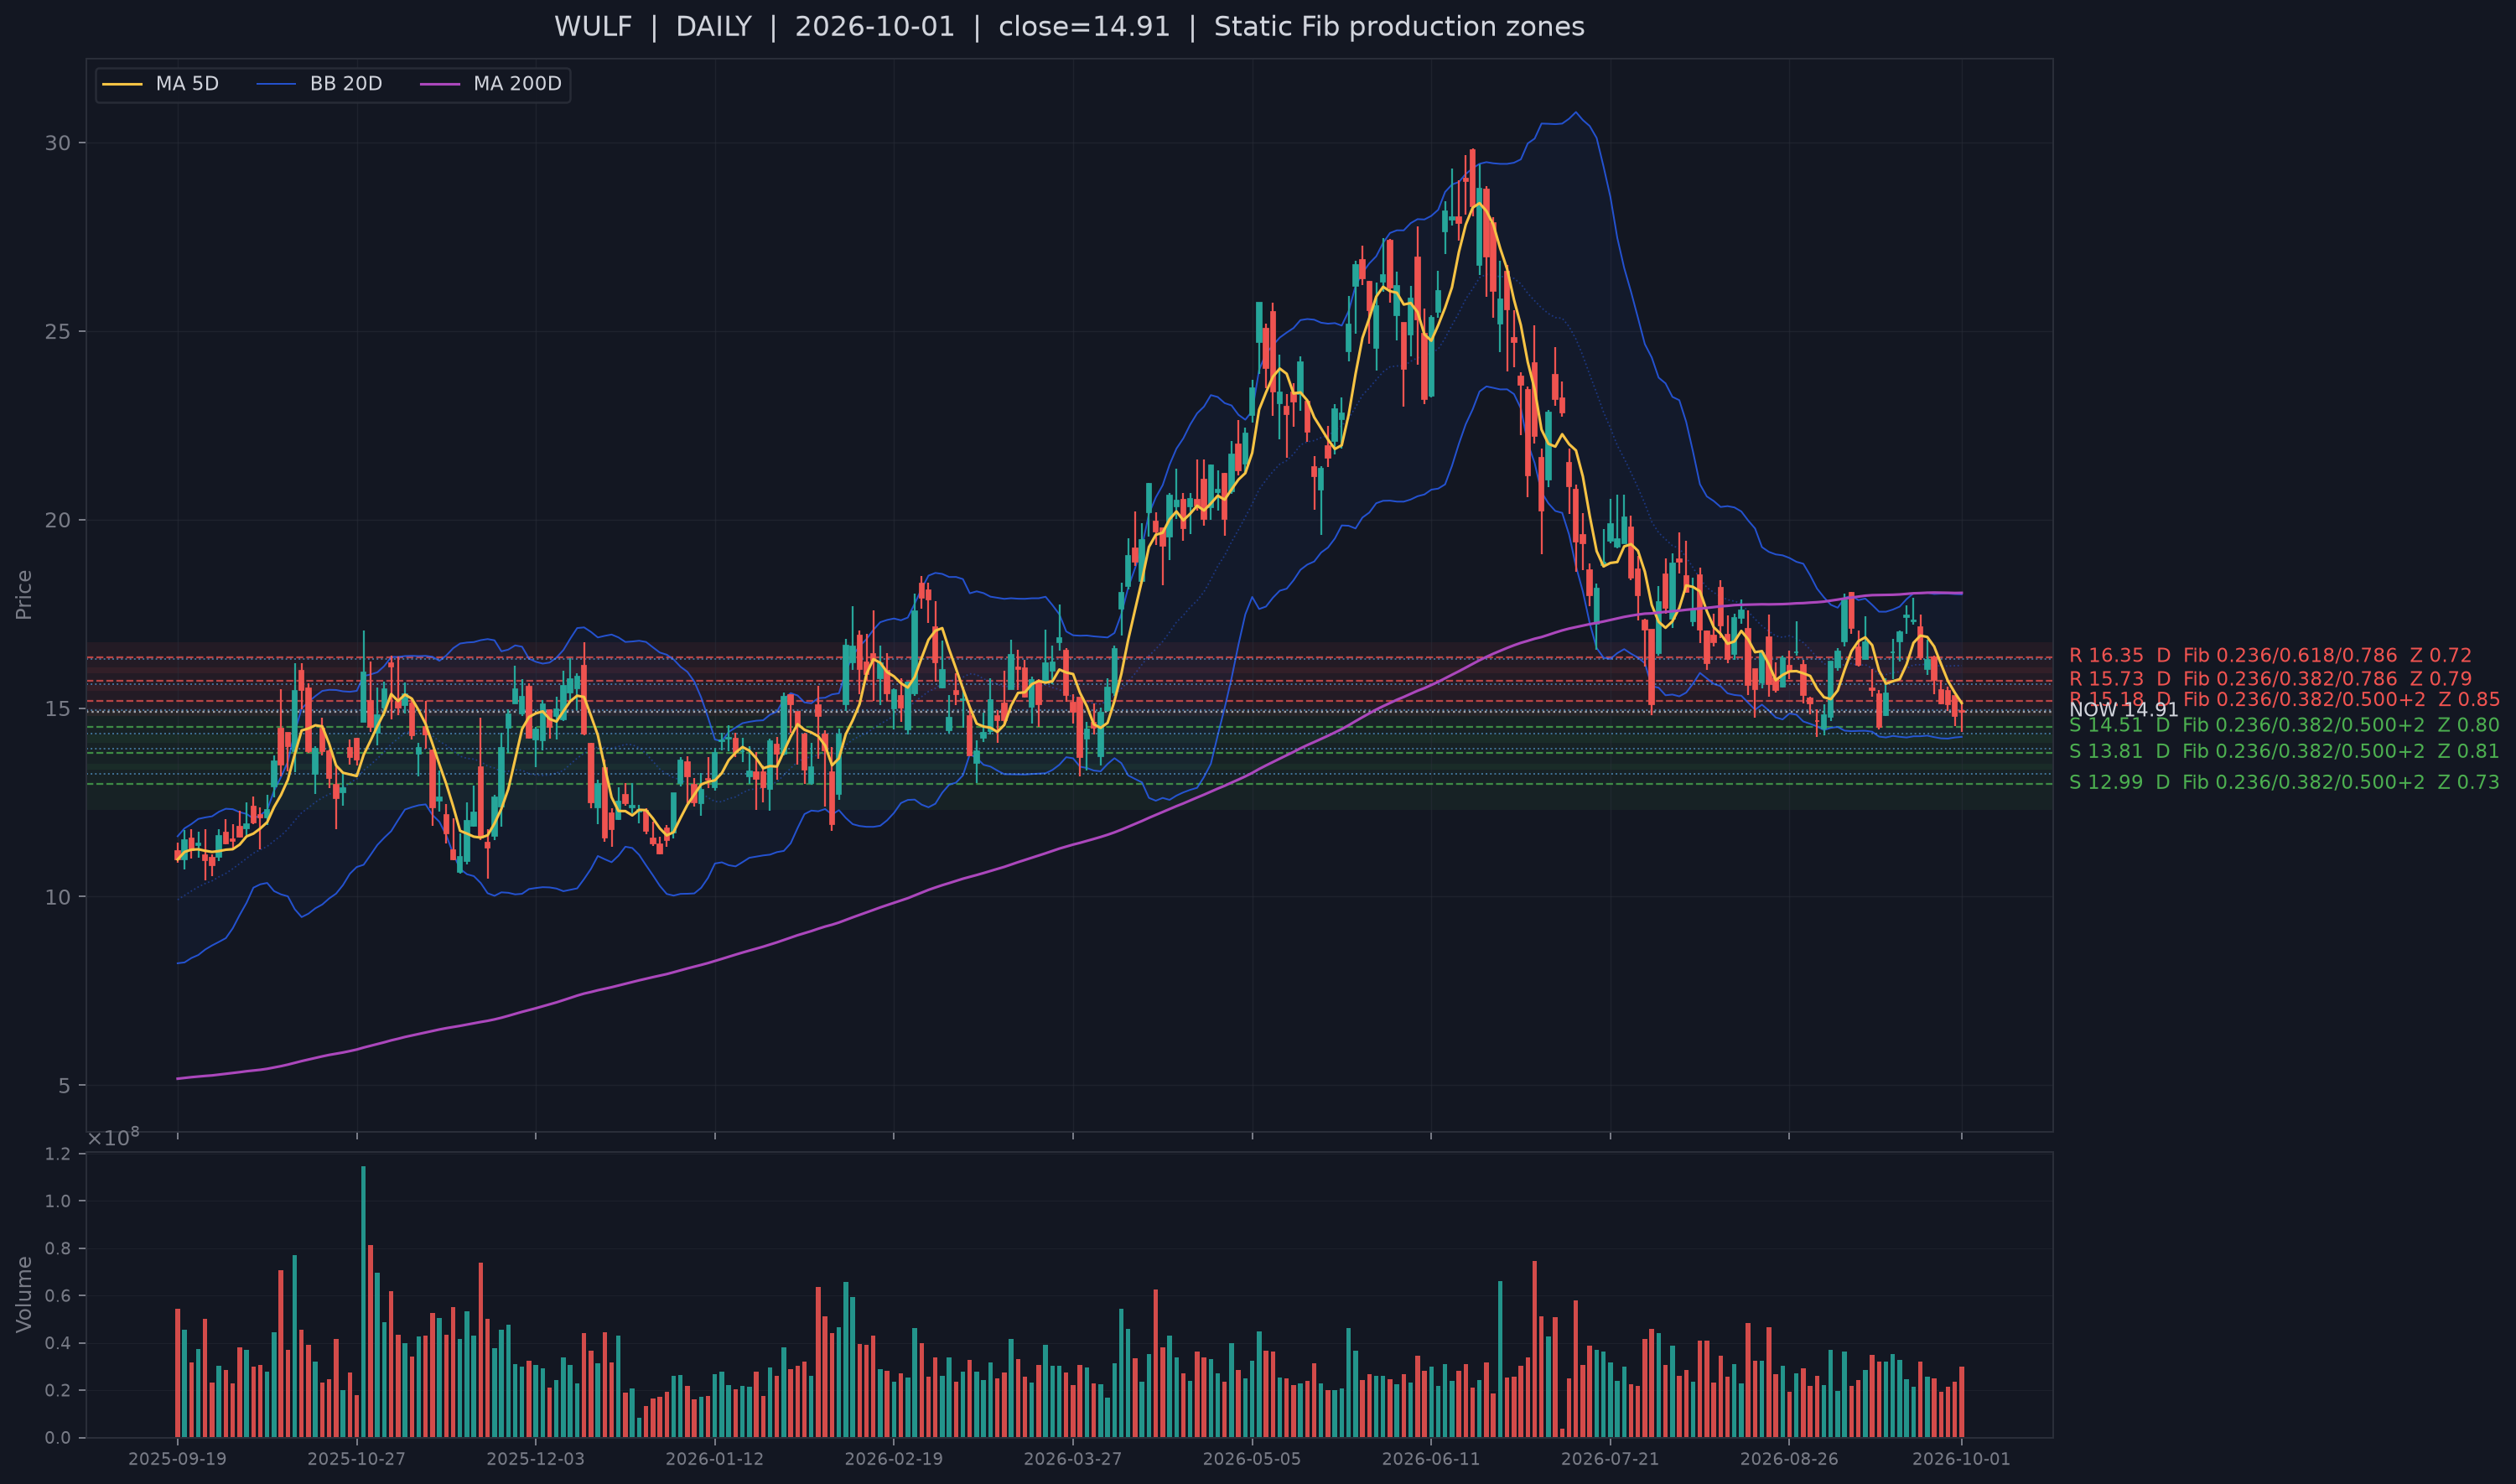
WULF passed a next-day support confirmation and remains only 0.39 ATR from live S1, but it is 7.5% below MA20. The economic story is no longer pure bitcoin mining: TeraWulf's 20-year Anthropic lease at the Justified Data Campus targets roughly 401 MW and about $19 billion of contracted revenue over the initial term, showing how scarce power/interconnection assets can migrate into AI infrastructure. The slower financial context is the warning. Financial rank is only 0.07, cash-flow margins are deeply negative, and a secondary current CBVR layer is internally mixed rather than confirming. Support is fresh; trend and capital intensity remain unresolved.
BMNR is also 0.39 ATR from live S1 but sits 3.1% above MA20. Its risk driver is different. The latest official filing cited nearly 5.98 million ETH and about $17.1 billion of crypto, cash and marketable holdings, making the equity highly sensitive to ETH/treasury repricing. The filing-based fallback financials show extraordinary revenue growth alongside deeply negative CFO and FCF margins. BMNR therefore has better current trend geometry than WULF, but a more direct balance-sheet crypto beta.
MDB: strongest Bull rank, but price and slower layers disagree
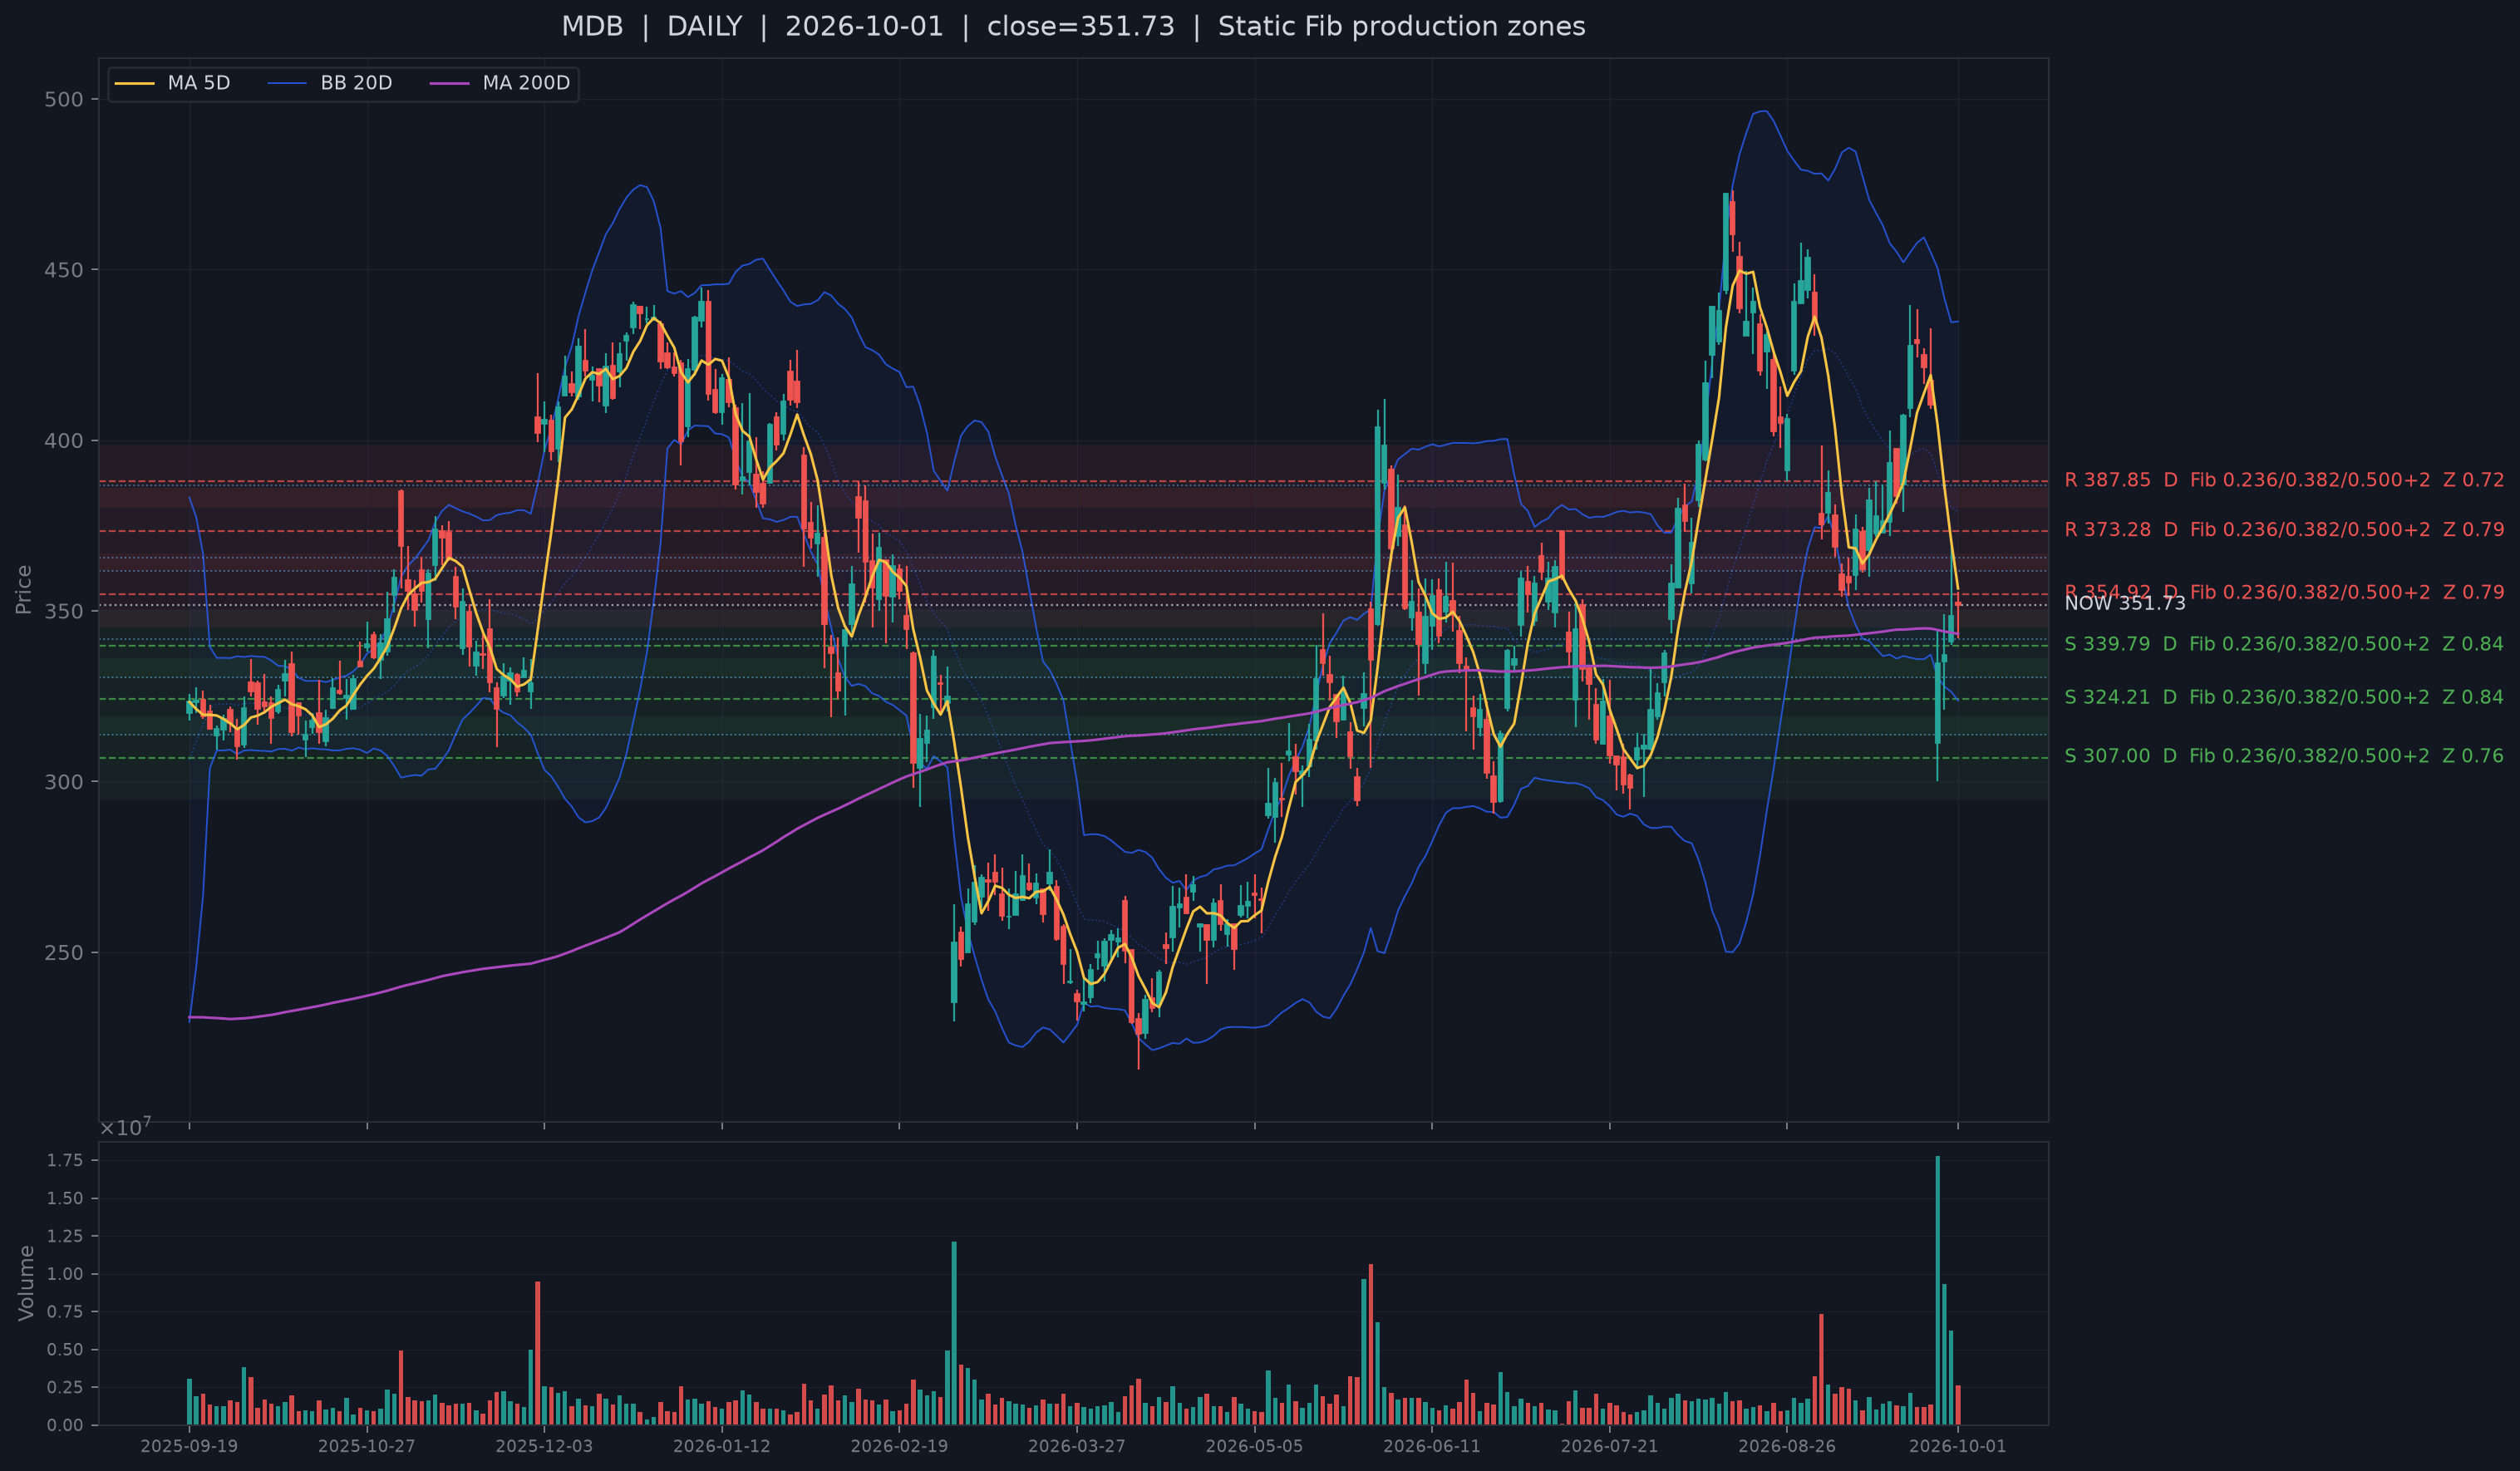
MDB has the highest Bull rank in the publication list at #2 of 295, yet it is 7.3% below MA20 and 0.44 ATR from S1. MongoDB's September 29 product release is materially relevant to the business thesis: MongoDB 9.0 targets higher throughput and Atlas Infinite is designed for extreme elasticity in AI-scale workloads. But the stock is a textbook disagreement case. The Financial layer is very strong at rank 0.94, while delayed 13F context is weak at 0.06 and price divergence is negative in both slow layers. The September 28 CEO transition is another counterweight even though the company reaffirmed guidance. Fresh support is real; medium-term transmission still needs proof.
NBIS: older support, positive MA20, and a direct AI-cloud demand channel
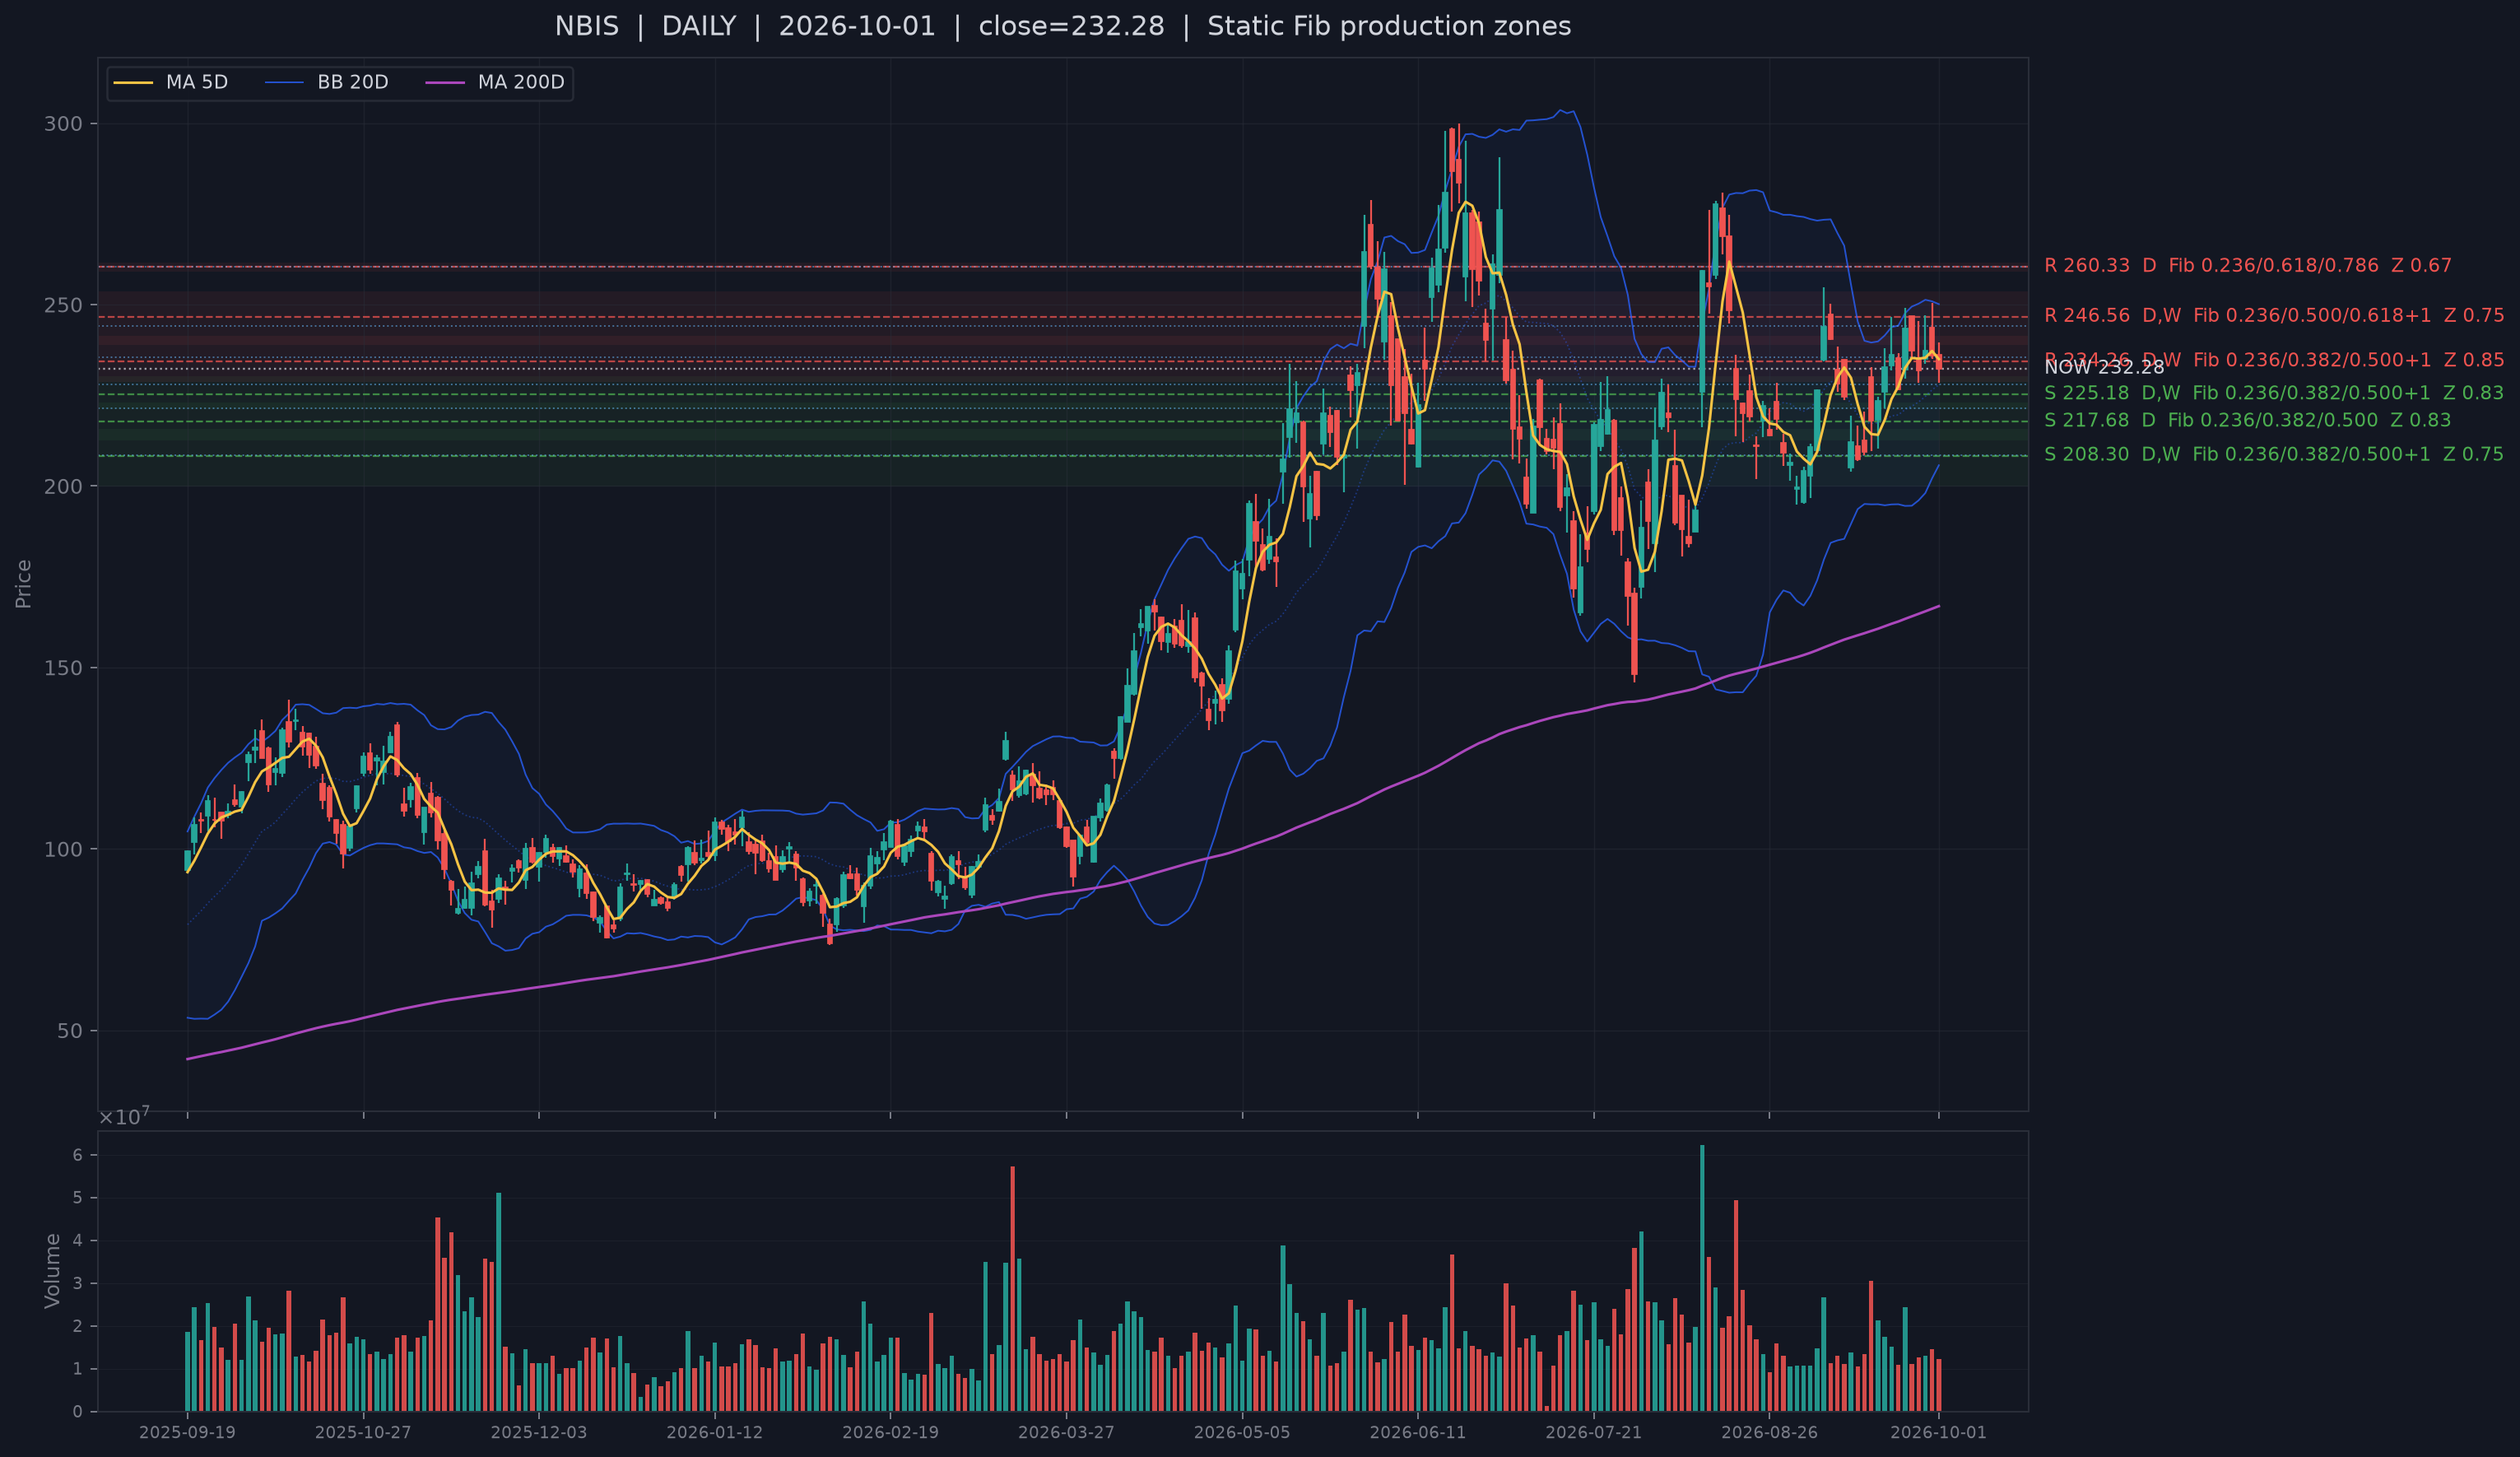
NBIS is sixth in the frozen order because its confirmation is older - September 29 - and its live-S1 distance is 0.44 ATR. It nevertheless remains 1.9% above MA20 and has positive delayed-holdings context. Nebius's September 8 Palantir partnership provides a clean pre-session business mechanism: Palantir named Nebius its preferred sovereign AI-infrastructure partner and planned to bring Nebius compute and inference endpoints into its enterprise perimeter. The sector context is now supportive but narrow: Internet/Media/Telecom is eligible Bull #5 in the authoritative current 04 packet, yet NBIS is its only Bull Top30 name. NBIS's support is also older than the first four names.
6. Next 3-10 day tests
Base case: index repair can continue, but internal confirmation is incomplete and confidence is moderate. The S&P is almost back on MA20, the Nasdaq still has a medium-term cushion and equal-weight price improved. The stronger bearish case is not yet complete because down-3% breadth is quiet and 20-day new-low pressure is not extreme. The reason confidence is capped is the combination of weak breadth, +2.22z dispersion and an order-flow close in which two of three axes remain below neutral.
What would strengthen the base case: the S&P holds above MA20; breadth rises from 0.38; cross-sectional volatility retreats; Aggressor and Alignment reclaim 50 early and stay there through midday; Bull-aligned breadth expands without a matching increase in Bear-aligned breadth; and the conflicted Semiconductor/Enterprise sectors reduce Bear-risk while their support-confirmed names hold S1.
What would falsify it: dispersion stays above +2z and begins to coincide with rising down-3% breadth; the Nasdaq loses MA20; another session produces a strong opening percentile but fails into a two-axis-below-neutral close; or the selected stocks lose their live S1 zones before sector breadth improves. Macro pressure would also re-enter the bearish case if the currently negative five-day F shock turns positive again while the absolute F state remains elevated.
Sources
- Reuters, 2026-10-01 - Post-close recap of the completed U.S. session, including the intraday Treasury-yield surge and subsequent easing. Used as recap/forward context, not to backfill private causality.
- CFTC, 2026-10-01 - Official weekly COT release schedule and previous-Tuesday reporting lag convention.
- Reuters Breakingviews, 2026-09-23 - Power scarcity and the repurposing of miner power capacity for AI infrastructure.
- TeraWulf / SEC, 2026-07-06 - TeraWulf 20-year Anthropic AI-infrastructure lease and contracted-revenue context.
- BitMine / SEC, 2026-09-21 - BitMine ETH holdings and crypto-treasury balance-sheet exposure.
- Reuters, 2026-10-01 - September semiconductor export surge as session-available global AI/compute demand context.
- Arm, 2026-07-29 - Arm Q1 FYE27 revenue, data-center royalty growth and AGI CPU demand.
- Intel, 2026-08-26 - Intel open/scalable AI-infrastructure strategy and product/ecosystem context.
- MongoDB, 2026-09-29 - MongoDB 9.0 and Atlas Infinite AI-scale product context.
- MongoDB, 2026-09-28 - CEO transition and reaffirmed Q3/FY27 guidance as counterevidence/governance context.
- Nebius, 2026-09-08 - Palantir partnership and Nebius sovereign-AI infrastructure demand context.