Opening Order Flow Fails as Breadth Weakens and Capital-Markets Leadership Takes Over
A strong opening order-flow state failed, breadth weakened and the S&P slipped below MA20, while broad liquidation remained unconfirmed and three support-filtered stocks stayed near live S1.
Horizon: 3-10 trading days.
This research is designed for 3-10 trading-day swing setups. The signals and conclusions may not transfer to intraday trading or longer-horizon investing.
Opening Order Flow Fails as Breadth Weakens and Capital-Markets Leadership Takes Over
The market ended the quarter with a sharper internal warning than the index tape alone suggests. The S&P 500 closed 0.51% below MA5 and 0.26% below MA20, while the Nasdaq Composite remained 1.12% above MA20 but slipped 0.14% below MA5. Both benchmarks finished at the bottom of their daily ranges. Breadth fell to 0.299, near the lower tail of its one-year distribution, and the McClellan-style breadth oscillator weakened to -1.35z.
The deterioration is real, but it is still incomplete as a liquidation signal. Twenty-day and 252-day new-low pressure are elevated at +1.78z and +1.86z, yet the share of stocks falling 3% or more is still only -0.53z and cross-sectional volatility is -1.42z. That combination says the weak tail is expanding without the broad, synchronized damage that would normally confirm a full propagation phase.
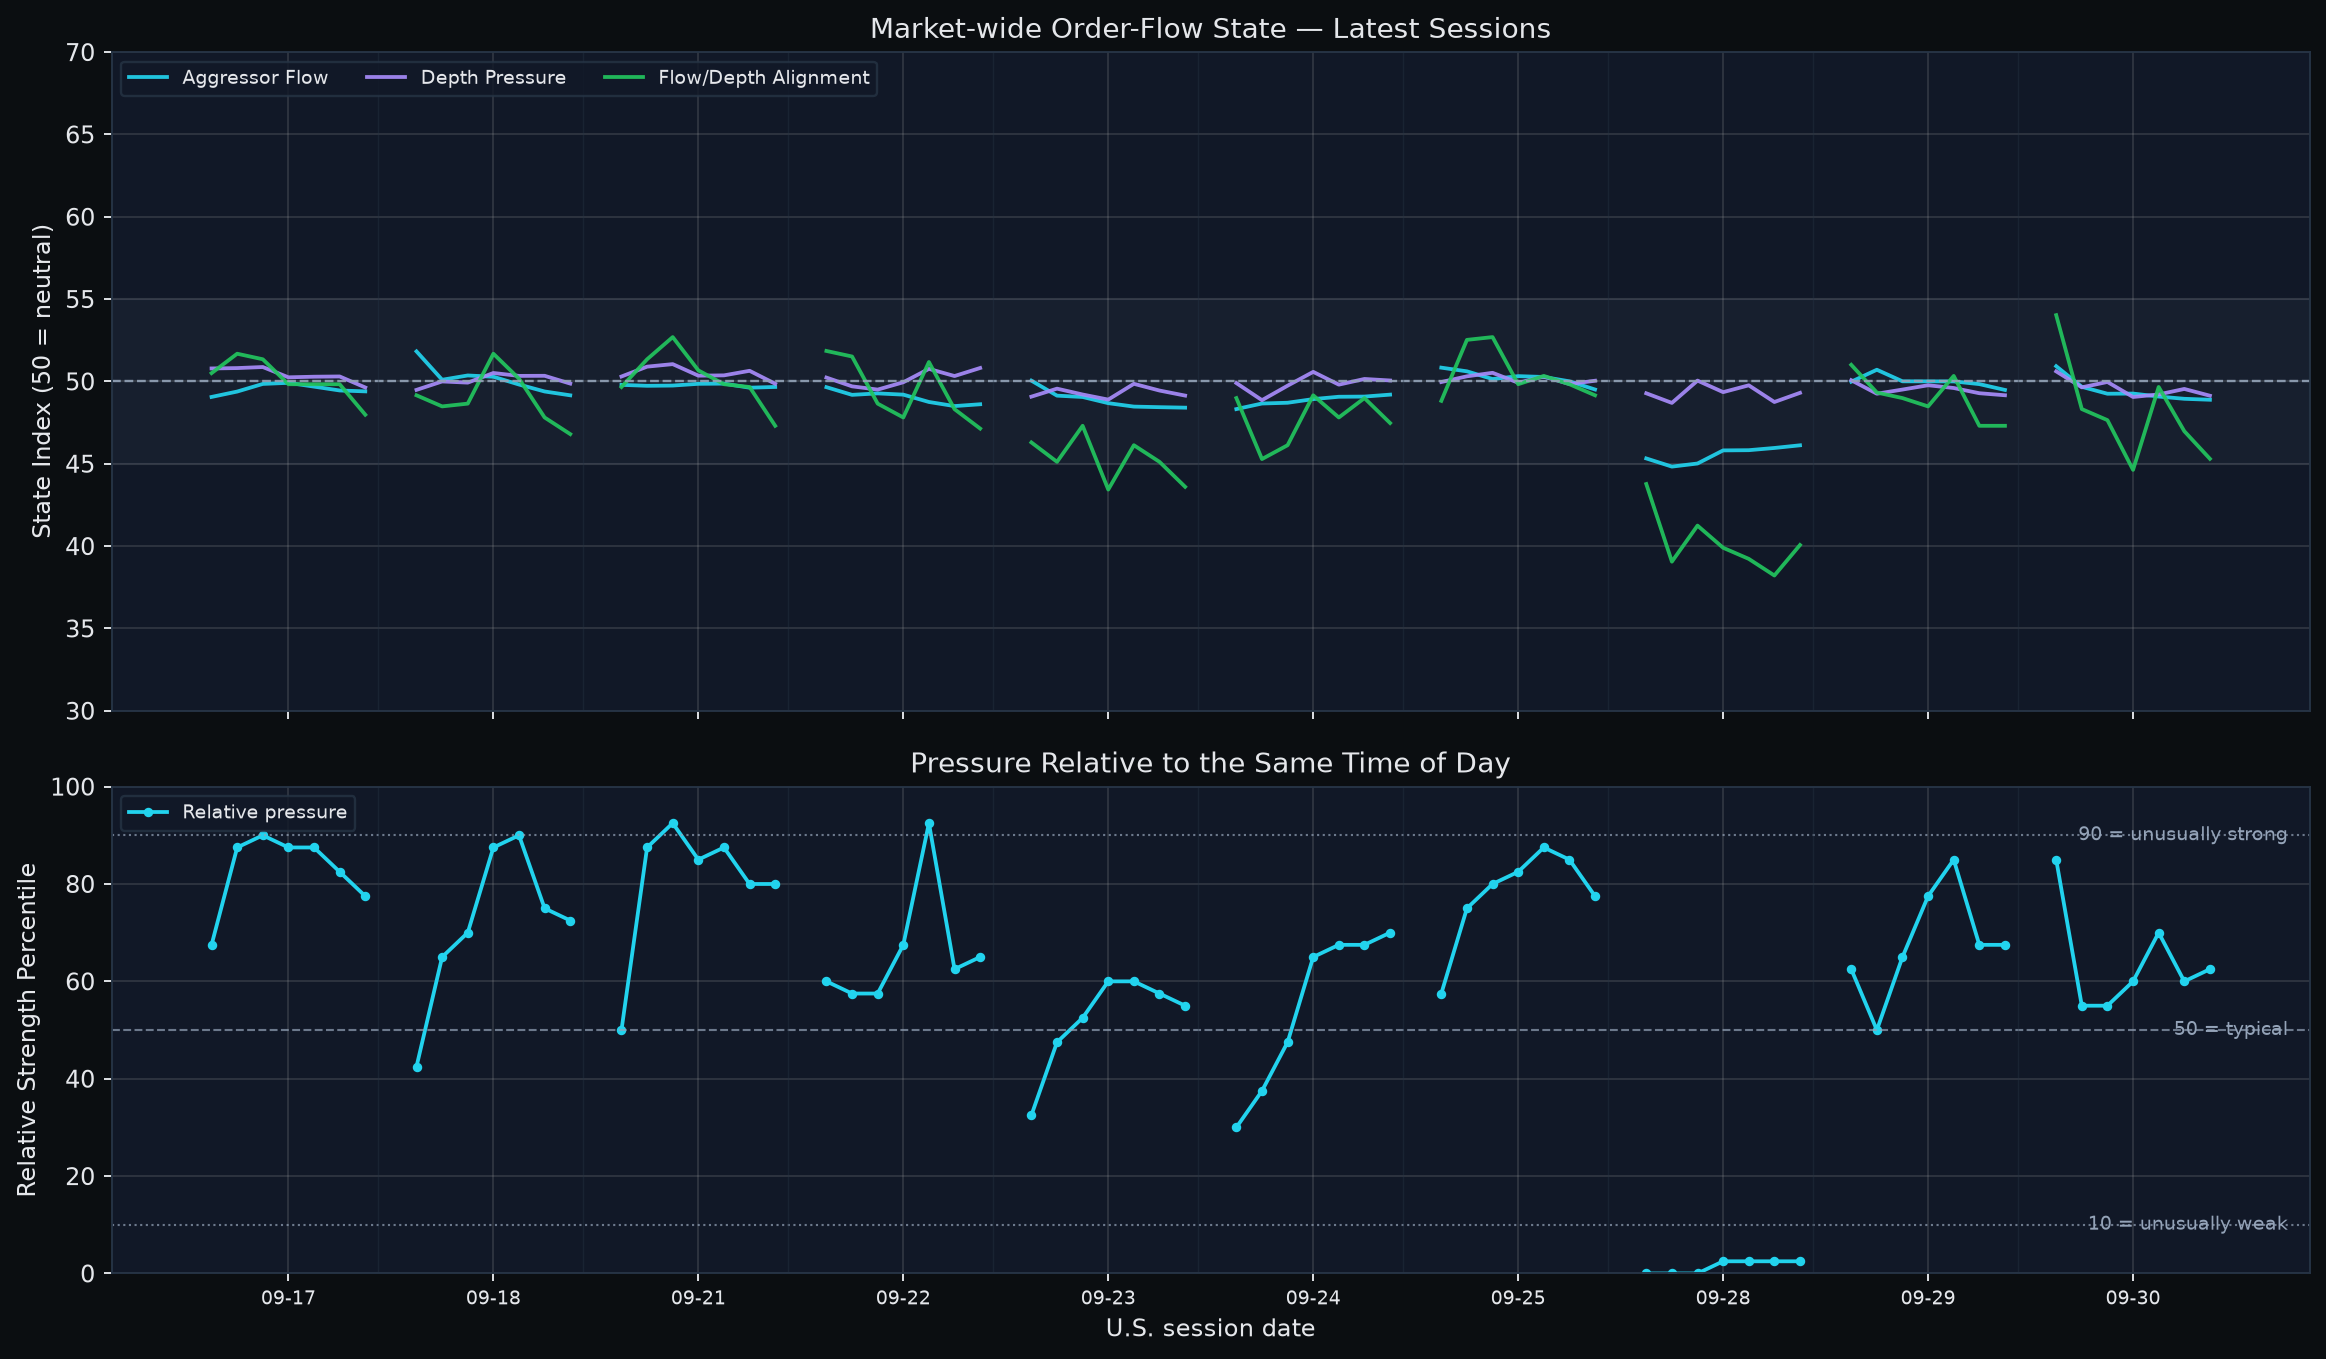
The strongest warning came from market-wide order flow. Aggressor Flow, Depth Pressure and Flow/Depth Alignment all opened above the 50 neutral reference at 50.93, 50.61 and 54.03. By 10:30 all three were below 50, and none recovered durably. They closed at 48.89, 49.13 and 45.30. Bull-aligned breadth collapsed from 22.8% at the open to 9.4% at the close, Bear-aligned breadth rose to 18.8%, and the equal-weight universe lost 0.58% from open to close. This is not merely a weak close; it is a failed opening impulse followed by late deterioration.
My 3-10TD base case is therefore a selective market with a high repair burden, not yet a synchronized breakdown. The macro layer is mixed enough to prevent a one-way conclusion: price-of-money stress remains historically high, but the fresh five-day rate shock has reversed lower; relative preference points toward short Treasuries rather than equities; and cross-asset coupling has broadened mainly through metals and duration nodes rather than equity itself. Sector leadership is also conflicted: Asset Management & Capital Markets moved to #1, but three of the Bull Top5 sectors simultaneously rank in the Bear-risk Top4. The stock screen still finds ORCL, CVNA and CRWV near freshly confirmed structural support, but only CRWV is above MA20. Support exists; broad confirmation does not.
How to read today's indicators
| Indicator | Reader scale | Interpretation |
|---|---|---|
| Market-wide order-flow state | Three component indices; 50 = neutral | Aggressor Flow, Depth Pressure and Flow/Depth Alignment answer different questions. Read confirmation or divergence across the three; they are not probabilities. |
| Same-time order-flow percentile | 0-100; 50 = same-time historical median | 90 is unusually strong and 10 unusually weak for that intraday slot. This is historical context, not event probability. |
| Flow × depth state breadth | Cross-sectional percentages | Bull/Bear aligned show joint direction; absorption-compatible states describe divergence only, not proven actor intent. |
| Market breadth | 0-1; practical balance ~0.50 | Above 0.50 means broader participation. Direction and slope show whether participation is improving or fading. |
| z-score | 0 = historical mean | |z| ~1 is notable and |z| ~2 is unusual. It is standardized distance, not probability. |
| Historical percentile | 0-100; 50 = median | 90+ is historically elevated. A percentile is not an event probability. |
| FLOW_SCORE_RANK | 0-1; 0.50 = median | 0.80+ is relatively strong slow context. It is confirmation/context, not a standalone entry signal. |
| Financial / 13F price divergence | Approx. -1 to +1; 0 = little gap | Positive means slow context is ahead of price; negative means price is ahead. ±0.20 / ±0.50 are reader bands only, not learned thresholds. |
| Expected next-session range | Non-directional high-low amplitude | Always pair the raw estimate with its same-day cross-sectional percentile. It is not an upside target. |
1. Price, breadth and damage: the S&P loses MA20, but broad damage still lags
| Layer | Current reading | Interpretation |
|---|---|---|
| S&P 500 | -0.51% vs MA5; -0.26% vs MA20; close at daily low | Fast momentum is weak and the medium-term cushion has slipped negative. |
| Nasdaq Composite | -0.14% vs MA5; +1.12% vs MA20; close at daily low | Still has a meaningful MA20 cushion, but the closing location and fast momentum are weak. |
| Breadth | 0.299; 5TD change -0.125; ~6th percentile | Participation is distinctly weak even though the 20-day slope itself is only mildly negative. |
| McClellan-style breadth | -1.35z; 5TD change -1.12z | Short-horizon participation has contracted materially. |
| New-low damage | 20D +1.78z; 252D +1.86z | The weak tail is elevated on both short and long lookbacks. |
| Propagation checks | Down-3% breadth -0.53z; cross-sectional vol -1.42z | Large-decline breadth and dispersion still do not confirm synchronized liquidation. |
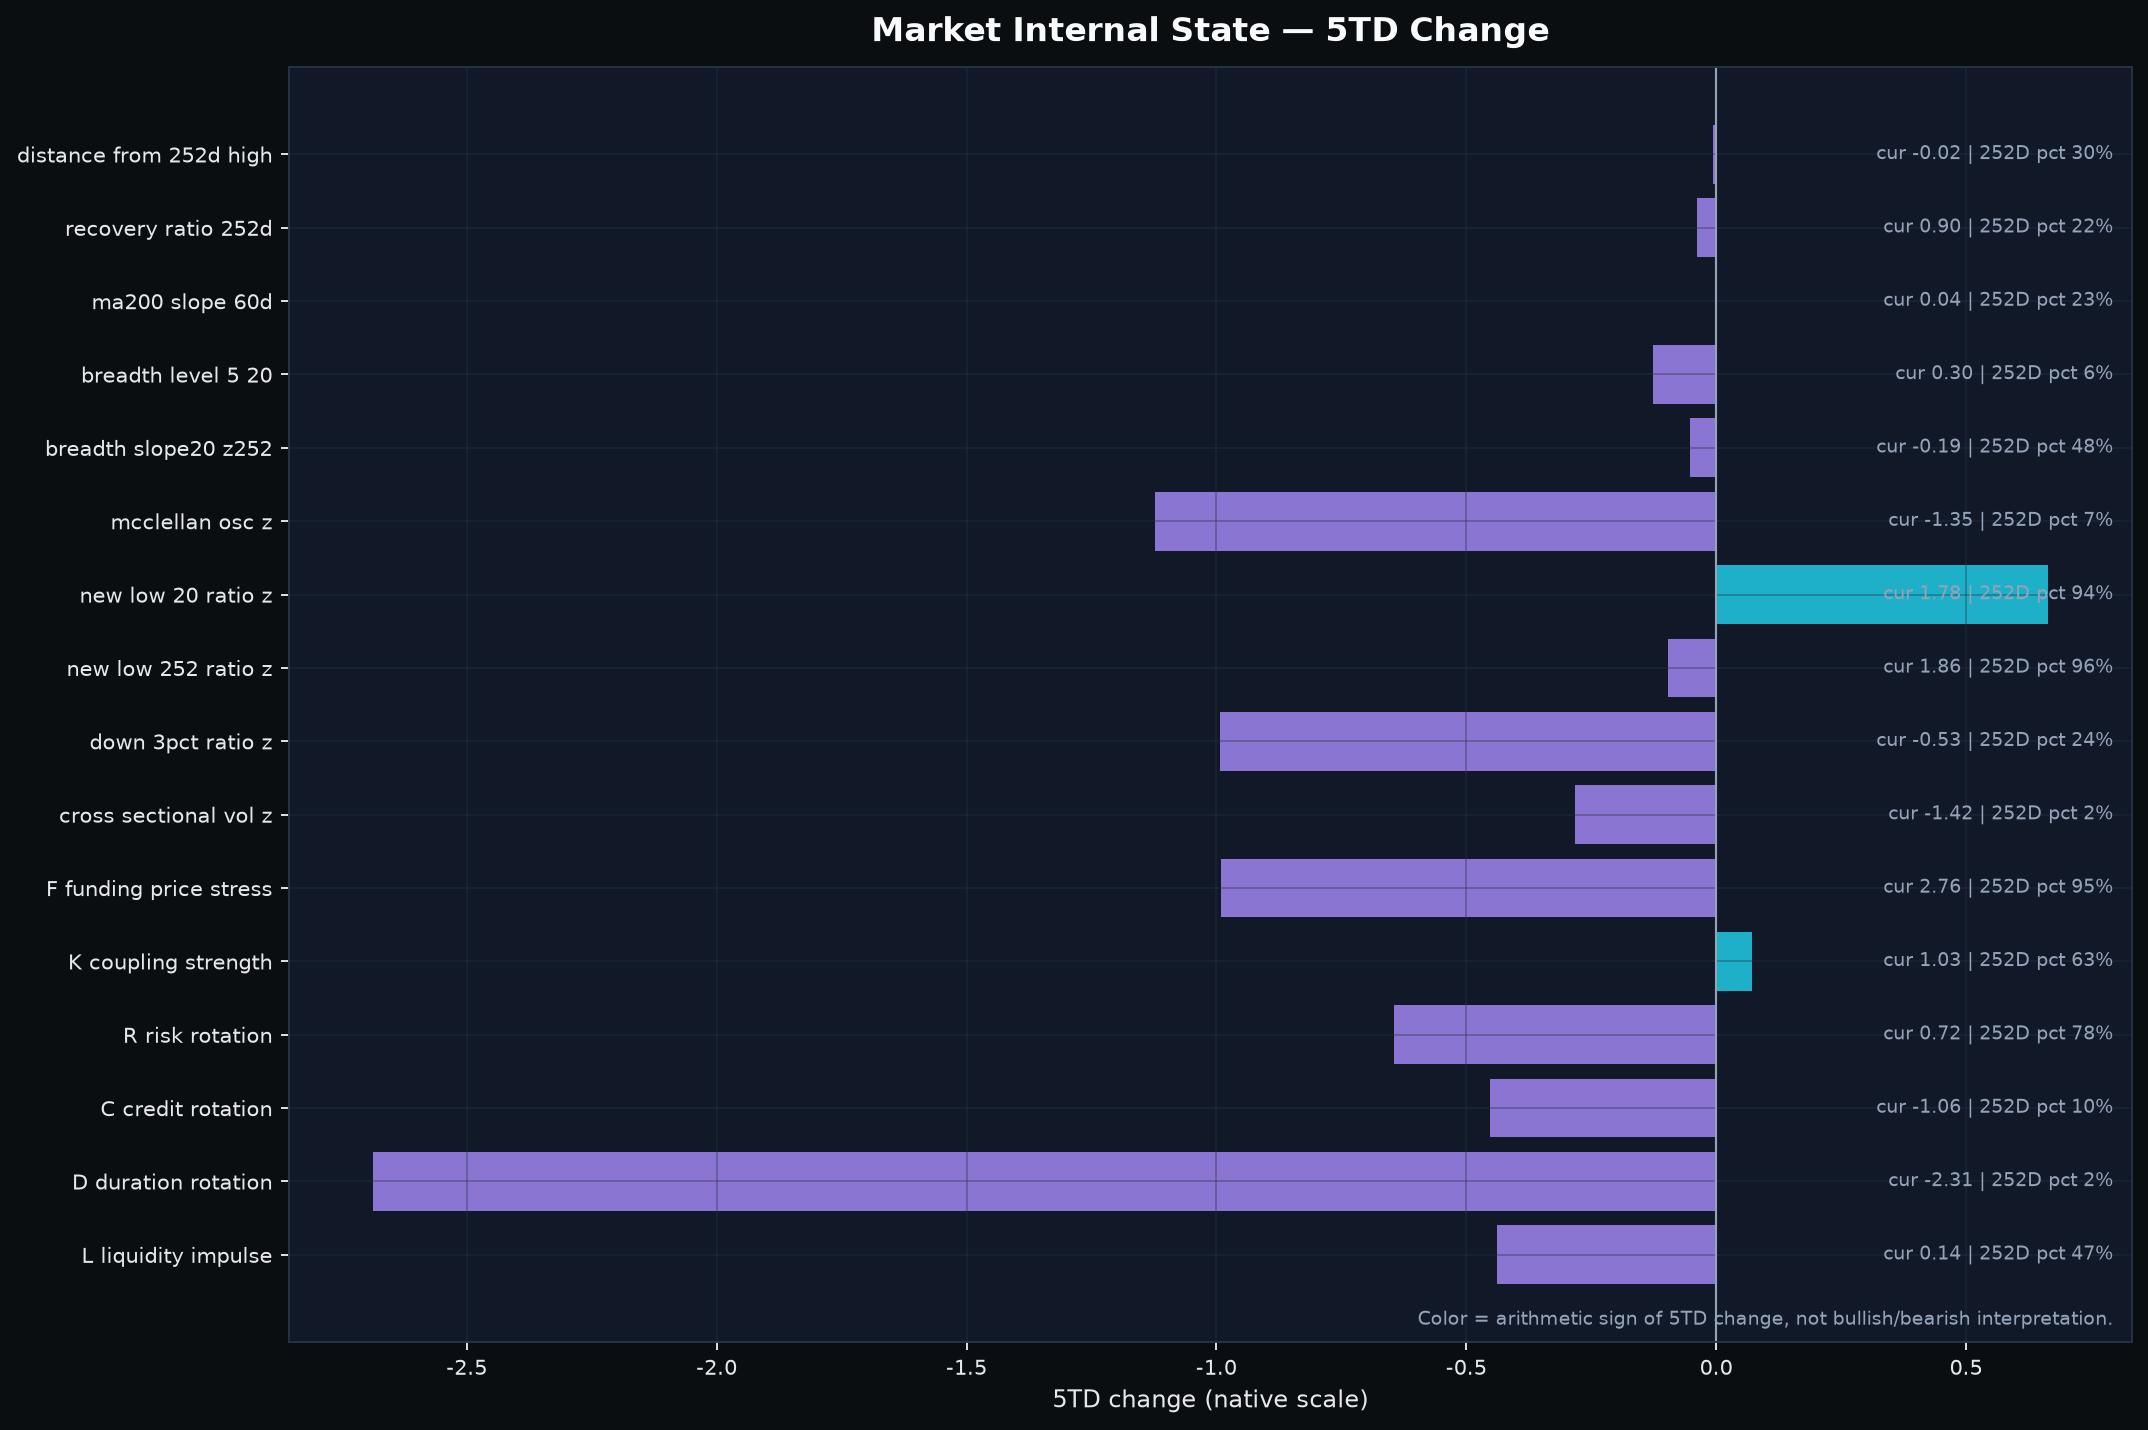
The distinction between weak participation and broad damage matters more today than the headline index move. The S&P has now lost its 20-day average while the Nasdaq still holds one, and breadth is very weak. At the same time, the market has not produced the large-decline breadth or dispersion pattern that would make the weakness self-reinforcing across the whole universe. That leaves a narrow window in which selective support setups can still work even as the broad tape becomes less forgiving.
Public macro data help explain why index-level resilience has not completely disappeared. August PCE inflation rose 3.4% year over year and 0.3% month over month, while core PCE rose 3.0% year over year. Reuters reported that the inflation increase was softer than markets had expected, even as long-term Treasury yields remained elevated and the S&P finished slightly lower. That backdrop is consistent with a market receiving some front-end rate relief without escaping the broader high-yield environment.
Falsifier: if the Nasdaq also loses MA20 while new-low pressure is joined by rising down-3% breadth and cross-sectional volatility, the selective-pullback interpretation fails and the evidence shifts toward active propagation. Conversely, if new-low pressure compresses while breadth stabilizes and the S&P reclaims MA20, the current weakness can remain a narrow reset rather than a regime break.
2. Order flow: a strong open failed, and the close inherited a high repair burden
| Time | Aggressor | Depth | Alignment | Same-time pct. | Bull aligned | Bear aligned | Buy absorption | Sell absorption | EW bar |
|---|---|---|---|---|---|---|---|---|---|
| 09:30 | 50.93 | 50.61 | 54.03 | 85.0 | 22.8% | 14.8% | 15.8% | 11.7% | -0.34% |
| 10:30 | 49.67 | 49.64 | 48.32 | 55.0 | 15.1% | 18.5% | 17.4% | 15.4% | +0.01% |
| 11:30 | 49.25 | 49.97 | 47.65 | 55.0 | 16.1% | 20.8% | 17.1% | 14.4% | -0.03% |
| 12:30 | 49.26 | 49.06 | 44.63 | 60.0 | 12.8% | 23.5% | 16.1% | 13.8% | -0.20% |
| 13:30 | 49.08 | 49.21 | 49.66 | 70.0 | 15.1% | 15.8% | 17.4% | 11.4% | -0.08% |
| 14:30 | 48.95 | 49.54 | 46.98 | 60.0 | 12.1% | 18.1% | 18.8% | 13.1% | +0.00% |
| 15:30 | 48.89 | 49.13 | 45.30 | 62.5 | 9.4% | 18.8% | 17.8% | 14.4% | -0.28% |
The opening bar looked constructive in absolute terms: all three axes were above neutral, Alignment was 54.03, and the reading sat at the 85th same-time percentile. The problem is persistence. By 10:30 Aggressor had fallen 1.25 points, Depth 0.97 and Alignment 5.70; each moved below 50. The session never produced a durable neutral reclaim after that. Alignment briefly improved from 44.63 at 12:30 to 49.66 at 13:30, but that was a repair attempt that stopped short of neutral.
The late window did not rescue the state. From 13:30 to the close, Aggressor slipped another 0.20 points and Alignment lost 4.36; Depth was roughly flat on the broader late window but deteriorated 0.41 in the final hour. The final bar therefore carried a clear deterioration impulse in two of the three axes, with no axis improving enough to reclaim neutral. Bull-aligned breadth fell another 2.68 percentage points in the final hour while Bear-aligned breadth rose 0.67.
Path and absolute state tell the same story today. All three axes closed below 50, with reclaim distances of roughly 1.11 points for Aggressor, 0.87 for Depth and 4.70 for Alignment. The 62.5 same-time percentile means the close was not historically extreme for that exact time of day, but that does not repair the absolute state. The equal-weight universe fell 0.58% from open to close, which confirms that the order-flow deterioration had a broad price response.
Next-session burden: a constructive reset needs an early reclaim across all three axes and, more importantly, persistence. A quick opening bounce that leaves Alignment below 50 or fades by midday would repeat the same failed-impulse pattern. Confirmation also needs Bull-aligned breadth to recover and equal-weight price/breadth/damage to stop deteriorating. Without that, today's failed opening remains the dominant microstructure fact.
3. Cross-asset: funding stress is high, but the fresh shock is easing
| Layer | Current reading | What it means |
|---|---|---|
| F - price-of-money stress | Raw 0.48; state +2.43z; 5D shock -1.02z | The level is still historically tight, but the newest five-day impulse has eased rather than tightened further. |
| F components | 2Y +25bp; Real10 +23bp; 5D component change -9bp / +1bp | The recent easing came mainly from the front end; real-rate pressure has barely eased. |
| R - relative preference | 20D +0.605; top destination = short Treasury | Price-implied preference has moved toward short-duration government bonds. This is not observed fund flow. |
| K - coupling strength | Raw 0.515; +1.03z; 20D +0.073 | The common macro mode strengthened moderately, but K does not specify bullish or bearish direction. |
| K node contribution | Precious metals 31.5%; industrial metals 29.1%; long Treasury 16.7%; equity 5.9% | The rise in coupling is not primarily equity-led. |
| CFTC lagged positioning | Equity ratio +30.8%, 4-report change +3.12pp; short-Treasury ratio -47.2%, change -3.71pp | Lagged futures positioning is mixed and does not cleanly confirm the current R destination. |
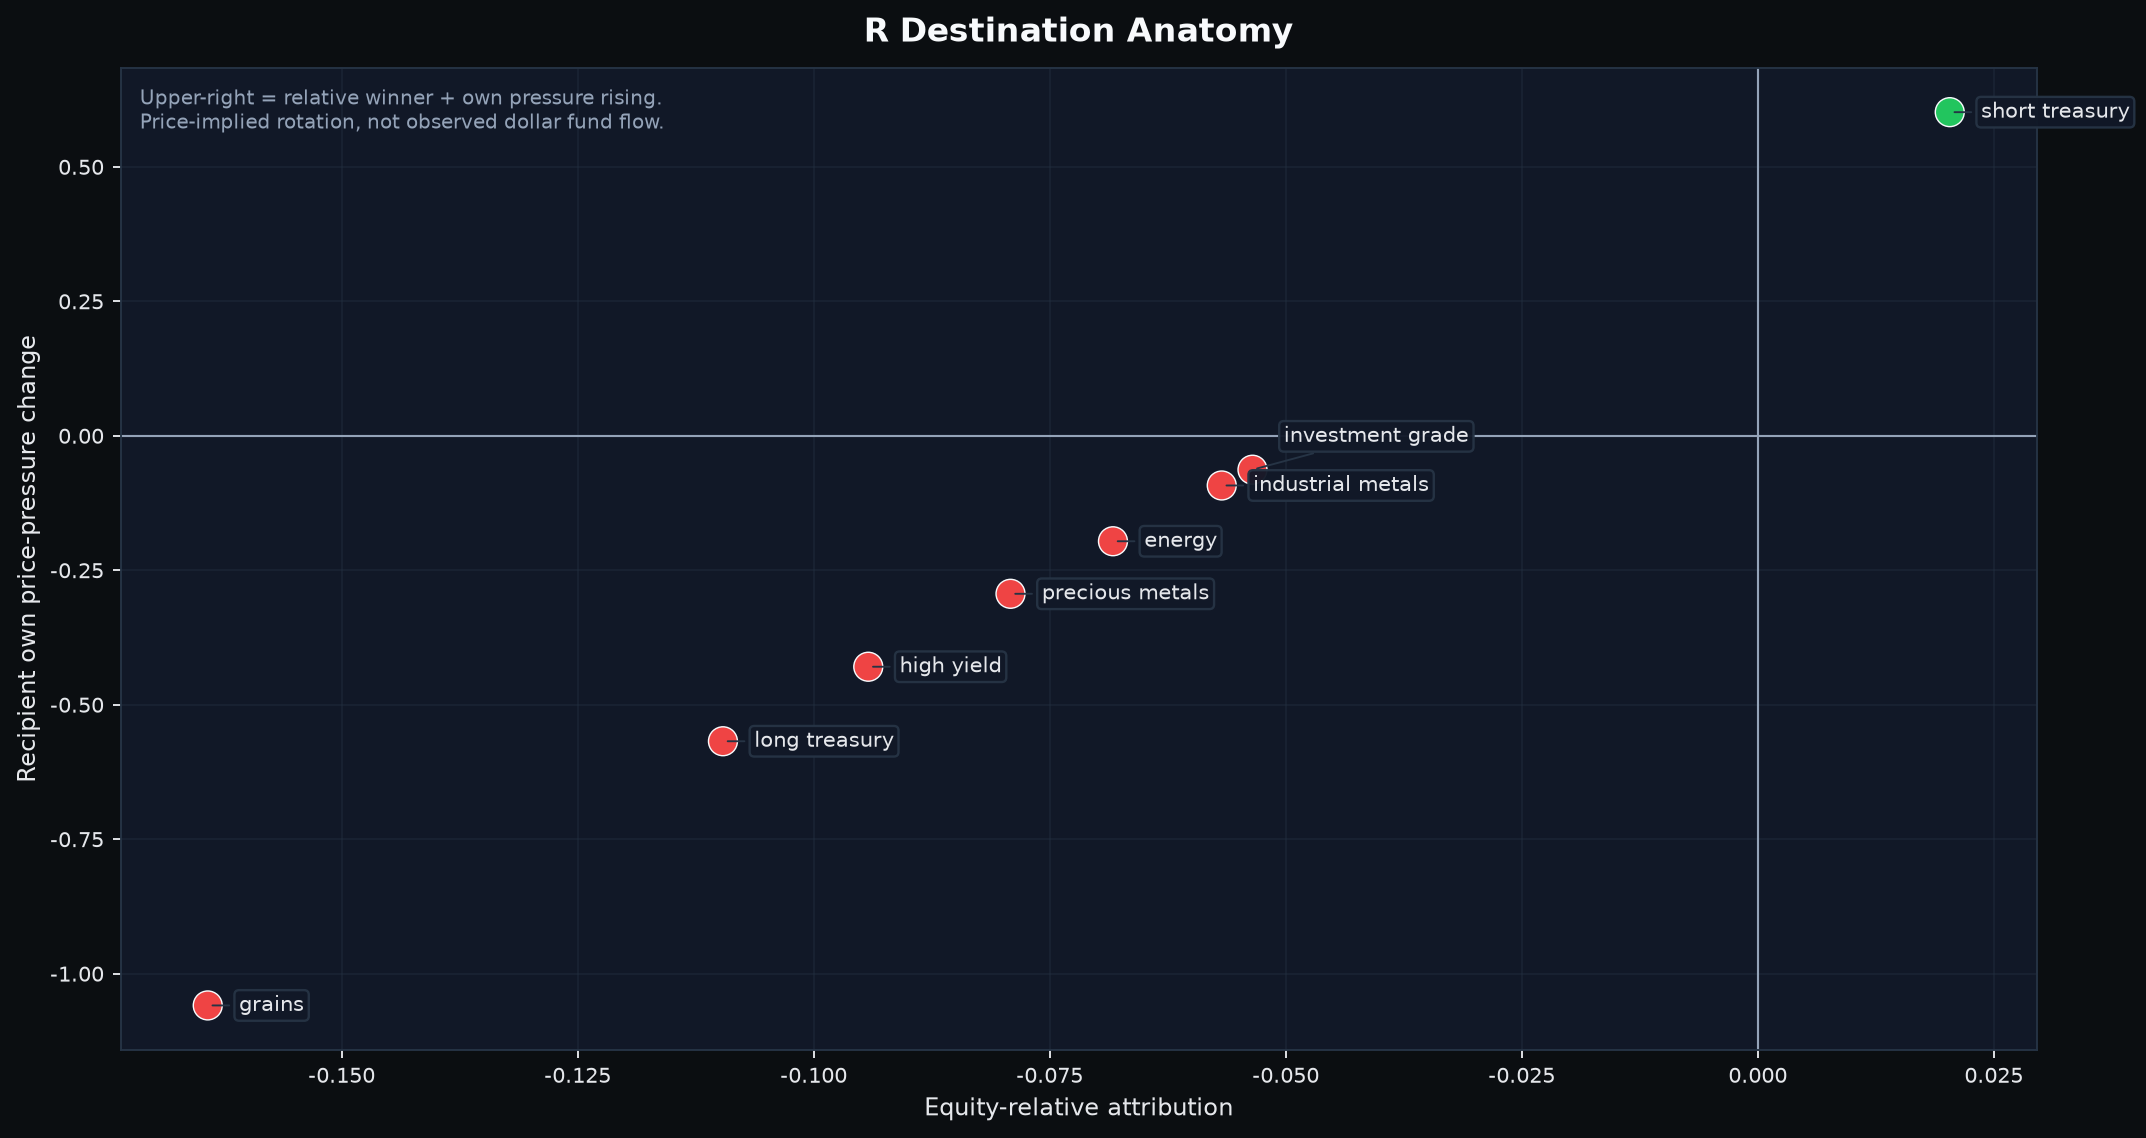
The most useful macro distinction is state versus shock. The cross-asset F state remains tight at +2.43z, but the five-day shock is now -1.02z. The 2-year component has eased by roughly nine basis points over five days while the real 10-year component is almost unchanged. That fits the September 30 data mix: softer-than-expected PCE reduced immediate tightening pressure, but long-term borrowing costs remained high. In other words, the market received some front-end relief without a full easing of the price of capital.
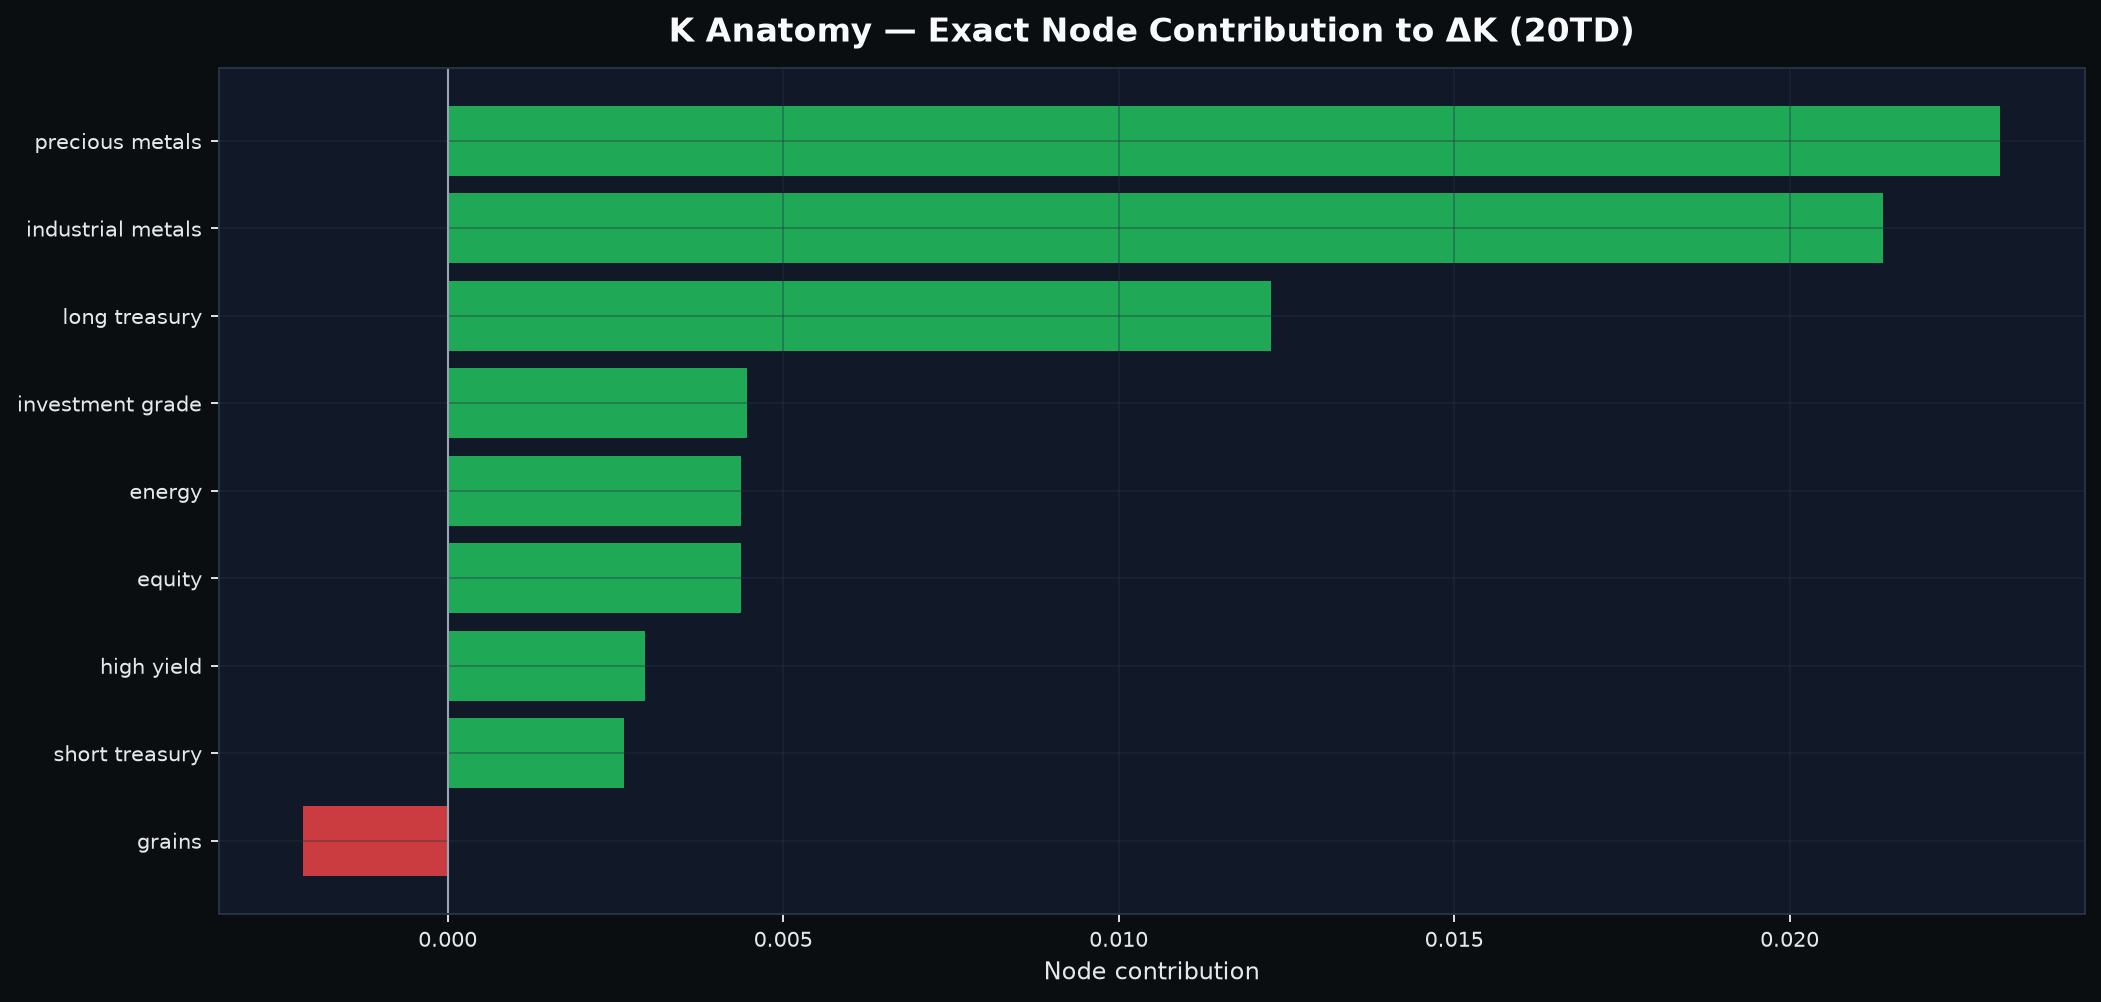
R and K argue against calling this a simple equity risk-off migration. R's strongest 20-day destination is short Treasury, but the framework measures relative price preference rather than actual cash flows. K has strengthened, yet precious metals, industrial metals and long Treasuries explain most of the change; equity contributes only about 6% of the absolute node move. The common mode is broadening, not becoming an equity-specific panic.
The latest CFTC snapshot is dated September 22 and was released on the normal weekly schedule. Equity positioning remains net long and increased over four reports, while short-Treasury positioning became more net short. The model's CFTC-versus-R confirmation score is slightly negative, so positioning is best treated as mixed lagged context rather than confirmation of the live price-based rotation. The next macro test is whether the negative five-day F shock persists. If the front end re-tightens while real yields stay high, the relief channel closes quickly.
4. Sector leadership: #1 changed, but three of the Top5 are two-sided
| Bull rank | Sector | Bear-risk rank | Balance state | Representative tickers | Public read |
|---|---|---|---|---|---|
| 1 | Asset Management & Capital Markets | 24 | Bull-dominant | MARA, IREN, WULF, HOOD, COIN, RIOT, CRCL | Strongest Bull signal, but representative price confirmation is poor. |
| 2 | Enterprise Software & IT Services | 2 | Two-sided conflict | APLD, CIFR, MSTR, MDB, TWLO, ZS, CRWV | AI/cloud demand is strong, but downside risk is simultaneously concentrated. |
| 3 | Autos & Mobility | 11 | Bull-dominant | CVNA, F, TSLA, RIVN, GM, ORLY, AZO | Cleaner balance than software; CVNA is the only final publication name. |
| 4 | Industrial Machinery, Automation & Instruments | 4 | Two-sided conflict | BE, COHR, SMR, VRT, GEV, FPS, PH | Data-center power infrastructure has a real demand mechanism, but the signal is conflicted. |
| 5 | Aerospace, Defense & Security | 3 | Two-sided conflict | RKLB, HWM, BA, GE, LMT, RTX, GD | Contract momentum is real, but the sector is not a clean directional read. |
The temporal change is notable but should not be described as observed fund flow. From September 29 to September 30, Asset Management & Capital Markets moved from Bull #2 to #1, Enterprise Software slipped from #1 to #2, Autos improved from #5 to #3, Industrial Machinery held #4, and Aerospace entered the Top5 at #5. Semiconductors dropped out of the Bull Top5. The current sector packet, not the historical cache, is authoritative for today's Bear-risk ranks.
| Sector | Current leading subcluster(s) | Key names | Economic linkage | Quant / price-support confirmation | Why now / public mechanism | Strongest counterevidence |
|---|---|---|---|---|---|---|
| Asset Management & Capital Markets | Crypto platforms, miners and power-linked digital infrastructure | MARA, IREN, WULF, HOOD, COIN, RIOT, CRCL | Crypto trading sensitivity plus miner power assets that can be repurposed for AI infrastructure | Bull #1 / Bear #24, but most representatives are below MA5 and recently broke short support | Miner-owned power capacity has become strategically valuable to AI data-center operators, creating an infrastructure optionality channel alongside crypto sensitivity | The sector signal is not yet translating into clean representative price support |
| Enterprise Software & IT Services | AI cloud / compute infrastructure plus enterprise software | APLD, CIFR, MSTR, MDB, TWLO, ZS, CRWV; selected ORCL, CRWV | Cloud capacity, AI compute, databases, security and application infrastructure | Bull #2 / Bear #2; ORCL and CRWV have confirmed Step14 support, but the sector is explicitly two-sided | Oracle reported 121% IaaS growth; CoreWeave reported higher-priced new capacity and more than $25B of new customer commitments early in Q3 | High capital intensity and Bear-risk #2 mean demand strength is not equivalent to clean equity price transmission |
| Autos & Mobility | Online used-auto retail and EV / mobility platforms | CVNA, F, TSLA, RIVN, GM | Vehicle retail volumes, delivery logistics, financing sensitivity and EV demand | Bull #3 / Bear #11; CVNA passed strict support confirmation but remains well below MA20 | Carvana continues to expand same-day delivery and reconditioning capacity, reinforcing operating-network scale | CVNA is 7.8% below MA20 and higher borrowing costs remain a sector-level headwind |
| Industrial Machinery, Automation & Instruments | Data-center power, cooling, grid equipment and nuclear-adjacent infrastructure | BE, VRT, GEV, SMR, COHR | AI infrastructure requires power generation, distribution, cooling and high-performance connectivity | Bull #4 / Bear #4; BE appears on both sides and no final publication stock comes from the sector | Vertiv is expanding microgrid capability as AI data centers face grid constraints; large AI server orders continue to validate infrastructure demand | Two-sided ranking and project-capital/regulatory friction reduce the cleanliness of the signal |
| Aerospace, Defense & Security | Launch services and defense replenishment | RKLB, RTX, LMT, BA, HWM | Commercial launch backlog plus missile / defense procurement | Bull #5 / Bear #3; RKLB itself appears in both Bull and Bear Top30 | RTX received a large provisional AMRAAM contract, providing pre-close evidence of contract-specific defense demand | The leadership is narrow and conflict-heavy rather than broad sector confirmation |
There is no single clean macro explanation for all five leaders. A more defensible reading is a common capital-intensive infrastructure backdrop with separate overlays: AI/cloud demand supports software and power infrastructure; crypto and miner-power optionality lifts the capital-markets group; Carvana contributes an idiosyncratic operating-network story; and aerospace benefits from contract-specific demand. The sector layer therefore reinforces selectivity rather than broad cyclicality.
5. Stocks: three support confirmations, three different trend states
| Priority | Stock | Sector | Bull / Bear rank | Recent support confirmation | Live S1 zone | Distance from S1 | MA20 | Slower context |
|---|---|---|---|---|---|---|---|---|
| 1 | ORCL | Enterprise Software & IT Services | #27 / #80 of 293 | Sep. 30, same-day bullish center reclaim | $133.81-$138.35 | +0.91%; 0.18 ATR | -6.57% | Financial rank 0.36; delayed 13F rank 0.13; both price divergences positive |
| 2 | CVNA | Autos & Mobility | #6 / #94 of 293 | Sep. 29, same-day bullish center reclaim | $60.35-$61.98 | +2.48%; 0.47 ATR | -7.77% | Financial rank 0.22; delayed 13F rank 0.05; price is ahead of both slow layers |
| 3 | CRWV | Enterprise Software & IT Services | #26 / #83 of 293 | Sep. 29, bearish-wick touch with next-day center reclaim | $81.83-$85.87 | +3.88%; 0.61 ATR | +0.65% | Official-filing fallback: revenue +112.5% YoY, CFO margin +91.1%, FCF margin -179.9%; ownership snapshot is not a 13F flow rank |
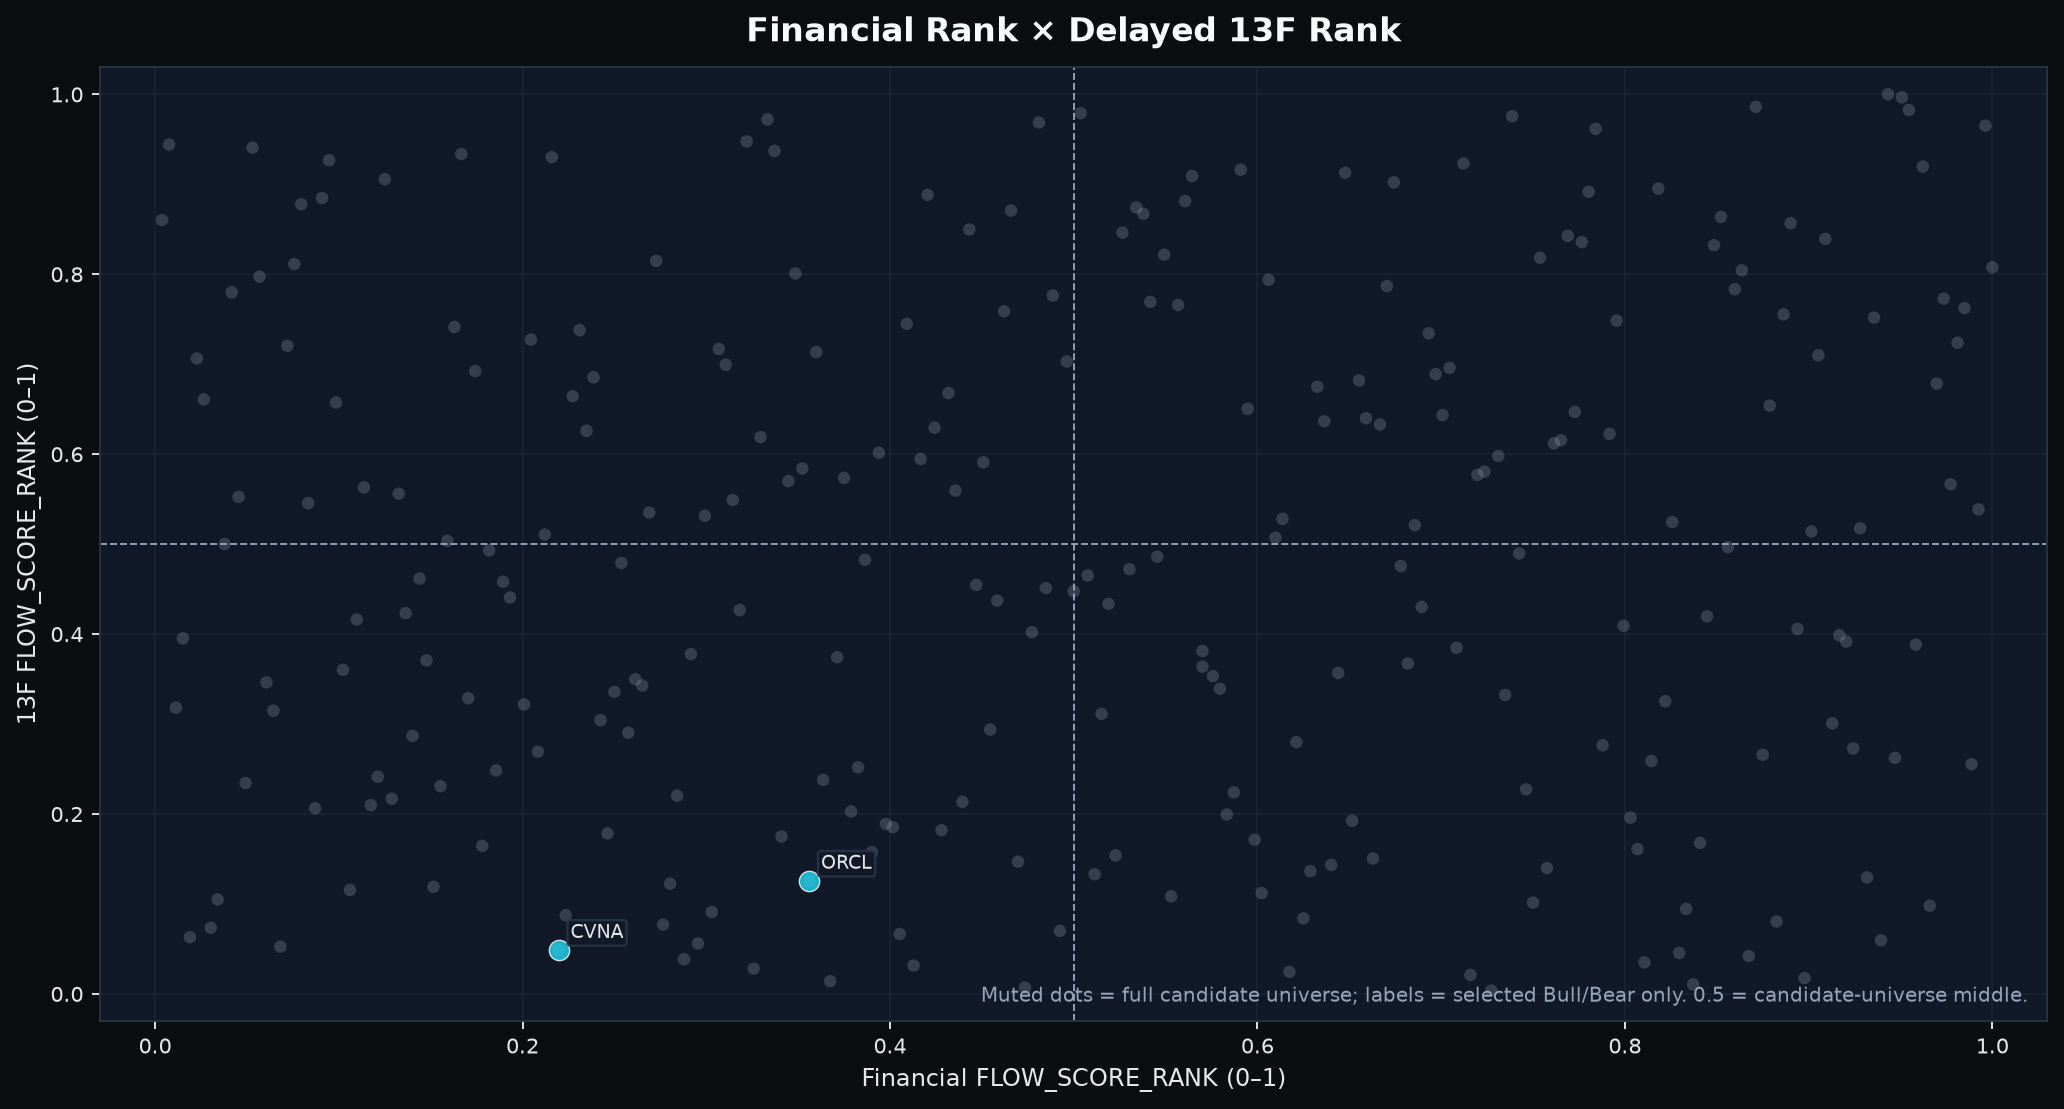
The upstream support gate fixes both membership and publication order. The ranking is not a judgment that ORCL has the strongest raw Bull model score; it is the result of live-S1 proximity, confirmation freshness and the frozen tie-break rules. Public news and slower Financial/holdings context do not rerank the list.
ORCL: closest support, but trend repair is still incomplete
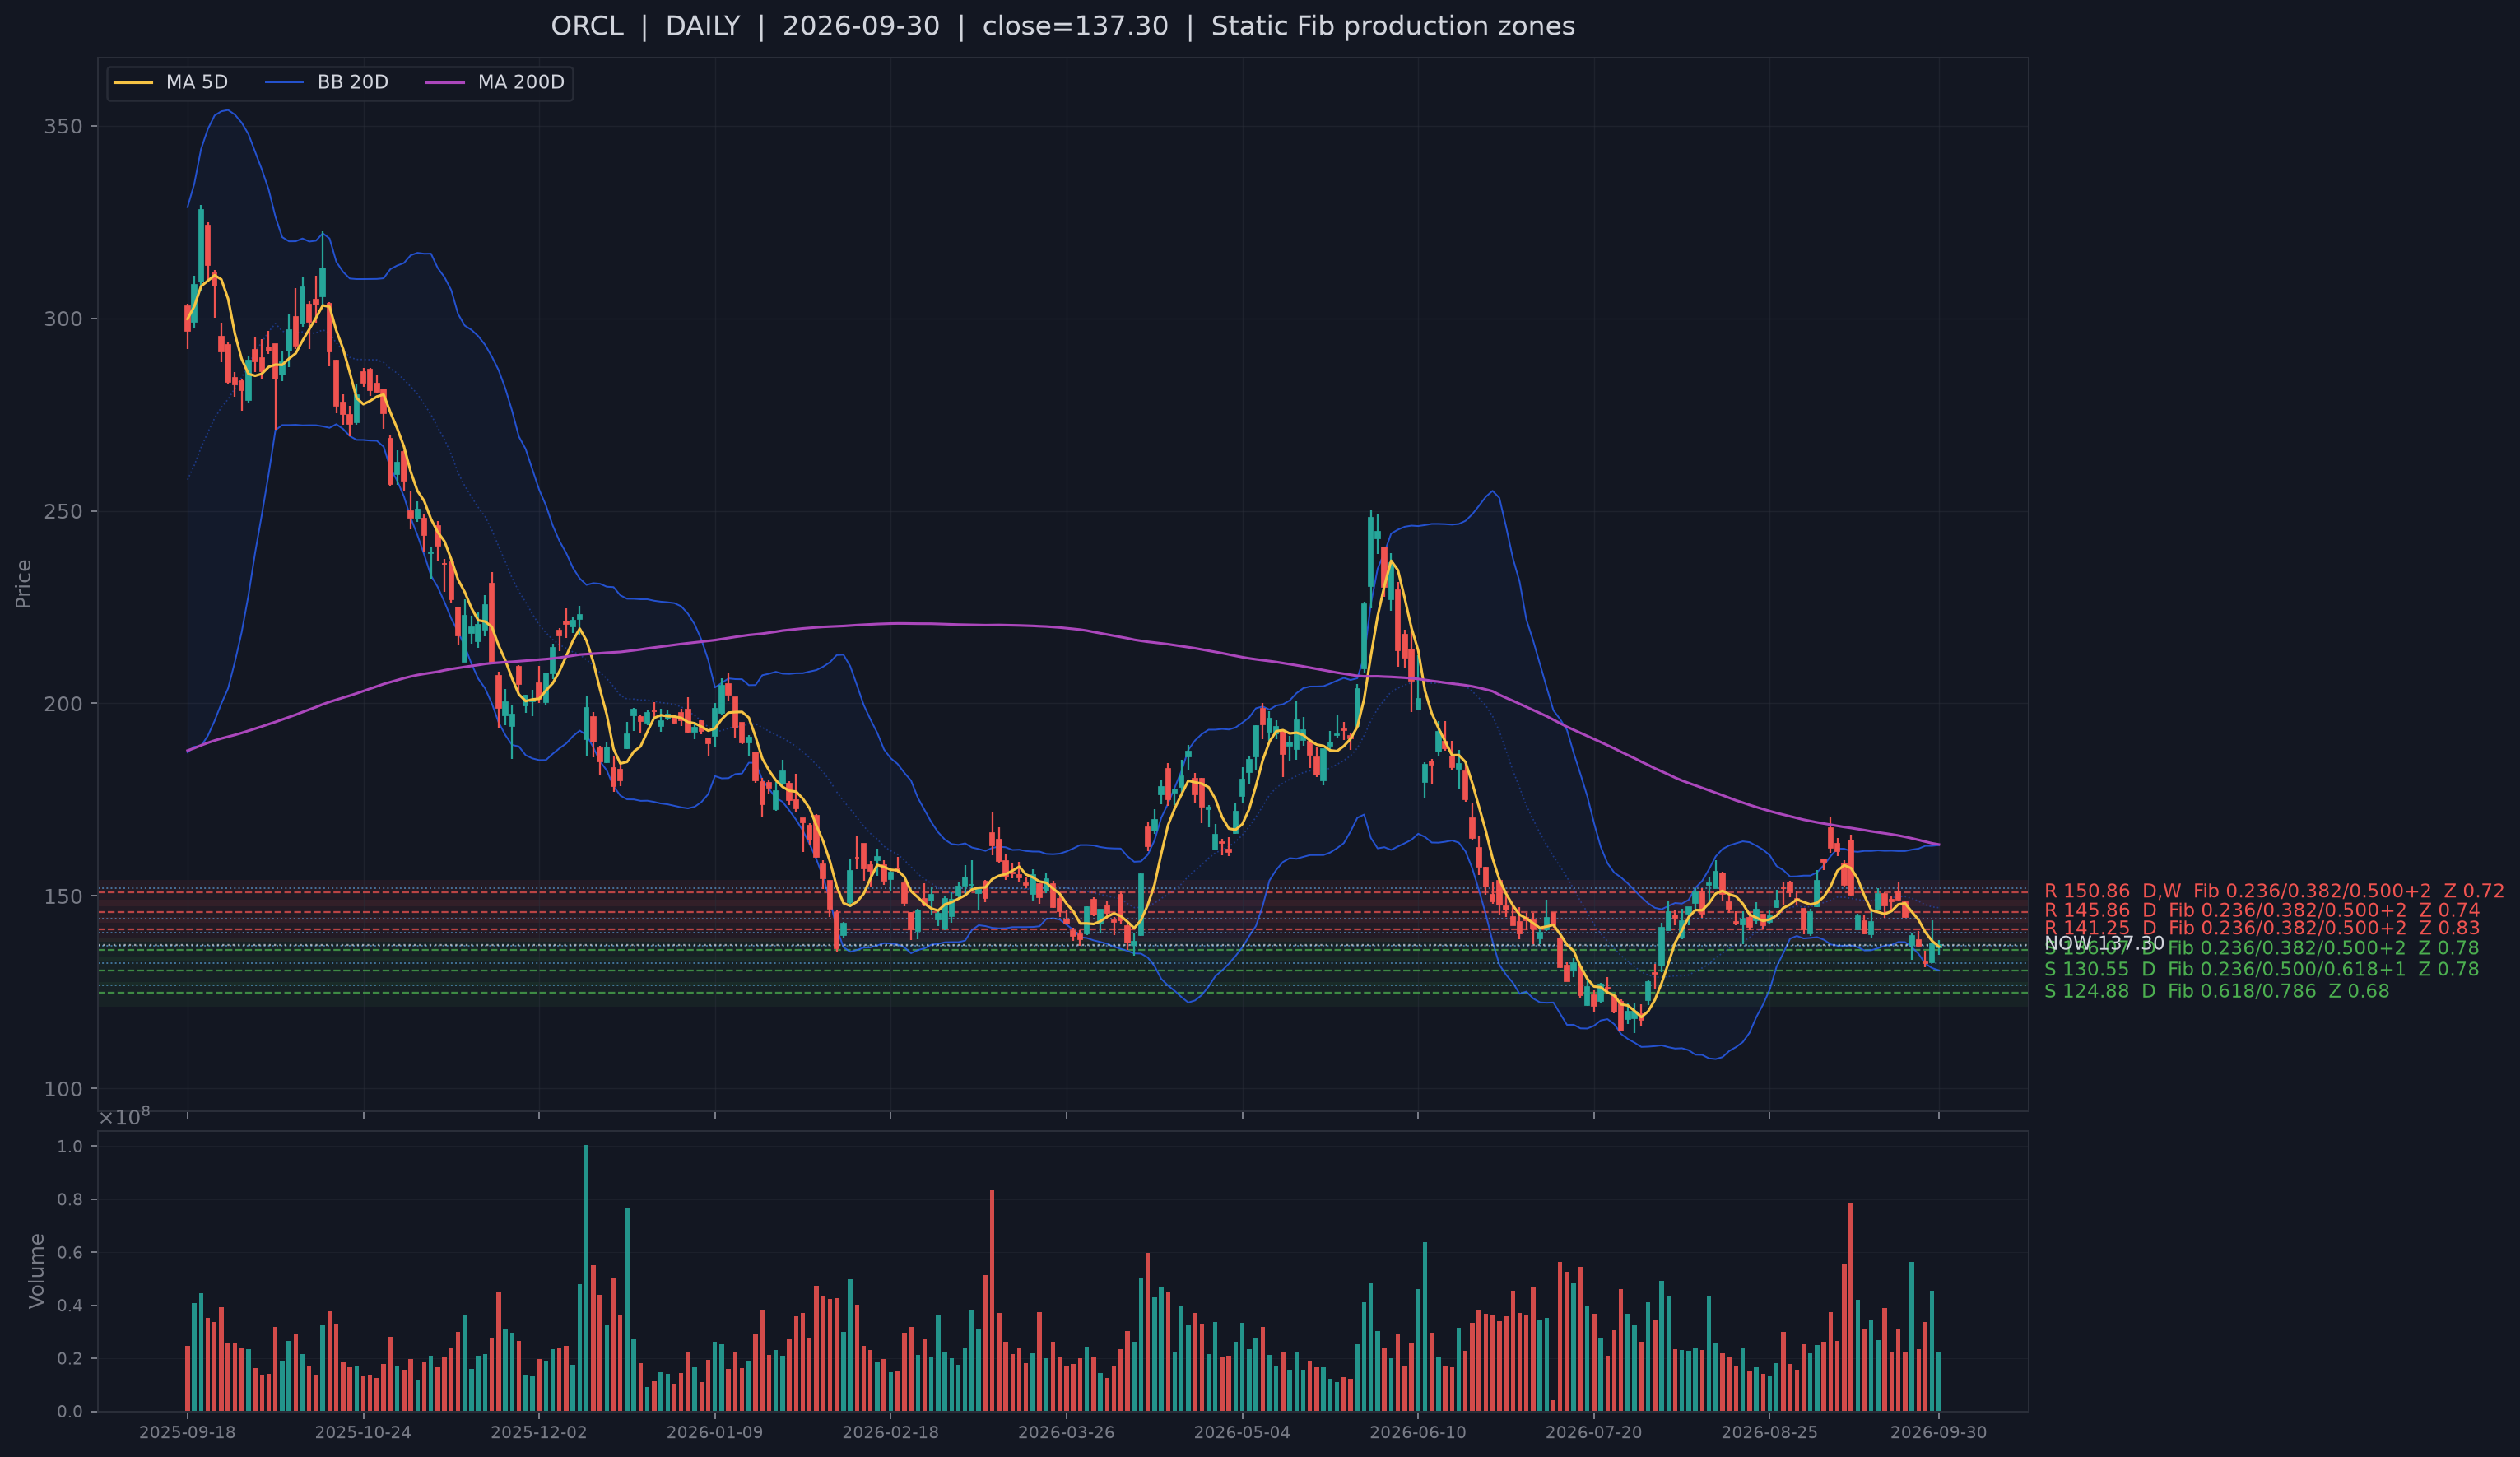
ORCL is only 0.18 ATR above its live S1 center after a same-day bullish reclaim on September 30. That makes it the freshest and closest support setup, but not the cleanest trend setup: the close is still 6.6% below MA20 and the 20-day average itself is drifting lower. Oracle's business mechanism is strong enough to explain why support can attract attention - fiscal Q1 cloud infrastructure revenue rose 121% year over year to $7.4 billion, total cloud revenue rose 62%, and RPO reached $664 billion. The counterevidence is price transmission. A strong AI/cloud backlog does not erase the fact that the stock is still below its medium-term trend. The next proof is not another support touch; it is sustained distance above S1 followed by MA20 repair.
CVNA: strongest Bull rank, weakest medium-term trend
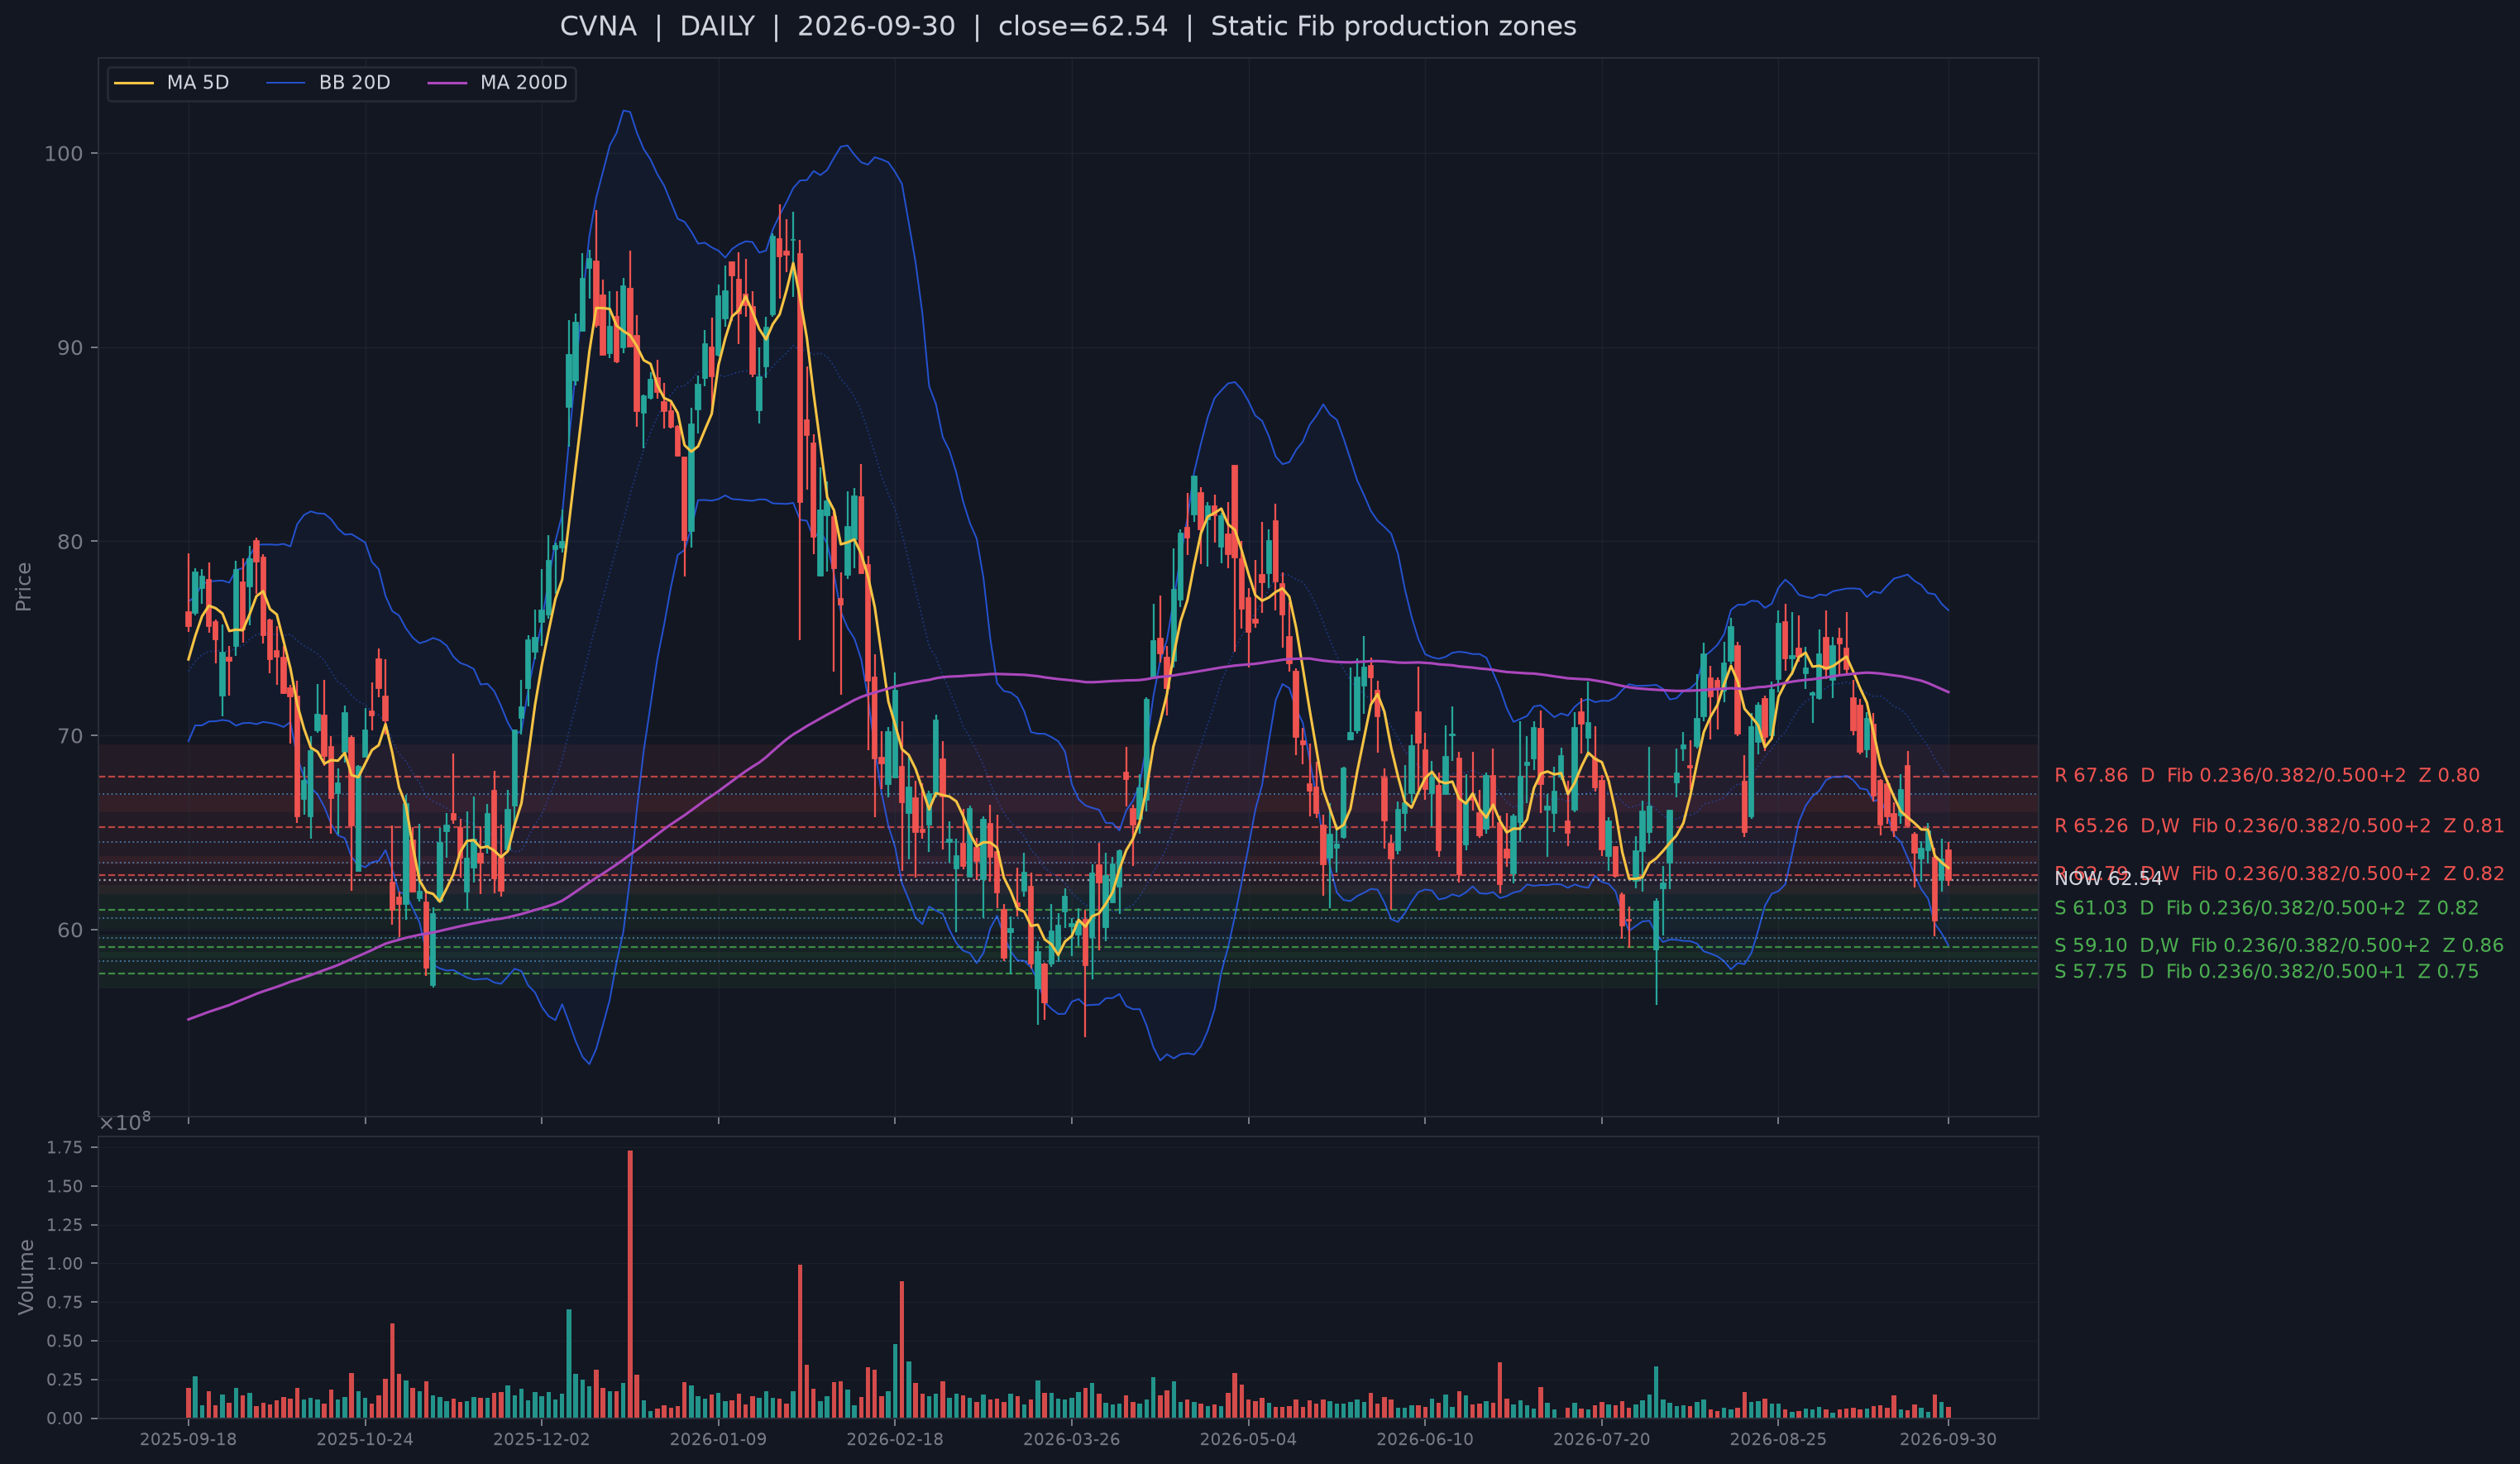
CVNA has the best Bull rank of the three at #6 of 293 and remains only 0.47 ATR above live S1 after a September 29 same-day confirmation. It is also the clearest example of support confirmation not being trend confirmation: the stock is 7.8% below MA20, with both the five- and 20-day averages falling. Carvana's September operating updates - same-day delivery expansion in the Twin Cities and additional reconditioning capacity in Charlotte - support the scale-and-throughput mechanism. But those facts do not neutralize the high-rate backdrop or the damaged trend. The constructive test is a support hold followed by a higher low and MA20 recovery; a close back through live S1 would invalidate the local setup much earlier.
CRWV: the only MA20-positive setup, with the highest capital-intensity burden
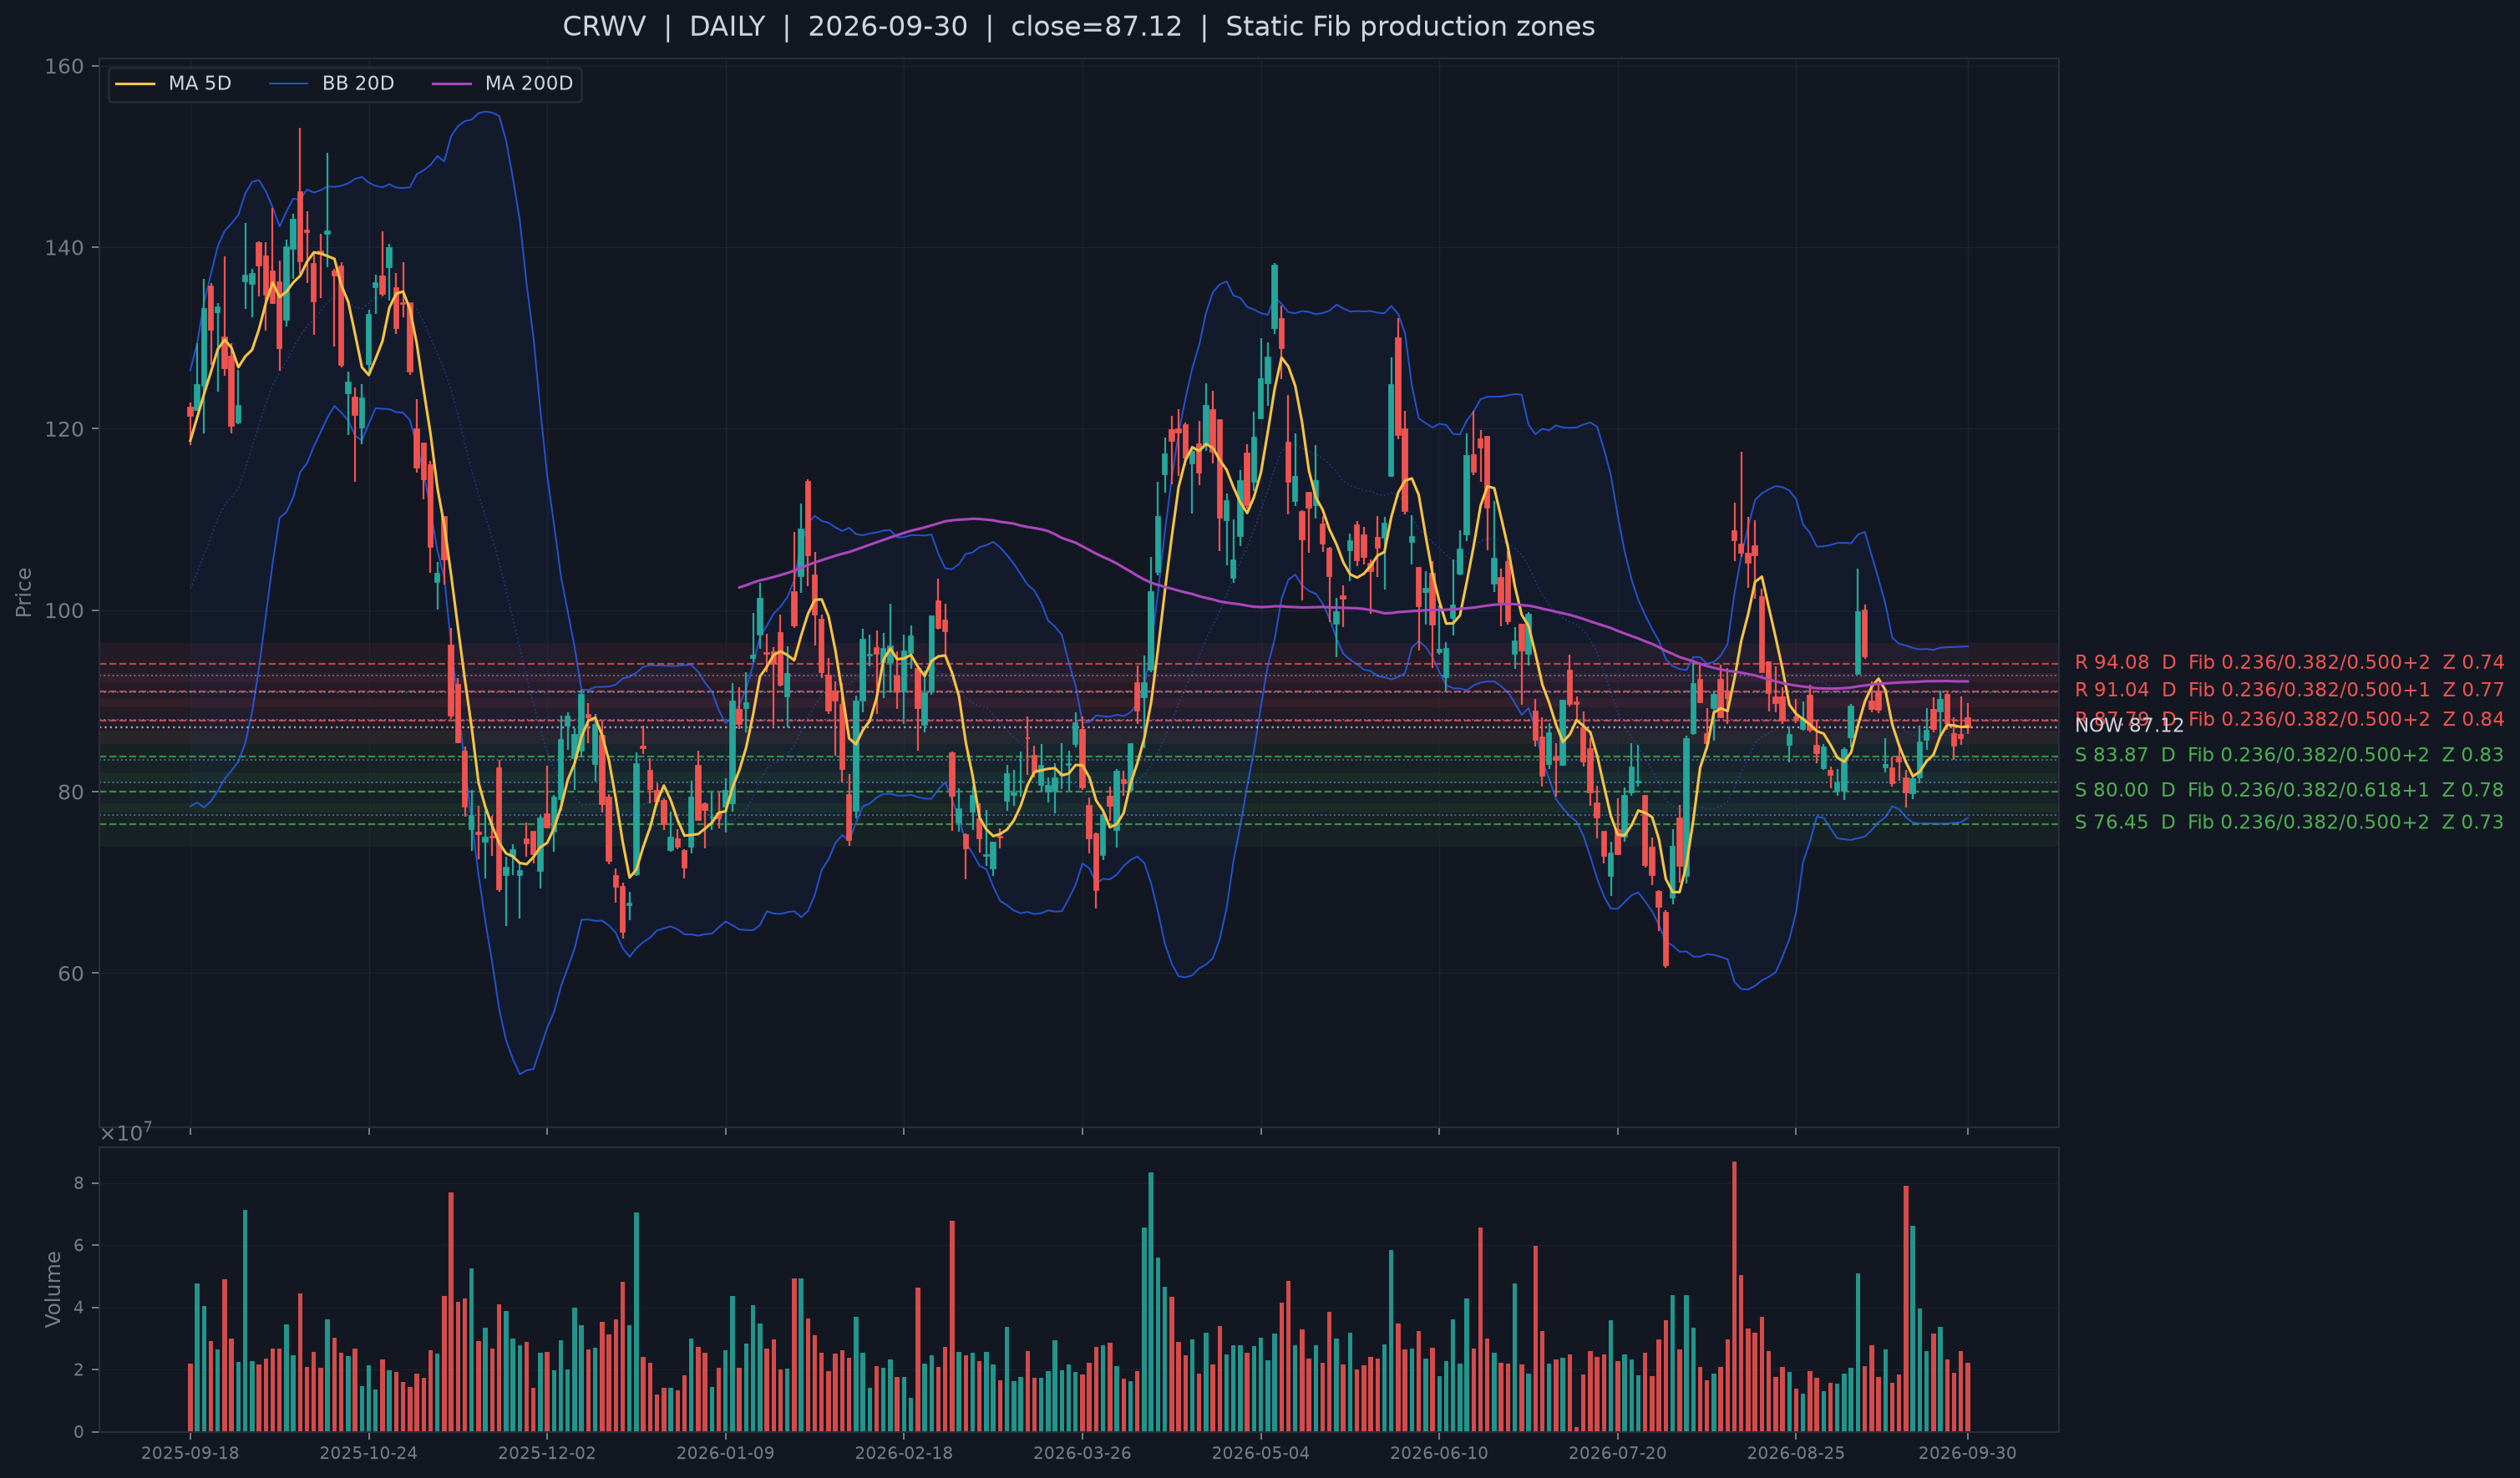
CRWV is farther from live S1 than ORCL or CVNA, but it is the only selected name above MA20 (+0.65%). Its support path was also different: a bearish-wick touch required a next-day center reclaim before confirmation. The operating demand case is unusually strong. CoreWeave said it had added more than $25 billion of net new customer commitments early in Q3 and was contracting new compute capacity at higher prices. The slower financial layer, however, shows why the equity can remain volatile: revenue growth is extremely high and CFO margin is strong, but the filing-based FCF margin remains deeply negative. That makes CRWV the cleanest trend-confirmed stock in this list, not a low-risk one.
The three names therefore form a useful contrast. ORCL has the closest/freshest support but needs trend repair; CVNA has the strongest Bull rank but the weakest MA20 geometry; CRWV has the best MA20 state but carries the heaviest capital-intensity counterweight. That is the kind of disagreement the current market favors: no single layer is strong enough to substitute for the others.
6. Base case and falsification
Base case (3-10TD): selective support can still work, but the broad market has moved from "needs confirmation" to "owes a repair." Confidence is moderate-low. Breadth is weak, the S&P is below MA20, new-low damage is elevated and the strongest opening order-flow state failed quickly. What prevents a more defensive base case is the absence of broad large-decline/dispersion damage, the Nasdaq's remaining MA20 cushion, the easing five-day F shock and the presence of fresh support confirmations in a small number of stocks.
What would strengthen it: the S&P reclaims MA20, breadth stops making new lows, 20D/252D new-low pressure turns lower, and order-flow axes reclaim 50 early and hold through midday and the close. Sector leadership also needs cleaner price transmission - especially in the new #1 capital-markets group - rather than model leadership with broken short support. At the stock level, ORCL and CVNA need trend repair while CRWV needs to hold both its S1 zone and MA20.
What would invalidate it: Nasdaq loses MA20; down-3% breadth and cross-sectional volatility rise alongside new-low damage; another session opens above neutral but closes with all three order-flow axes below 50; or the selected names lose their live S1 zones before broader breadth improves. Macro risk rises materially if the five-day F shock turns positive again while long real-rate pressure remains high.
Sources
- Reuters, Sep. 30, 2026 - U.S. market close, PCE reaction, Treasury-yield context and sector-level tape.
- U.S. BEA, Sep. 30 - August personal income, spending and PCE inflation.
- CFTC - 2026 Commitments of Traders release schedule and weekly lag convention.
- Reuters Breakingviews, Sep. 23 - miner power capacity as an AI-infrastructure scarcity asset.
- Oracle, Sep. 10 - fiscal Q1 FY27 cloud infrastructure growth and RPO.
- CoreWeave, Sep. 17 - new compute-capacity pricing and customer commitments.
- Carvana, Sep. 16 - same-day delivery expansion in the Twin Cities.
- Reuters, Sep. 2 - Vertiv microgrid acquisition and AI data-center power constraints.
- Reuters, Sep. 28 - provisional AMRAAM contract awarded to RTX's Raytheon.