Breadth Weakens and Late Order Flow Deteriorates as Software Leadership Returns
Indexes still hold their 20-day trend, but breadth is weak and late order flow deteriorated below neutral as software leadership returned and stock-level support remained selective.
Horizon: 3-10 trading days.
This research is designed for 3-10 trading-day swing setups. The signals and conclusions may not transfer to intraday trading or longer-horizon investing.
Breadth Weakens and Late Order Flow Deteriorates as Software Leadership Returns
The market is still holding its medium-term index trend, but the internal structure weakened again. The S&P 500 finished only +0.01% above MA20 and -0.40% below MA5; the Nasdaq Composite remained +1.02% above MA20 but -0.43% below MA5. Breadth fell to 0.348, while the 20-day new-low damage gauge rose to +1.28z. This is a narrow, fragile market rather than a clean trend failure.
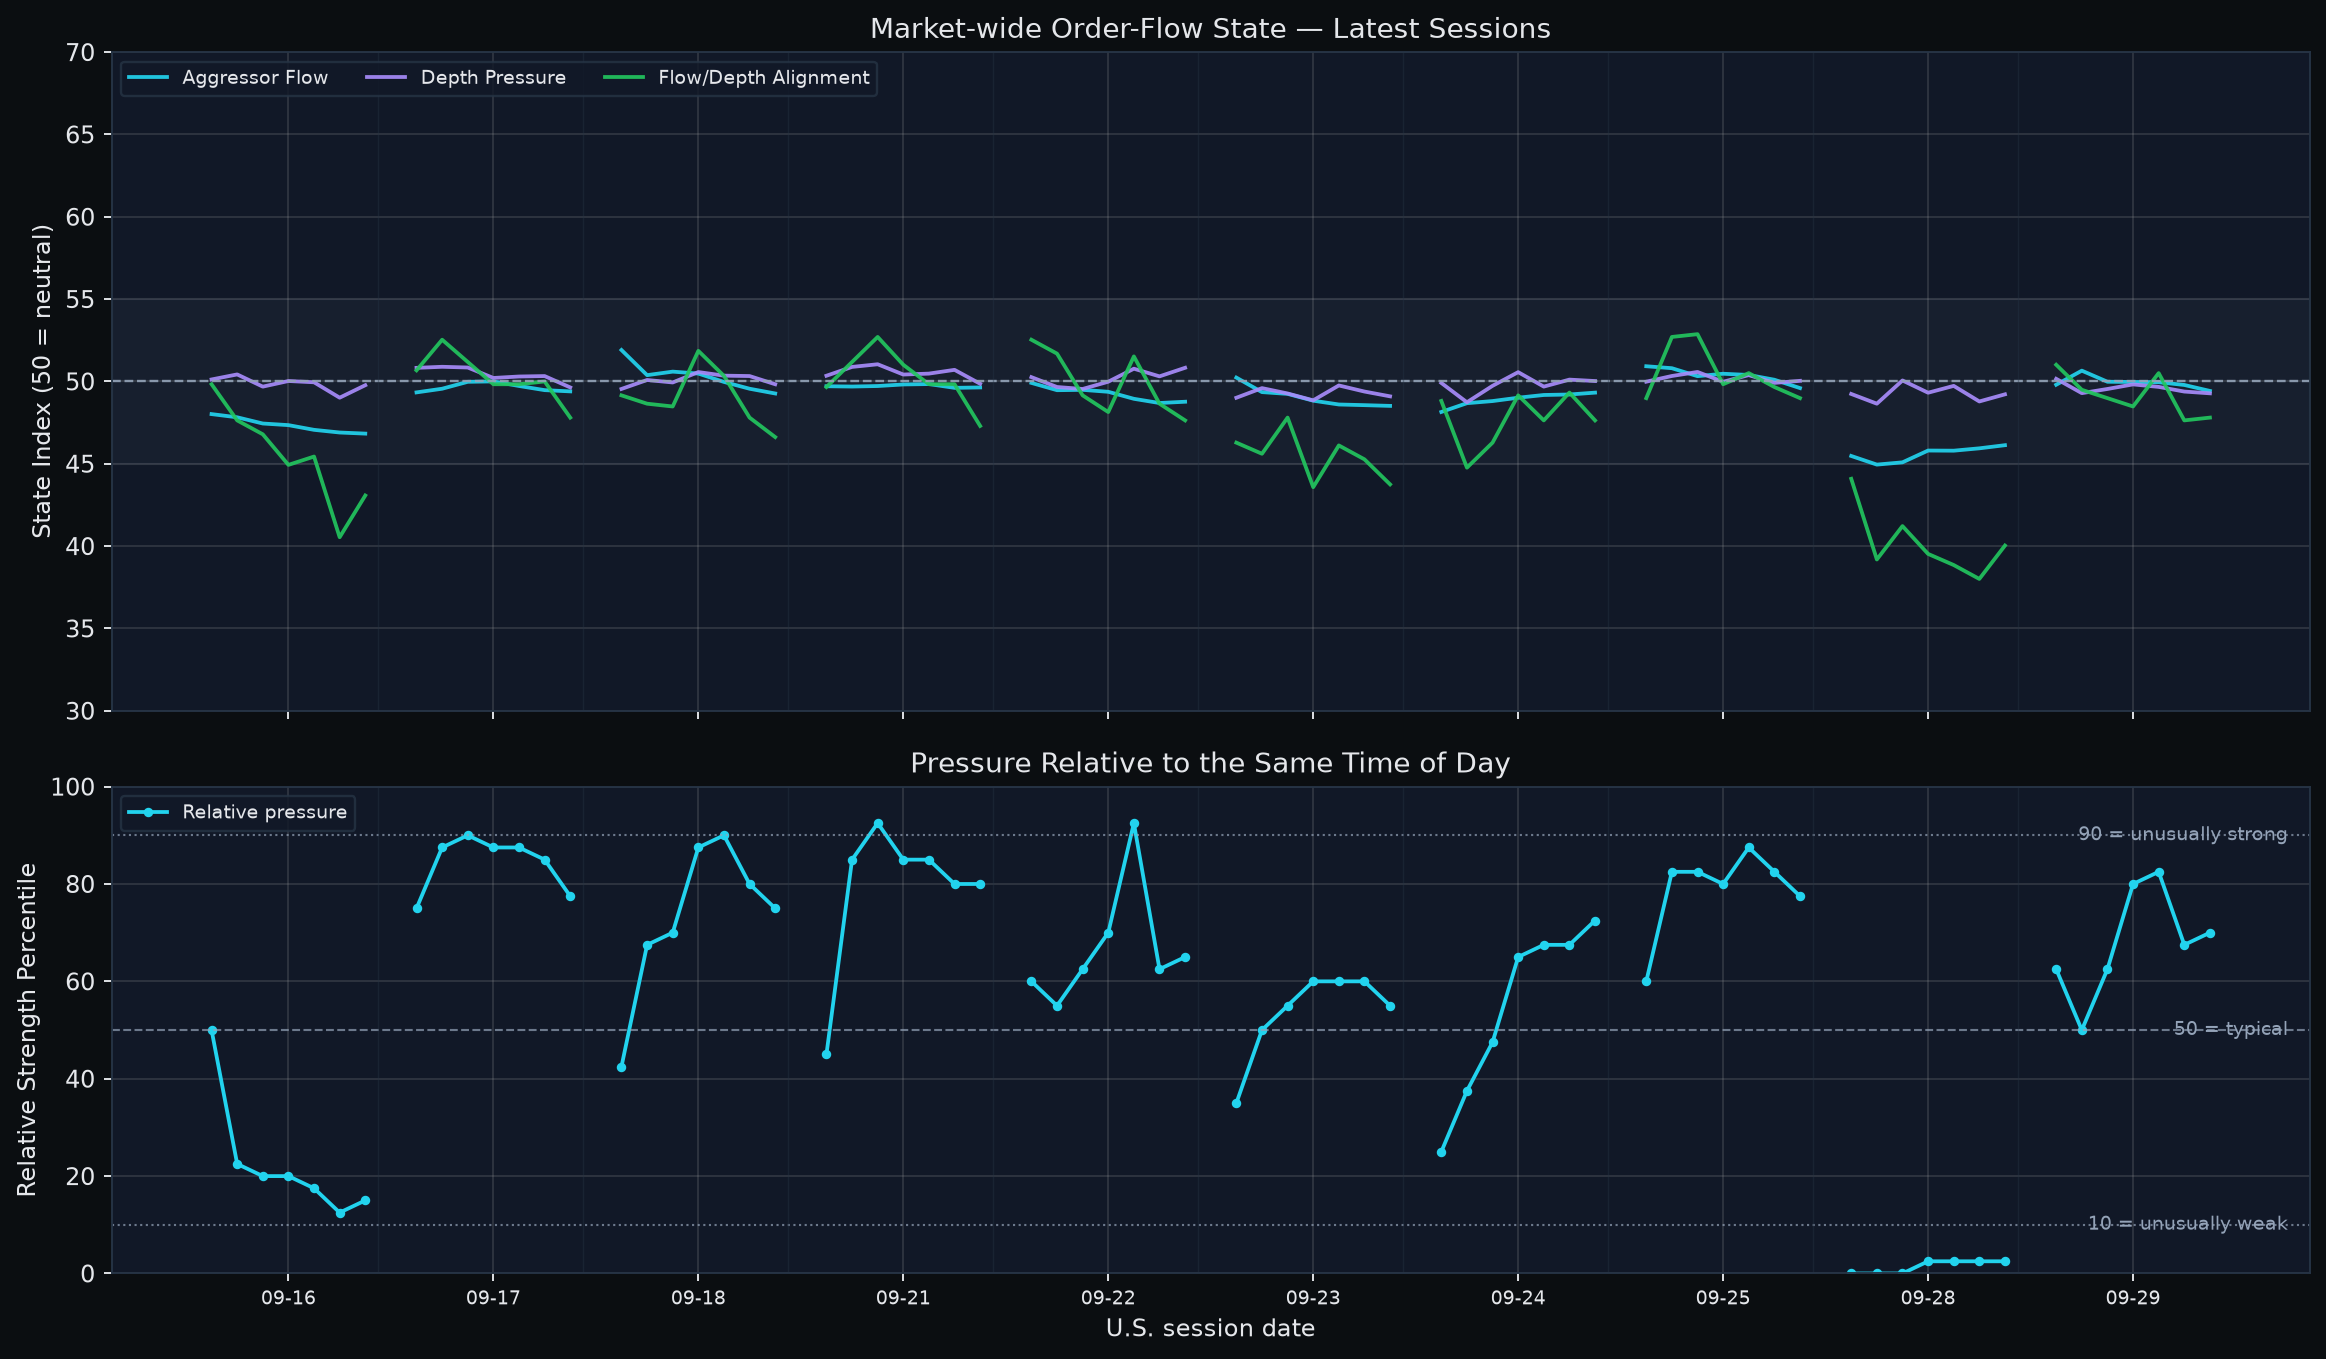
The strongest reason not to call it broad liquidation is that the other damage channels are still quiet. The 252-day new-low gauge is only +0.89z, down-3% breadth is -1.07z and cross-sectional volatility is -1.29z. The more important deterioration came from market-wide order flow: after a brief morning Aggressor reclaim and a 13:30 Alignment reclaim, all three state axes weakened into the close. Aggressor, Depth and Alignment ended at 49.42, 49.28 and 47.80, respectively. Yet the close was at the 70th same-time percentile, so the absolute state was weak without being historically extreme for that intraday slot.
My 3-10TD base case is therefore selective leadership inside a market that still carries a high repair burden. Software returned to the #1 Bull sector, semiconductors remained strong but two-sided, and four support-confirmed stocks survived the screen. Macro is also mixed rather than one-directional: price-of-money pressure is high and the fresh rate shock remains positive, but liquidity is supportive; equity relative preference has improved; and the broad cross-asset common mode is not predominantly equity-led. The next session needs persistent order-flow reclaims and breadth stabilization before the current support setups can be treated as broad confirmation rather than isolated resilience.
How to read today's indicators
| Indicator | Reader scale | Interpretation |
|---|---|---|
| Market-wide order-flow state | Three component indices; 50 = neutral | Aggressor Flow, Depth Pressure and Flow/Depth Alignment answer different questions. Read confirmation or divergence across the three; they are not probabilities. |
| Same-time order-flow percentile | 0-100; 50 = same-time historical median | 90 is unusually strong and 10 unusually weak for that intraday slot. This is historical context, not event probability. |
| Flow × depth state breadth | Cross-sectional percentages | Bull/Bear aligned show joint direction; absorption-compatible states describe divergence only, not proven actor intent. |
| Market breadth | 0-1; practical balance ~0.50 | Above 0.50 means broader participation. Direction and slope show whether participation is improving or fading. |
| z-score | 0 = historical mean | |z| ~1 is notable and |z| ~2 is unusual. It is standardized distance, not probability. |
| Historical percentile | 0-100; 50 = median | 90+ is historically elevated. A percentile is not an event probability. |
| FLOW_SCORE_RANK | 0-1; 0.50 = median | 0.80+ is relatively strong slow context. It is confirmation/context, not a standalone entry signal. |
| Financial / 13F price divergence | Approx. -1 to +1; 0 = little gap | Positive means slow context is ahead of price; negative means price is ahead. ±0.20 / ±0.50 are reader bands only, not learned thresholds. |
| Expected next-session range | Non-directional high-low amplitude | Always pair the raw estimate with its same-day cross-sectional percentile. It is not an upside target. |
1. Price, breadth and damage: MA20 holds while participation stays weak
| Layer | Current reading | Interpretation |
|---|---|---|
| S&P 500 | -0.40% vs MA5; +0.01% vs MA20 | Fast momentum is negative and the medium-term cushion is almost gone. |
| Nasdaq Composite | -0.43% vs MA5; +1.02% vs MA20 | Still has a healthier MA20 cushion, but short-term momentum has weakened. |
| Breadth | 0.348; 5TD change -0.172 | Participation is weak; the 20-day breadth slope is roughly neutral (+0.11z), so the level is worse than the slope. |
| New-low damage | 20D +1.28z; 252D +0.89z | Shorter-horizon weak-tail damage is mildly elevated, while the long-horizon gauge is not yet above +1z. |
| Propagation checks | Down-3% breadth -1.07z; cross-sectional vol -1.29z | Large-decline breadth and dispersion do not confirm synchronized liquidation. |
| Warning memory | Structural/systemic warning states remain elevated | Historical warning configurations remain active, but their percentiles are not crash probabilities. |
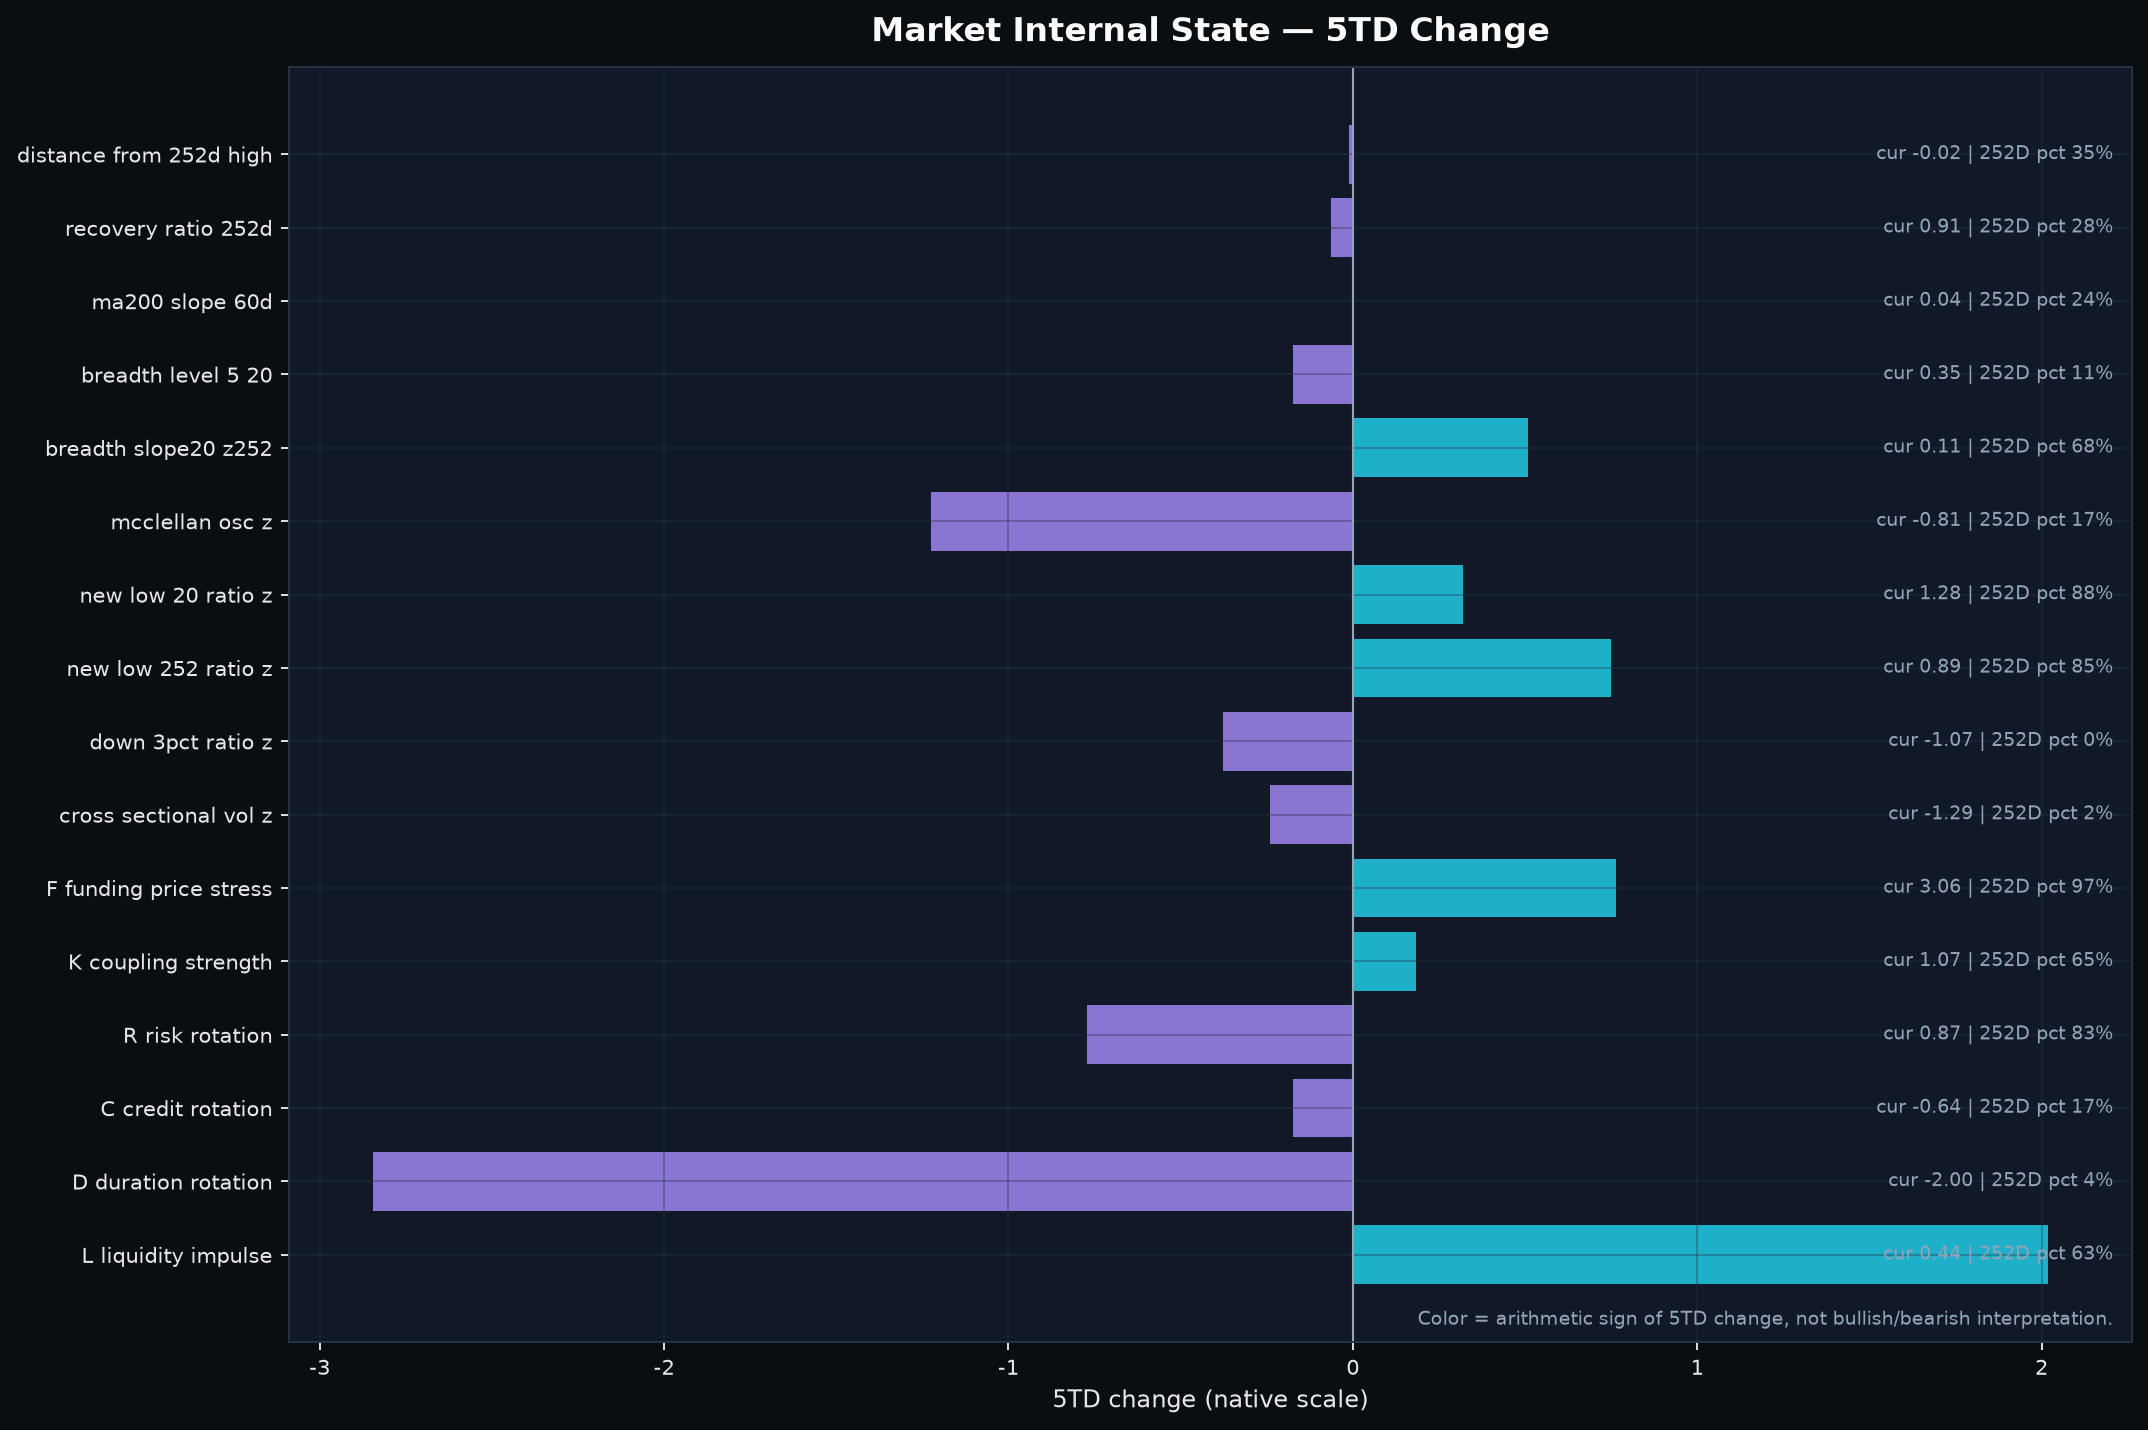
Scale note: the F value in this overview uses the market-internal 252-day standardized feature. The cross-asset F-state z below comes from a separate standardization and should not be compared numerically one-for-one.
The current dispute is whether weak participation is merely a selective pullback or the start of broader propagation. The evidence favors the former for now. Breadth is well below the practical 0.50 balance point and has lost 0.17 over five trading days, but the market is not seeing the combination of large-decline breadth and cross-sectional volatility that would normally make the damage more synchronized.
The falsifier is straightforward. If the indexes lose MA20 while 20-day and 252-day new-low damage continue to rise and down-3% breadth/dispersion join them, the selective-leadership interpretation fails. If MA20 holds and new-low damage compresses while breadth stabilizes, the market can remain narrow without becoming a full propagation regime.
2. Order flow: the late window deteriorated and all three axes closed below neutral
| Time | Aggressor Flow | Depth Pressure | Alignment | Same-time pct. | Bull aligned | Bear aligned | Buy absorption | Sell absorption | EW bar response |
|---|---|---|---|---|---|---|---|---|---|
| 09:30 | 49.80 | 50.16 | 51.01 | 62.5 | 18.2% | 16.2% | 17.6% | 15.9% | +0.13% |
| 10:30 | 50.66 | 49.29 | 49.49 | 50.0 | 15.2% | 16.2% | 12.2% | 17.2% | -0.61% |
| 11:30 | 49.98 | 49.54 | 48.99 | 62.5 | 15.2% | 17.2% | 17.2% | 13.9% | +0.16% |
| 12:30 | 49.97 | 49.82 | 48.48 | 80.0 | 15.2% | 18.2% | 16.6% | 12.8% | -0.13% |
| 13:30 | 49.95 | 49.67 | 50.51 | 82.5 | 16.9% | 15.9% | 16.6% | 15.2% | +0.14% |
| 14:30 | 49.79 | 49.39 | 47.64 | 67.5 | 13.5% | 18.2% | 13.2% | 16.2% | +0.11% |
| 15:30 | 49.42 | 49.28 | 47.80 | 70.0 | 15.2% | 19.6% | 13.2% | 14.5% | +0.04% |
The session contained brief repair attempts but no durable state repair. Aggressor Flow reached 50.66 at 10:30, Depth started just above neutral, and Alignment briefly recovered to 50.51 at 13:30. None of those reclaims persisted. From 13:30 to the close, Aggressor fell 0.53 points, Depth fell 0.39 and Alignment fell 2.70. The broader late window therefore deteriorated across all three axes.
The final hour was mixed rather than uniformly negative. Aggressor fell another 0.36 points and Depth slipped 0.11, while Alignment improved by only +0.17 from a deeply weak 47.64. Bull-aligned breadth rose +1.69 percentage points, but Bear-aligned breadth also rose +1.35; Buy absorption was unchanged and Sell absorption fell -1.69. That is mixed breadth confirmation, not a clean directional repair. All three axes still closed below 50, leaving reclaim burdens of about 0.58 points for Aggressor, 0.72 for Depth and 2.20 for Alignment.
There is useful counterevidence. The close's same-time percentile was 70, far above the historically weak readings seen in the prior session, so the absolute state was sub-neutral without being unusually poor for 15:30 history. Even so, the equal-weight basket lost about 0.30% from open to close and Bear-aligned breadth finished above Bull-aligned breadth. A constructive next-session reset therefore requires an early, sustained reclaim across the weak axes together with improving breadth and equal-weight price, not merely another intraday touch of 50.
3. Cross-asset: high price-of-money pressure, a still-positive shock, and incomplete positioning confirmation
| Layer | Current reading | Interpretation |
|---|---|---|
| Price of money (F) | Raw +0.515 (~+51.5 bp 20TD tightening); state z +2.62 | 2Y +29 bp and Real10 +22.5 bp. The state is tight; the current 5D shock is +1.23z and Real10-led. |
| Liquidity (L) | State z +0.44; 5D shock +1.28z | Positive liquidity quantity is an important counterforce to the high price of money. |
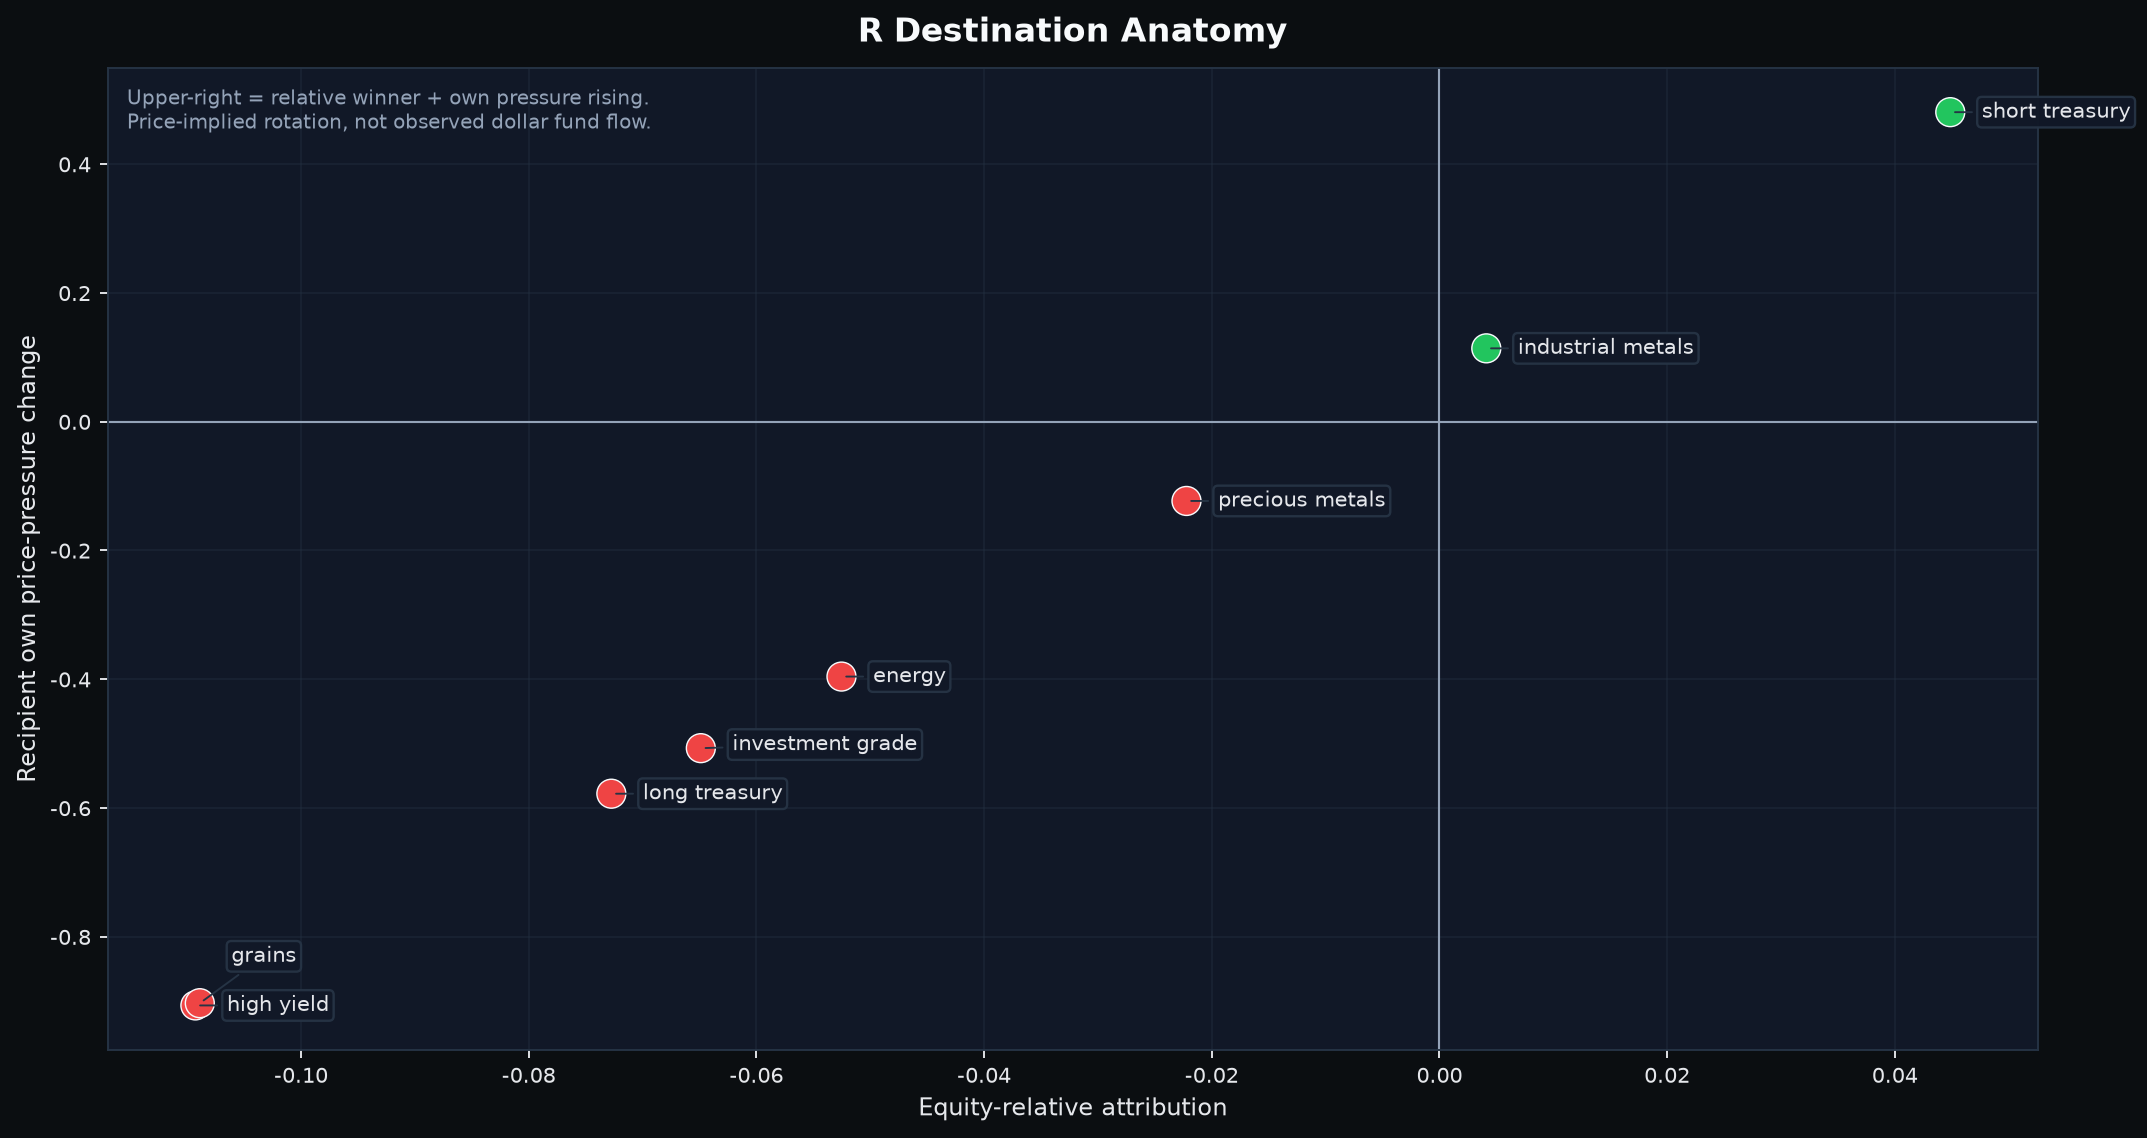
| Relative preference (R) | 20D +0.382 | Equity relative preference improved. Short Treasury is the clearest positive non-equity destination; this is price-implied rotation, not observed dollar flow. |
| Coupling (K) | Raw 0.518; 20D +0.0755; PR 7.12/9 | The common mode is broad and stable, but risk-mode alignment is modest (+0.15) and equity contributes little to the 20D increase. |
| CFTC positioning | Sep. 22 report; Sep. 25 release; 5TD snapshot age | Current under the normal weekly schedule, but materially lagged versus the Sep. 29 market close. |
F remains a real constraint, but it is not a funding-plumbing crisis indicator. Raw F corresponds to about +51.5 bp of blended 20-day tightening, with the 2-year component at +29 bp and approximate 10-year real-rate component at +22.5 bp. The state is historically high at +2.62z. The current 5D shock is still positive at +1.23z and Real10-led, but it is below the latest extreme impulse of +1.94z on September 24. That means discount-rate pressure is active without implying that the shock is accelerating every day.
Liquidity complicates a one-factor bearish story. L is positive and its 5D shock is +1.28z, driven mainly by the Treasury General Account component. The 20-day relative-preference measure also improved by +0.38 in favor of equities. Within the non-equity sleeves, short Treasuries are the clearest active destination, while industrial metals are only a small positive secondary destination. Long Treasuries, investment grade and high yield all show negative attribution, so the anatomy is not a classic long-duration/credit safety migration.
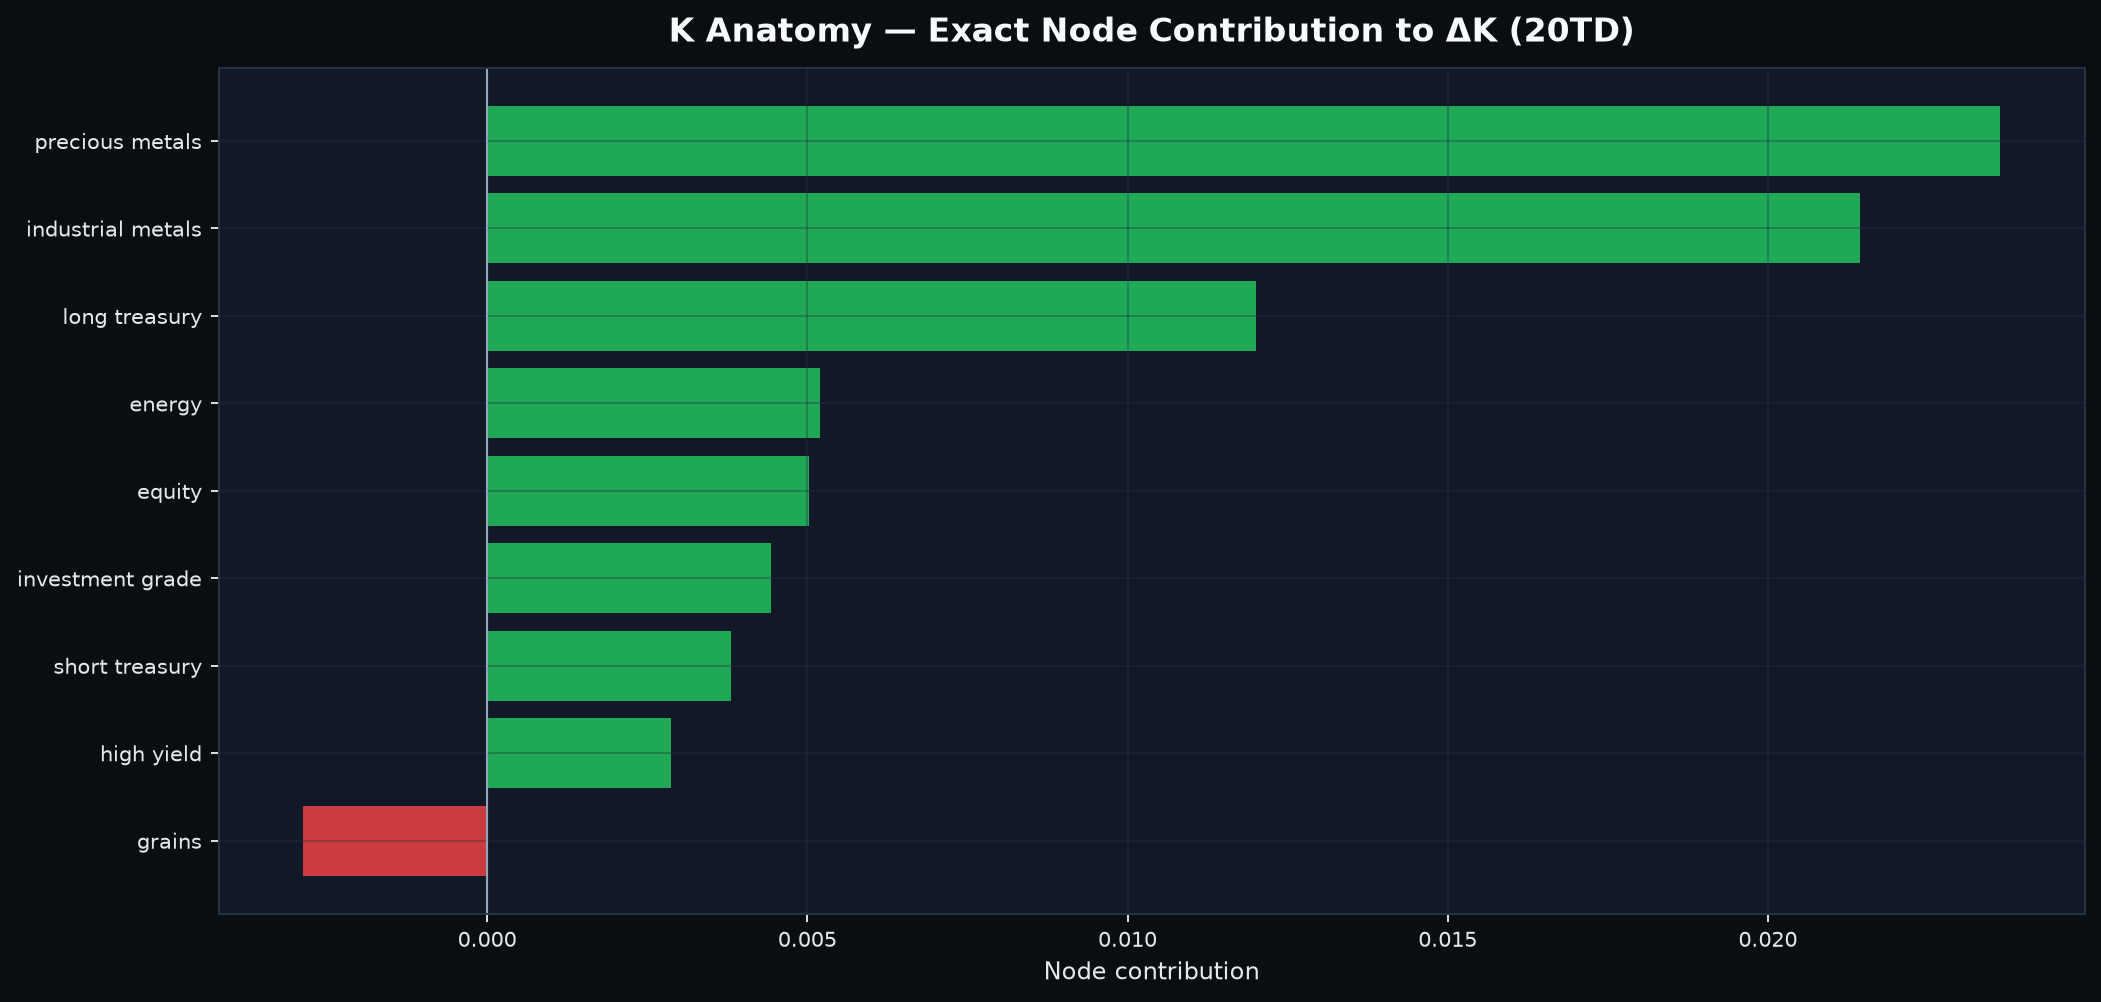
K is also high but directionless by construction. Raw K is about 0.518, meaning roughly half of standardized nine-sleeve variation is associated with the first common mode; participation ratio is 7.12 of 9, eigengap is about +1.20z and 5D mode stability is 0.995. The 20-day K increase of +0.0755 is led by precious metals (+0.0236), industrial metals (+0.0214) and long Treasuries (+0.0120), while the equity node contributes only +0.0050. This is a broad, stable common mode, not evidence by itself of an equity-led synchronized selloff.
CFTC adds a useful timing check. The September 22 positions were released September 25 and are the latest expected under the normal weekly schedule, but they still predate the article close by five trading days. Equity Asset Managers remain roughly +30.8% net long relative to open interest and increased that ratio by about +3.12 percentage points over the latest four reports (+0.95z change). That is directionally consistent with stronger equity relative preference. However, the system-level confirmation of the positive non-equity destinations is weak: the destination confirmation score is slightly negative and agreement is effectively zero. The appropriate read is lagged, mixed positioning context rather than a same-day veto.
4. Sector leadership: software returns to #1, but two of the top three groups are conflicted
| Bull rank | Sector | Bear-risk rank | Balance state | Representative tickers | Public read |
|---|---|---|---|---|---|
| 1 | Enterprise Software & IT Services | 2 | Two-sided conflict | MSTR, PANW, CIFR, AKAM, TEAM, ZS, OKTA | Strong Bull signal but equally important downside/conflict pressure. |
| 2 | Asset Management & Capital Markets | 21 | Bull-dominant | IREN, MARA, COIN, WULF, BMNR, RIOT, CRCL | Cleaner balance, but leadership is concentrated in digital-asset / compute-sensitive names. |
| 3 | Semiconductors & Tech Hardware | 1 | Two-sided conflict | ASTS, IONQ, CBRS, AXTI, AAOI, INTC, LITE | Strongest two-sided group: high upside rank and highest Bear-risk rank. |
| 4 | Industrial Machinery, Automation & Instruments | 7 | Bull-dominant | SMR, COHR, BE, VRT, GEV, PH, IR | AI-infrastructure/power/photonics exposure provides a real economic link. |
| 5 | Autos & Mobility | 6 | Bull-dominant | RIVN, TSLA, F, CVNA, GM, ORLY, AZO | Constructive Bull side, but Bear-risk is close enough to require price confirmation. |
| Sector | Current leading subcluster(s) | Key names | Economic linkage | Quant / price-support confirmation | Why now / public mechanism | Strongest counterevidence |
|---|---|---|---|---|---|---|
| Enterprise Software & IT Services | Cybersecurity / cloud software; AI-adjacent software | ZS, PANW, TEAM; MSTR/CIFR add nontraditional digital-asset exposure | Enterprise cloud/security spend and AI-agent security needs | ZS is support-confirmed and +5.4% above MA20; TEAM is high in Bull ranks but broader group is mixed | Zscaler reported 25% FY26 revenue and ARR growth and continued expansion of AI-security products | Bear-risk rank #2; the taxonomy is economically heterogeneous and several representatives have weak short-term price geometry |
| Asset Management & Capital Markets | Crypto miners / digital infrastructure / exchanges | IREN, MARA, COIN, WULF, BMNR | Digital-asset beta plus conversion of power capacity toward AI data-center demand | Bull rank #2 but no final support-confirmed stock from this group today | Recent market discussion highlights power capacity as the scarcity asset linking bitcoin miners and AI infrastructure | Several representatives are below MA5; clean sector balance has not translated into a final selected stock |
| Semiconductors & Tech Hardware | Direct-to-cell, quantum, optical and compute hardware | ASTS, IONQ, AXTI, AAOI, INTC, LITE | Connectivity/compute demand from AI infrastructure and communications | ASTS is support-confirmed, but currently below MA5 and MA20 | AST SpaceMobile continues to expand its next-generation BlueBird constellation and direct-to-cell network | Bear-risk rank #1 makes the sector explicitly two-sided |
| Industrial Machinery, Automation & Instruments | Photonics, data-center power and infrastructure equipment | COHR, BE, VRT, SMR | Physical infrastructure required to scale AI compute, power and optical connectivity | COHR is only 0.10 ATR from live support and slightly above MA20 | Coherent launched PhotonLink and 3.2T/6.4T optical solutions aimed at next-generation AI data centers | Bear-risk rank #7 and uneven representative price confirmation prevent a clean broad call |
| Autos & Mobility | Software-defined EVs and auto platforms | RIVN, TSLA, F, CVNA | Vehicle software, autonomy and EV product cycles | RIVN is support-confirmed but remains -3.5% below MA20 | RivianOS 2 unifies the R1/R2 software stack and reinforces the software-defined vehicle mechanism | Bear-risk rank #6 is close to the Bull rank and price confirmation is mixed |
The temporal change is meaningful but should not be mistaken for observed fund flow. On September 28 the Bull Top5 were Semiconductors, Autos, Asset Management, Credit and Industrials. On September 29, Enterprise Software returned at #1; Asset Management moved #3 to #2; Semiconductors slipped #1 to #3; Industrials moved #5 to #4; Autos moved #2 to #5; and Credit exited the Top5. The common thread is not a single sector rotation but a renewed software layer on top of an existing AI-infrastructure/compute backdrop.
That leadership remains selective. Enterprise Software and Semiconductors are the #2 and #1 Bear-risk groups, respectively, so their high Bull ranks are not clean endorsements. Asset Management is the cleanest balance statistically, but today it contributes no final support-confirmed stock. Industrials and Autos have final selected names, yet those names still differ sharply in trend quality. Sector rank therefore identifies where to look; price/support transmission decides whether the signal is actually working.
5. Selected stocks: four support confirmations, four different transmission states
| Stock | Sector | Selection tier / role | Bull rank (of 291) | Bear rank (of 291) | Recent support confirmation | Distance from live S1 | MA5 / MA20 | Slow-context summary |
|---|---|---|---|---|---|---|---|---|
| COHR | Industrial Machinery, Automation & Instruments | B / Bull screen | #16 of 291 | #54 of 291 | Same-day bullish center reclaim; Sep. 29 | 0.71% / 0.10 ATR | -0.04% / +0.32% | Financial rank 0.31; delayed 13F rank 0.72; positive divergences +0.33 / +0.60 |
| ASTS | Semiconductors & Tech Hardware | A+ / Bull screen | #1 of 291 | #36 of 291 | Same-day bullish center reclaim; Sep. 24 (3TD ago) | 2.02% / 0.28 ATR | -2.06% / -2.55% | Financial rank 0.03; delayed 13F rank 0.66; slow layers disagree with current price |
| RIVN | Autos & Mobility | B / Bull screen | #23 of 291 | #51 of 291 | Same-day bullish center reclaim; Sep. 29 | 1.52% / 0.33 ATR | -0.91% / -3.45% | Financial rank 0.12; delayed 13F rank 0.25; near-aligned but weak slow context |
| ZS | Enterprise Software & IT Services | B / Bull screen | #29 of 291 | #45 of 291 | Same-day bullish center reclaim; Sep. 29 | 2.99% / 0.56 ATR | -2.76% / +5.40% | Financial rank 0.29; delayed 13F rank 0.04; large negative price divergences -0.45 / -0.67 |
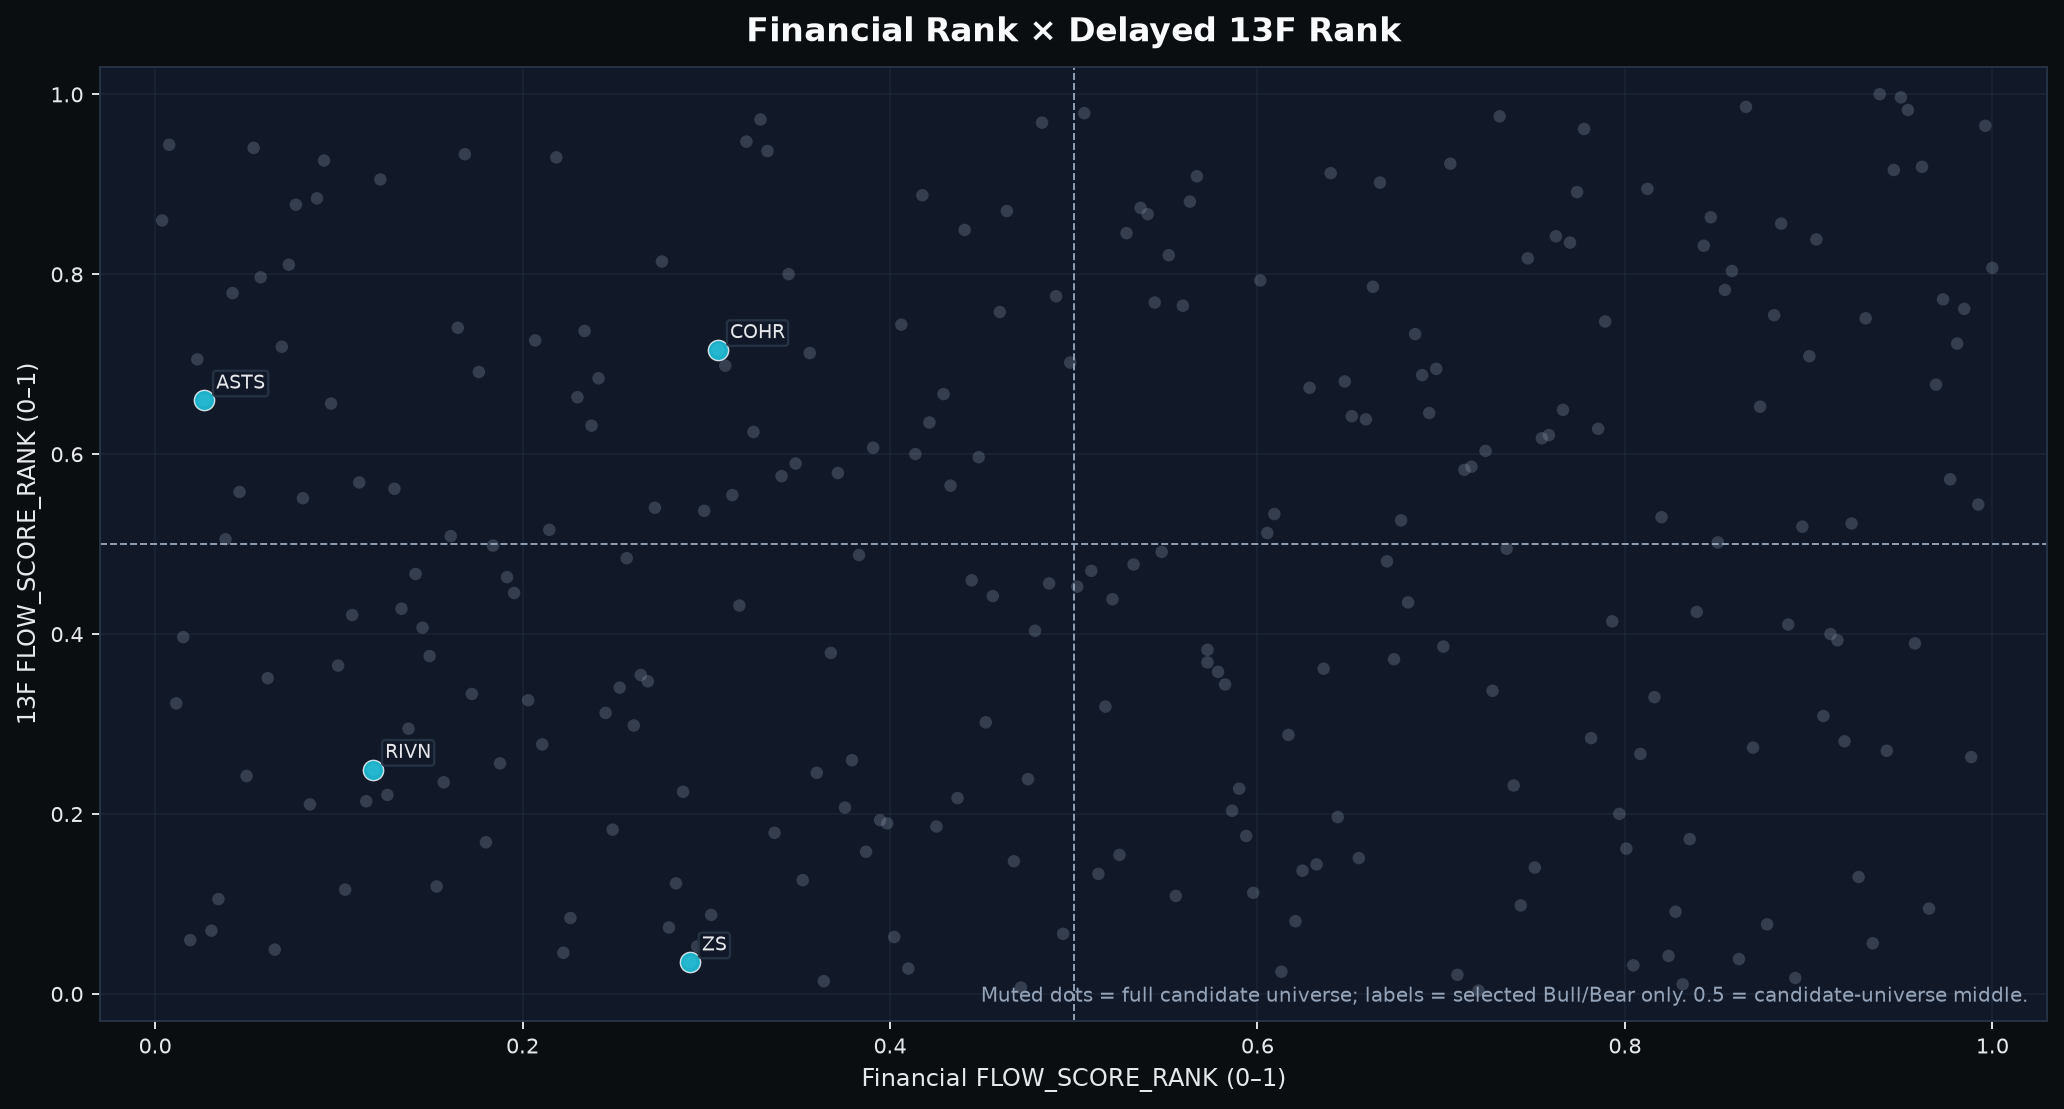
The quantitative screen fixes this four-name list and order. Public research and slower Financial/holdings context are used only as confirmation or counterevidence; they do not add, remove or rerank stocks. The comparable holdings snapshots are mostly from late May or early June 2026, so they are multi-month context rather than current institutional flow.
Closest support with actual trend confirmation: COHR
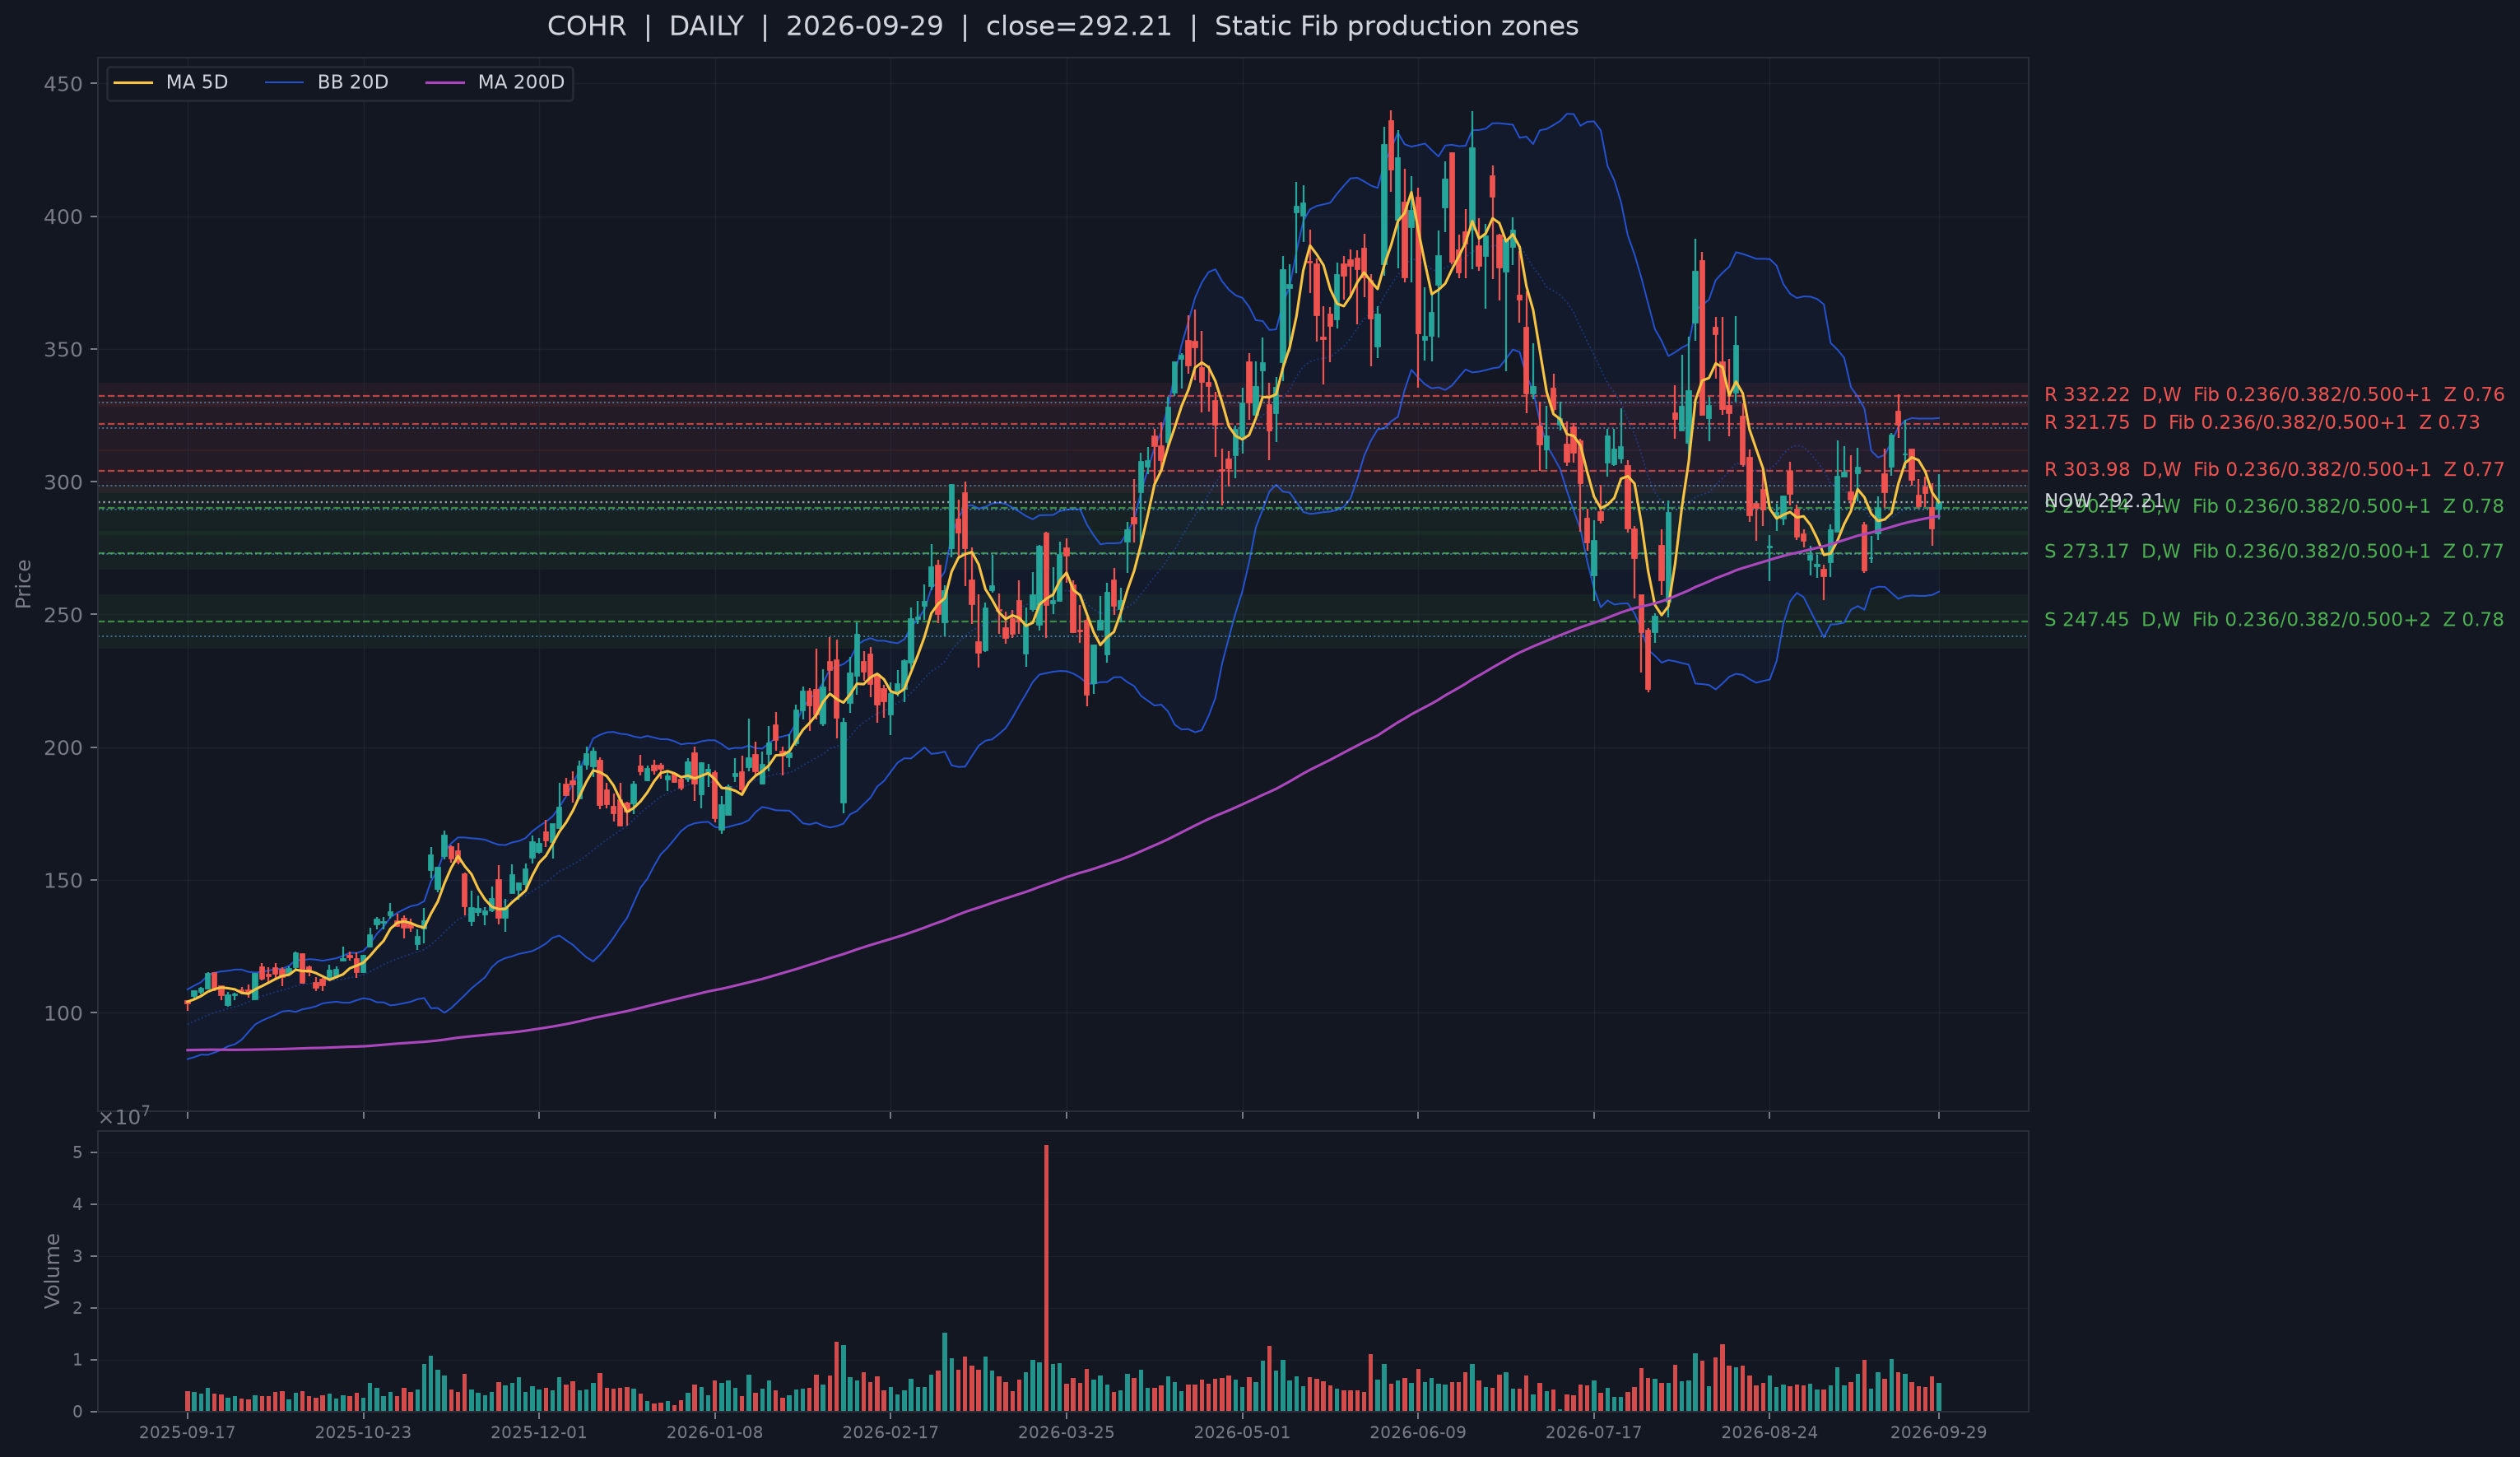
COHR is the cleanest support-to-price transmission case today. It is only 0.10 ATR above the current live S1 center, closed almost flat versus MA5 and slightly above MA20, and has positive slower context rather than a large disagreement. The public mechanism is also economically coherent: Coherent's PhotonLink platform, 3.2T pluggable demonstration and 6.4T near-packaged optical engine are explicitly aimed at next-generation AI datacenter connectivity. Its fiscal 2026 fourth quarter also showed 34% year-over-year revenue growth. The strongest counterevidence is market-level rather than company-specific: a strong optical demand story can still fail if high real rates and weak breadth prevent the support hold from translating into trend extension.
Support is real, but trend repair is not: ASTS and RIVN
ASTS has the best Bull rank in the entire 291-name universe and remains only 0.28 ATR from live support, but it is below both MA5 and MA20. Its slower layers disagree sharply: Financial rank is only 0.03 while delayed holdings rank is 0.66. The business mechanism is long-duration and capital intensive - a growing direct-to-cell constellation designed to connect ordinary smartphones. That makes the current high price-of-money environment a genuine counterweight. The setup needs price repair, not narrative rescue.
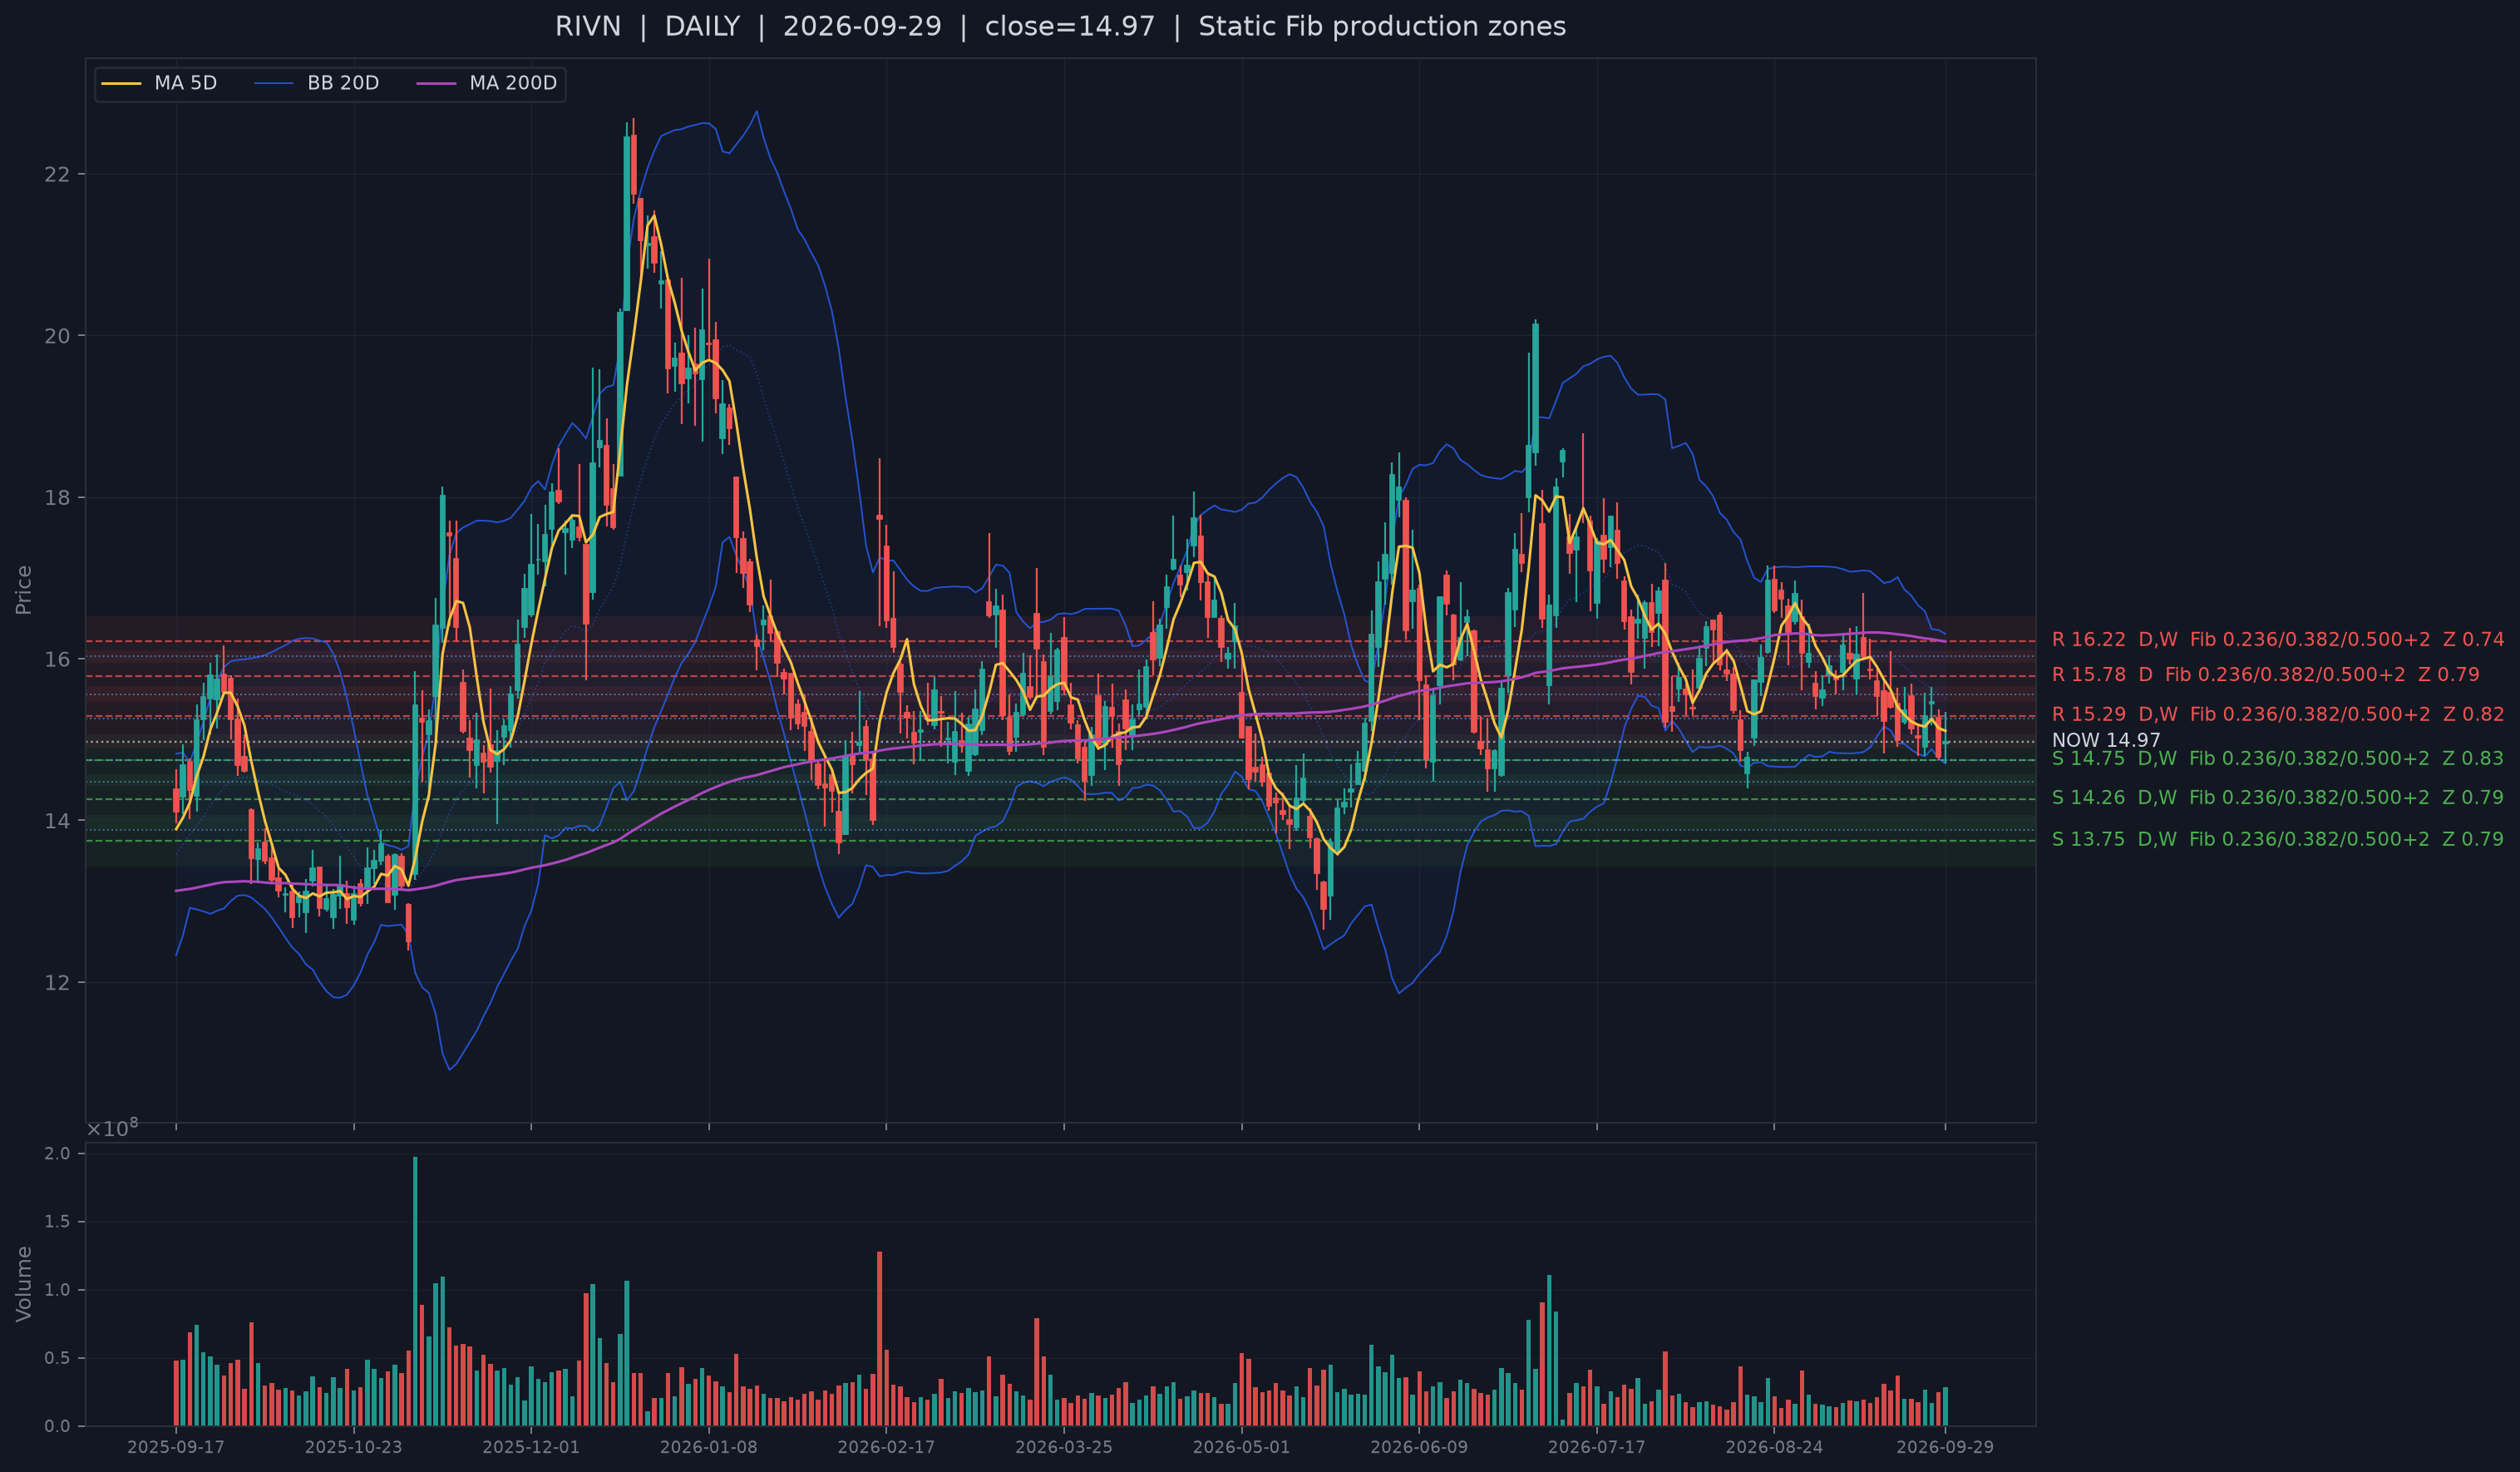
RIVN is a similar support-without-trend-repair control. It confirmed support on September 29 and is only 0.33 ATR above live S1, but remains roughly 3.5% below MA20. RivianOS 2 strengthens the software-defined vehicle thesis by unifying R1 and R2 on one software platform, yet the Financial and delayed-holdings ranks remain weak. A clean next step would be MA20 recovery accompanied by better market breadth; without that, the support confirmation remains local rather than trend-completing.
Price leads the slower layers: ZS
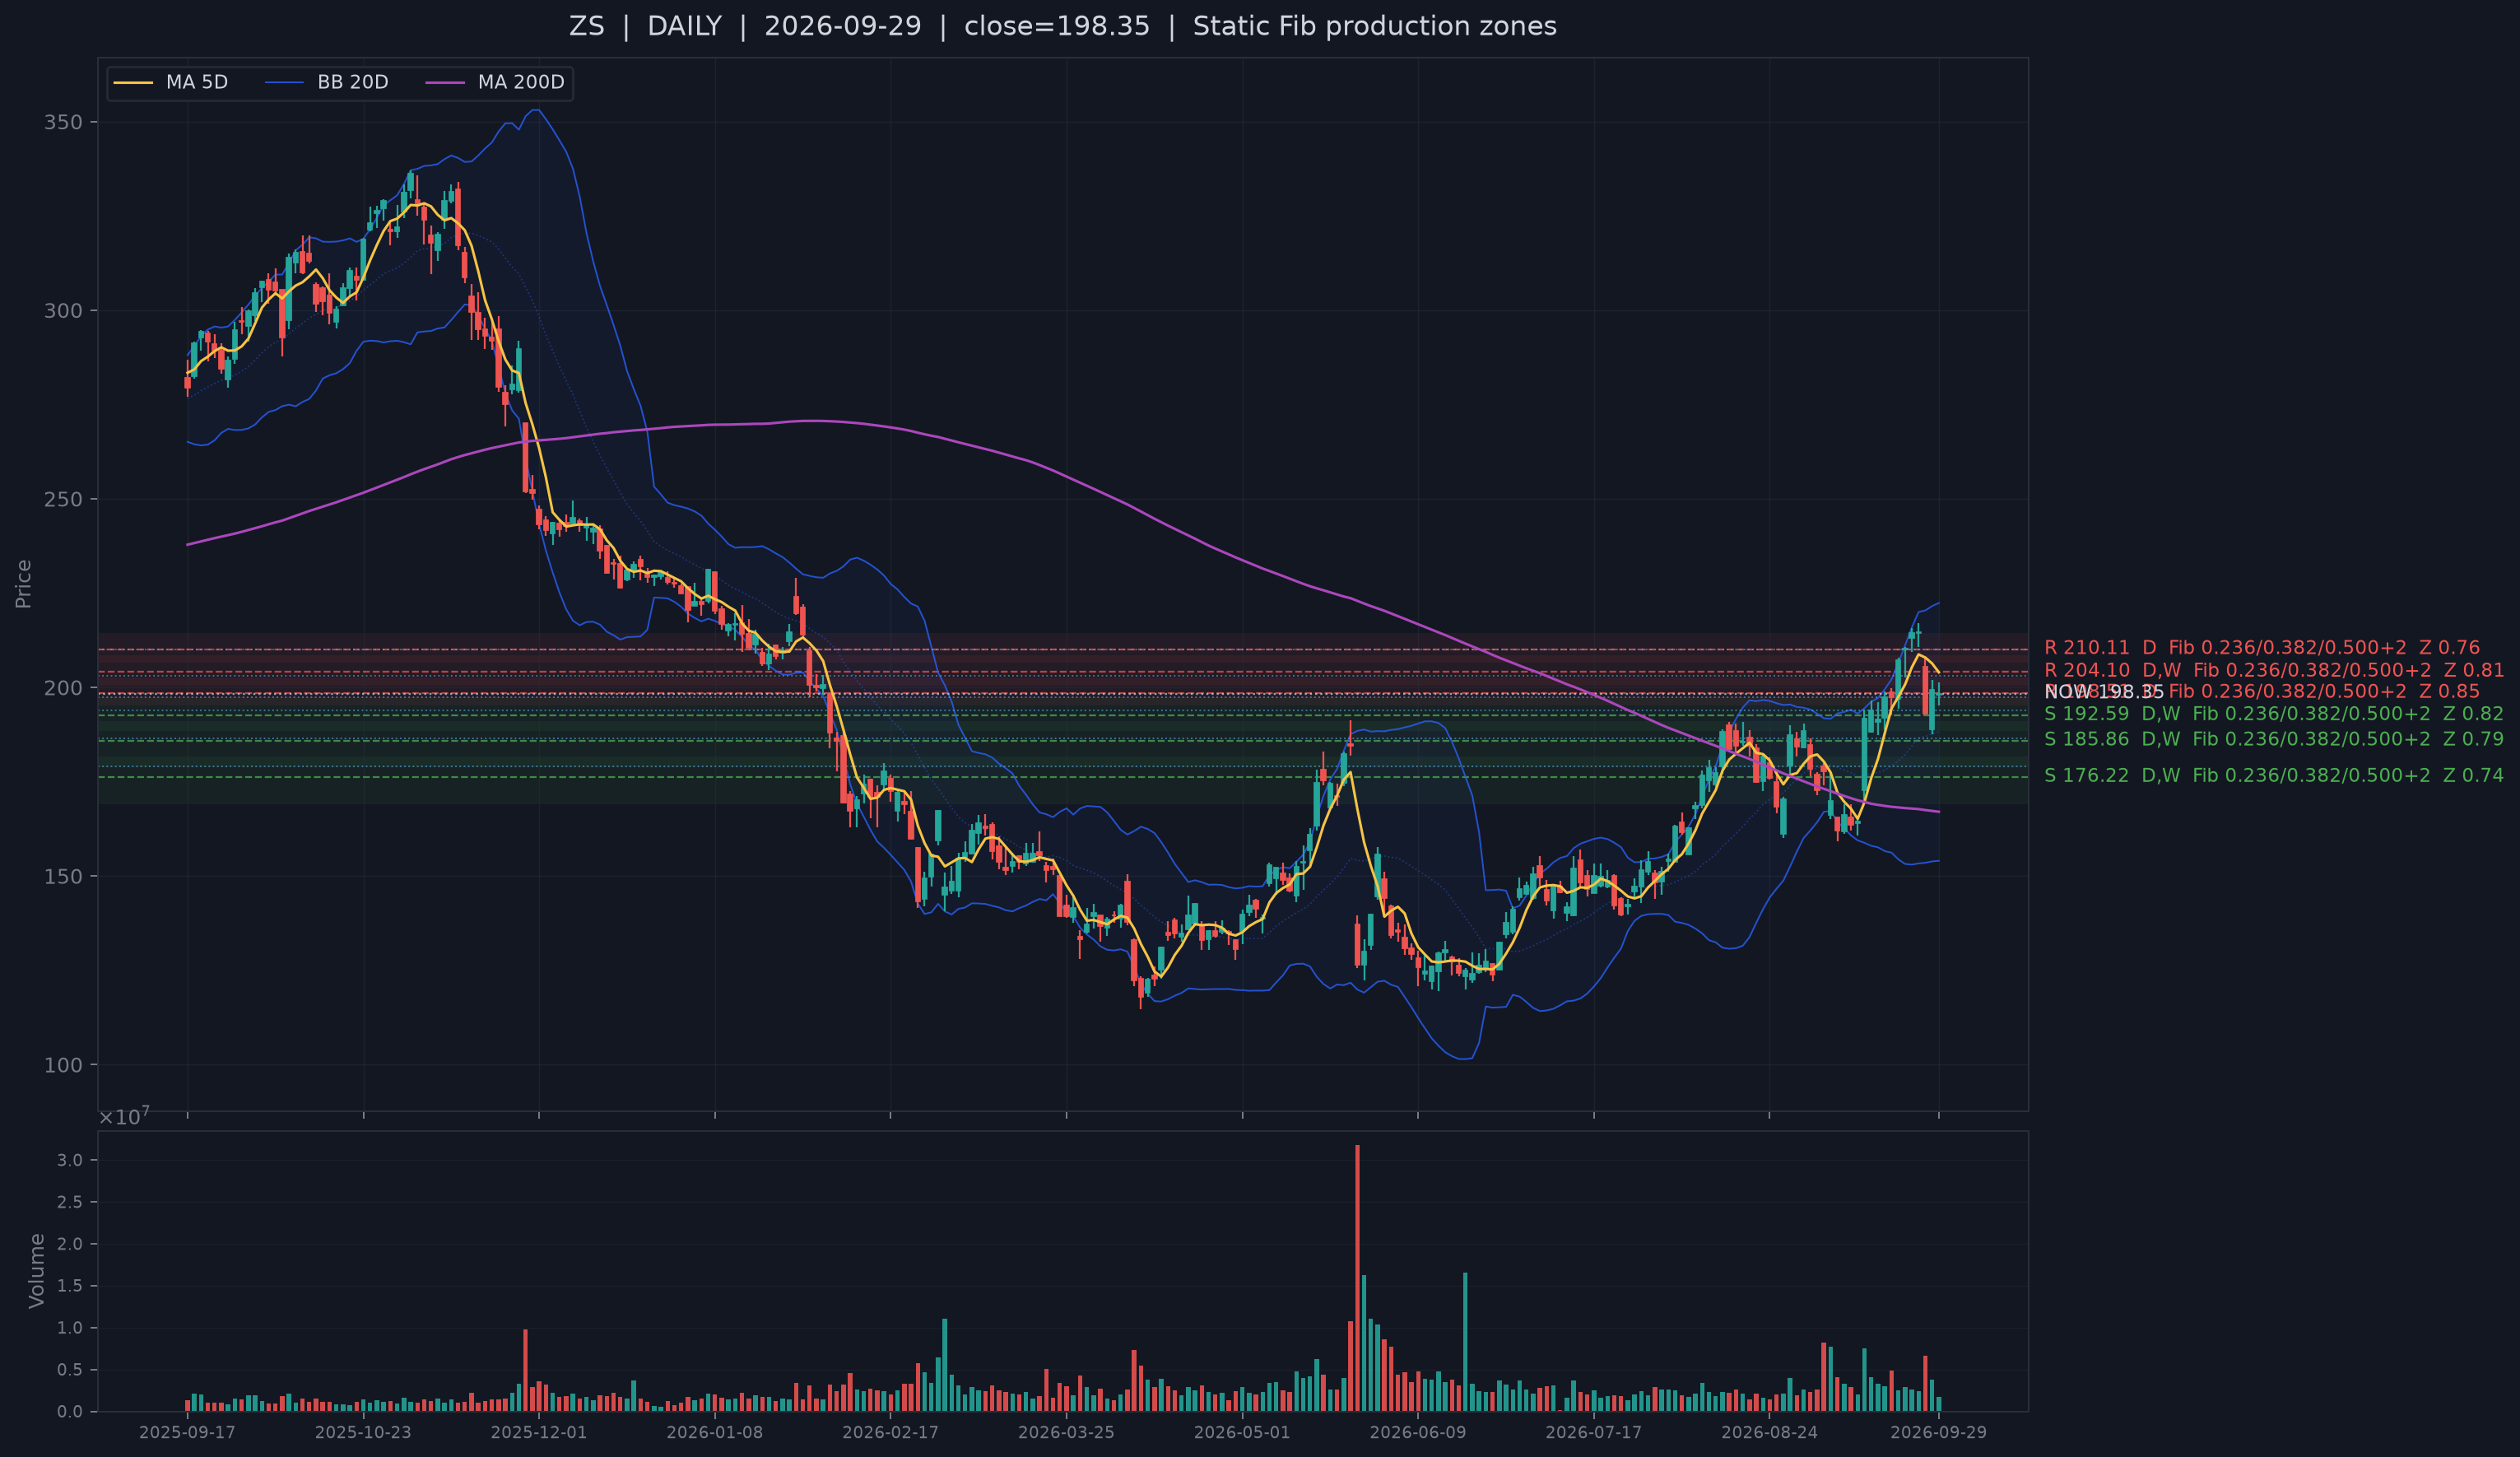
ZS is the opposite disagreement. It is still +5.4% above MA20 despite being below MA5, while Financial rank is only 0.29, delayed holdings rank 0.04 and both price divergences are strongly negative. Zscaler's fiscal 2026 results - 25% revenue and ARR growth, plus continued AI-security expansion - provide a credible business mechanism. But the slow layers have not caught up. This is exactly why slow context should remain secondary: the current setup can be price-confirmed even when delayed evidence is weak, but that disagreement raises the confirmation burden rather than invalidating the selected list.
6. Base case and falsification
Base case (3-10TD): selective support setups can work, but the market still needs a broad microstructure reset before leadership deserves a stronger confidence label. Confidence is moderate-low. Software and semiconductors offer genuine upside signals, yet both are two-sided sectors and the broad market's late-session order flow weakened.
What would strengthen it: the S&P and Nasdaq hold MA20; breadth stabilizes above the current 0.348 area; 20-day new-low damage recedes without a rise in down-3% breadth or dispersion; and Aggressor/Depth/Alignment reclaim 50 early and remain there into the afternoon. At the stock level, ASTS and RIVN need MA20 repair, while COHR and ZS need to hold their current support/trend advantages.
What would invalidate it: the indexes lose MA20 while breadth makes new lows, new-low damage spreads into large-decline breadth and cross-sectional volatility, and order flow again closes with all three axes below neutral. Macro risk would increase further if Real10-led tightening re-accelerates while the positive liquidity impulse stops cushioning the move.
Sources
- Reuters, Sep. 29, 2026 - U.S. equities closed slightly lower as elevated Treasury yields and inflation concerns remained in focus.
- Reuters Breakingviews, Sep. 23 - power capacity links bitcoin miners and AI data-center infrastructure, relevant to the digital-infrastructure names inside the capital-markets group.
- Coherent, Sep. 21 - PhotonLink integrated optics platform for next-generation AI infrastructure.
- Coherent, Aug. 12 - fiscal Q4 2026 revenue increased 34% year over year with margin expansion.
- Rivian, Sep. 4 - RivianOS 2 unified software platform across R1 and R2.
- Zscaler, Sep. 3 - fiscal Q4/FY26 revenue and ARR grew 25% year over year; management highlighted AI-security demand.
- AST SpaceMobile - company timeline documenting the August 5 launch of BlueBird 11, 12 and 13 as part of the next-generation constellation buildout.
- CFTC - Commitments of Traders reports; September 22 positions were released September 25 and are used only as lagged positioning context.