Breadth Narrows and Order Flow Stays Deeply Below Neutral as Semiconductor Leadership Holds
Weak breadth, rising new-low damage and deeply sub-neutral order flow outweigh a late repair attempt, while semiconductor leadership and selected support setups remain intact.
Horizon: 3-10 trading days.
This research is designed for 3-10 trading-day swing setups. The signals and conclusions may not transfer to intraday trading or longer-horizon investing.
Breadth Narrows and Order Flow Stays Deeply Below Neutral as Semiconductor Leadership Holds
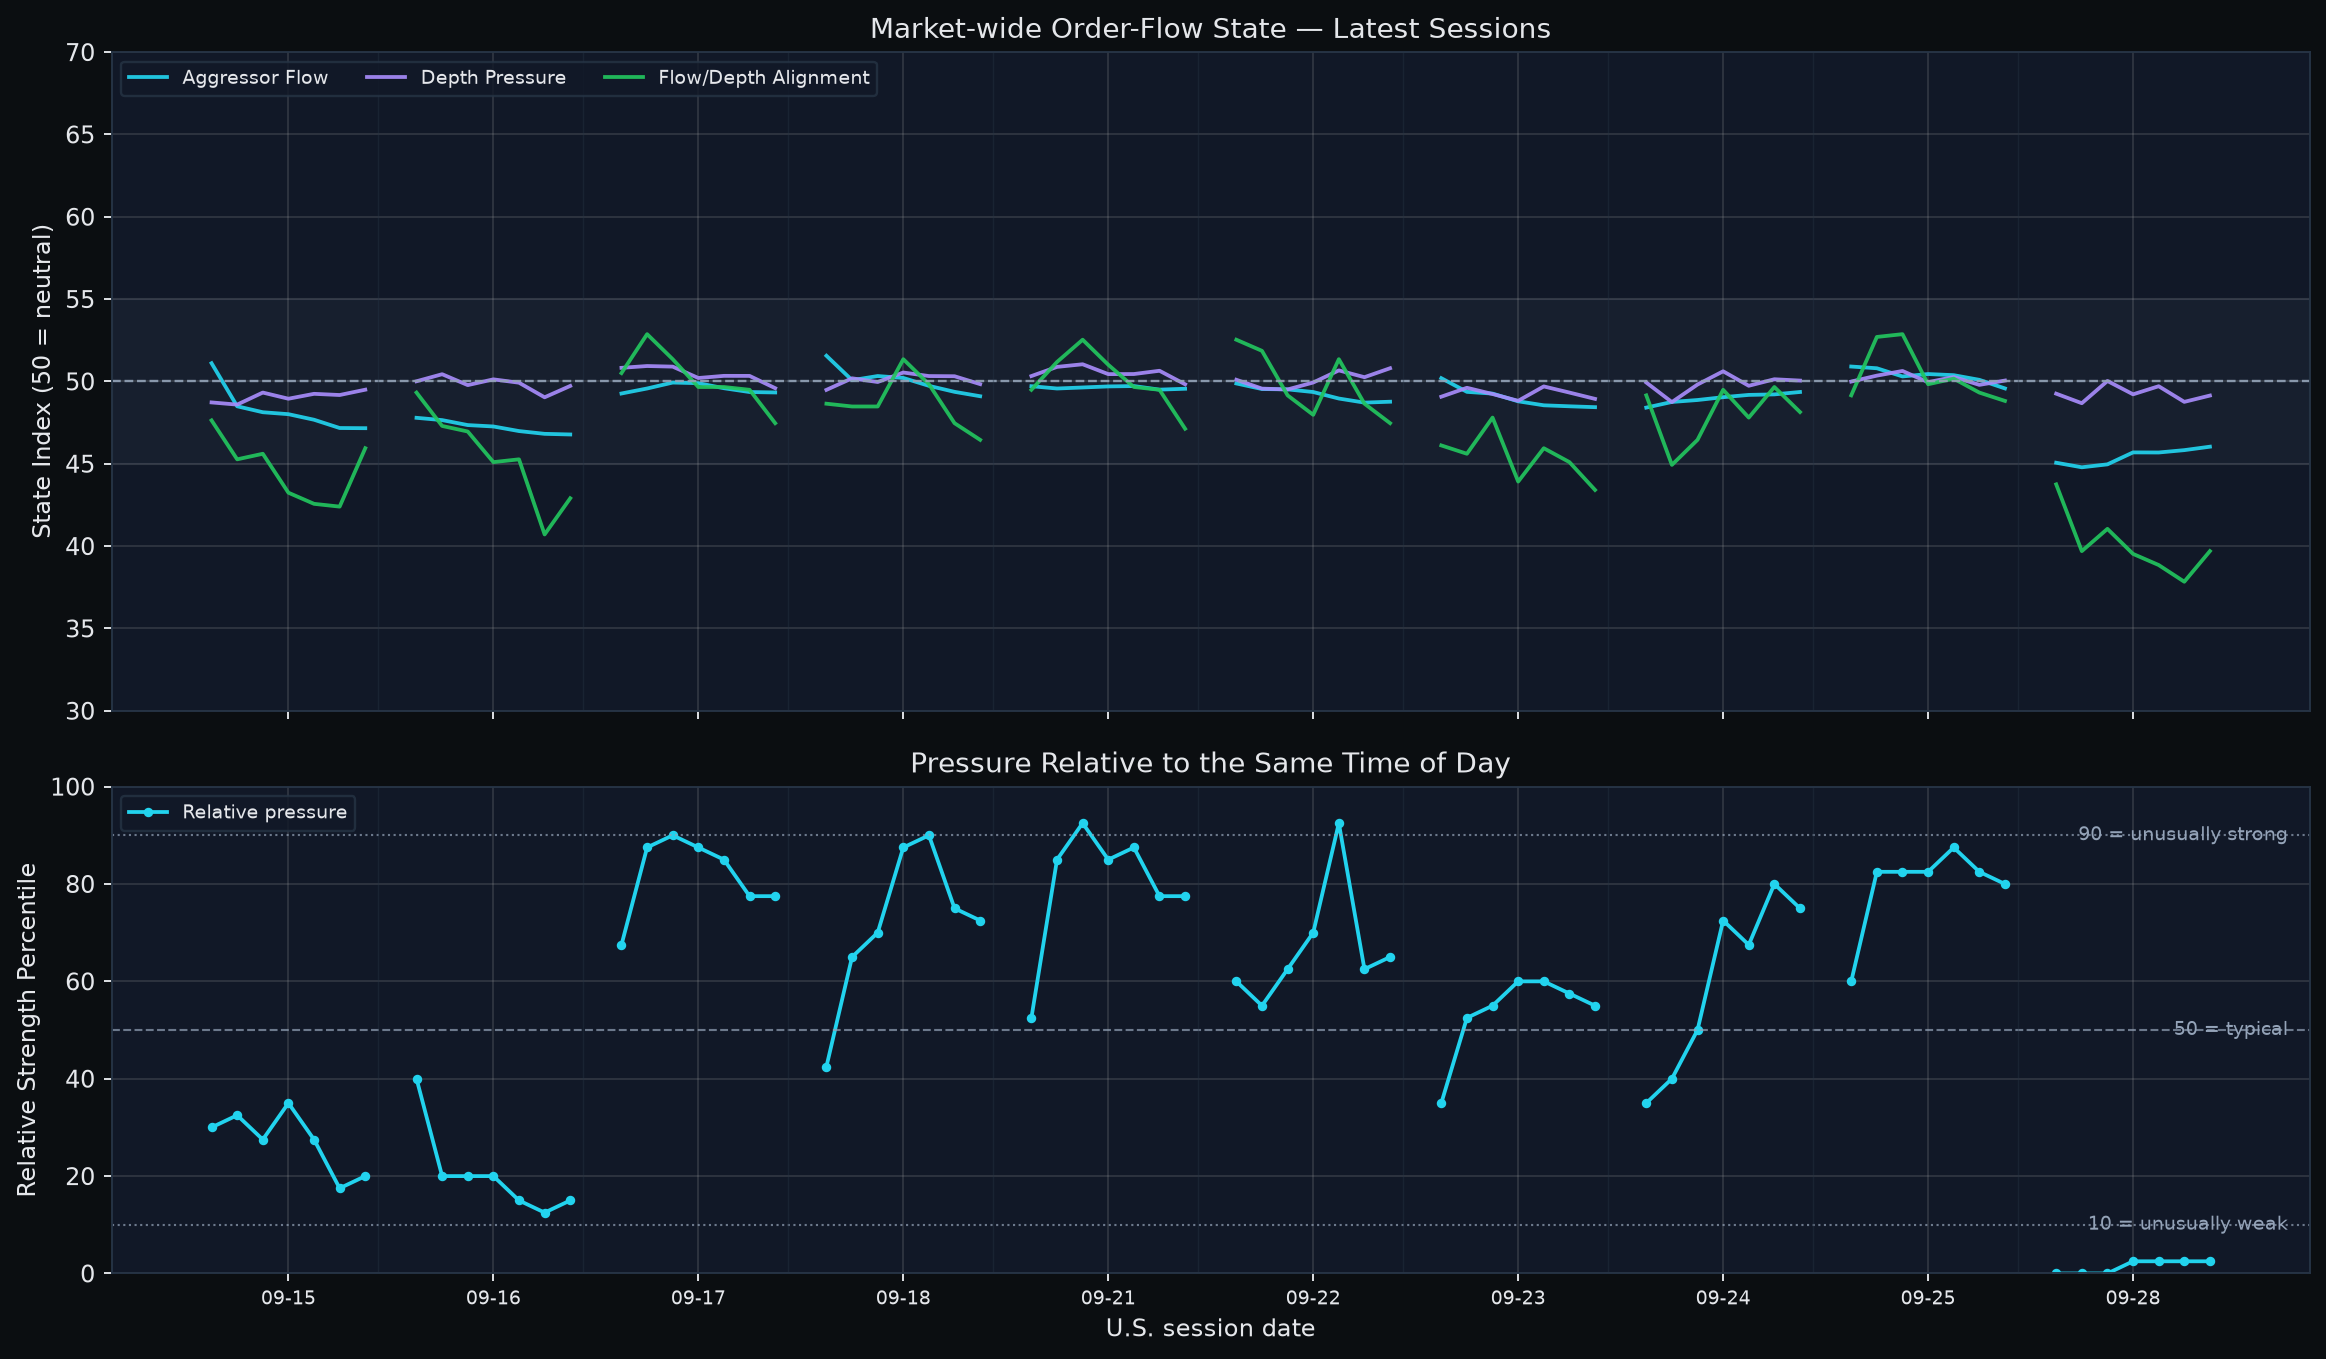
The market closed with a weaker internal structure than the headline trend alone suggests. The S&P 500 and Nasdaq Composite remain above their 20-day averages, but both finished below MA5. Breadth fell to 0.339, the 20-day and 252-day new-low damage gauges rose to +1.90z and +1.69z, and the market-wide order-flow complex spent essentially the entire session below the 50 neutral line. This is a deterioration in participation and microstructure, not yet a synchronized liquidation event.
The distinction matters because the strongest counterevidence is real. Down-3% breadth is only +0.84z and cross-sectional volatility is -0.69z, so large-decline breadth and dispersion have not joined the new-low damage. In the final hour, all three order-flow axes improved, Bear-aligned breadth fell by 4.05 percentage points and Buy-absorption breadth rose by 2.70 points. But that repair effort began from a deeply weak state: the close was only at the 2.5th same-time percentile, the equal-weight basket lost about 0.26% from open to close, and Aggressor Flow, Depth Pressure and Alignment all still ended below neutral.
My 3-10TD base case is therefore selective leadership inside a fragile market, with a high next-session repair burden. Semiconductor leadership remains #1, and several selected stocks are sitting near recently confirmed structural support. Yet the broad market needs more than a bounce: it needs sustained Aggressor and Alignment reclaims, improving aligned breadth, and stabilization in new-low damage. Macro conditions do not resolve the tension. Price-of-money pressure remains historically elevated, but the fresh 5D rate shock has cooled; liquidity is supportive; short Treasuries are the clearest positive non-equity relative-price destination; and the cross-asset common mode is broad but not a classic equity-led risk-off pattern.
How to read today's indicators
| Indicator | Reader scale | Interpretation |
|---|---|---|
| Market-wide order-flow state | Three component indices; 50 = neutral | Aggressor Flow, Depth Pressure and Flow/Depth Alignment answer different questions. Read confirmation or divergence; they are not probabilities. |
| Same-time order-flow percentile | 0-100; 50 = same-time historical median | 90 is unusually strong and 10 unusually weak for that intraday slot. Historical context, not event probability. |
| Flow × depth state breadth | Cross-sectional percentages | Bull/Bear aligned show joint direction; absorption-compatible states describe divergence, not actor intent. |
| Market breadth | 0-1; practical balance ~0.50 | Above 0.50 means broader participation. Direction and slope show whether participation is improving or fading. |
| z-score | 0 = historical mean | |z| ~1 is notable and |z| ~2 unusual. Standardized distance, not probability. |
| Historical percentile | 0-100; 50 = median | 90+ is historically elevated. A percentile is not event probability. |
| FLOW_SCORE_RANK | 0-1; 0.50 = median | 0.80+ is relatively strong slow context. Confirmation/context, not a standalone entry signal. |
| Financial / 13F price divergence | Approx. -1 to +1; 0 = little gap | Positive means slow context is ahead of price; negative means price is ahead. Reader bands: >+0.50 large positive, +0.20 to +0.50 meaningful positive, -0.20 to +0.20 small/near-aligned, -0.50 to -0.20 meaningful negative, and <-0.50 large negative. These are descriptive bands, not learned thresholds. |
| Expected next-session range | Non-directional high-low amplitude | Pair the raw estimate with its same-day cross-sectional percentile. It is not an upside target. |
1. Price, breadth and damage: trend survives while participation thins
| Layer | Current reading | Interpretation |
|---|---|---|
| S&P 500 | -0.48% vs MA5; +0.16% vs MA20 | Below the fast average but still barely above MA20; medium-term support is thinner than Nasdaq. |
| Nasdaq Composite | -0.67% vs MA5; +1.19% vs MA20 | Pullback inside a still-positive 20-day trend, but short-term momentum has weakened. |
| Breadth | 0.339; 5TD change -0.171 | Participation is weak and deteriorating, even though the 20-day breadth slope is roughly neutral (+0.24z). |
| New-low damage | 20D +1.90z; 252D +1.69z | Weak-tail damage is elevated and has expanded materially over five trading days. |
| Propagation checks | Down-3% breadth +0.84z; cross-sectional vol -0.69z | The weak tail has not yet become synchronized large-decline breadth or dispersion. |
| Warning memory | Structural-watch and systemic-warning states remain elevated | Historical warning configurations stay active; their percentiles are not crash probabilities. |
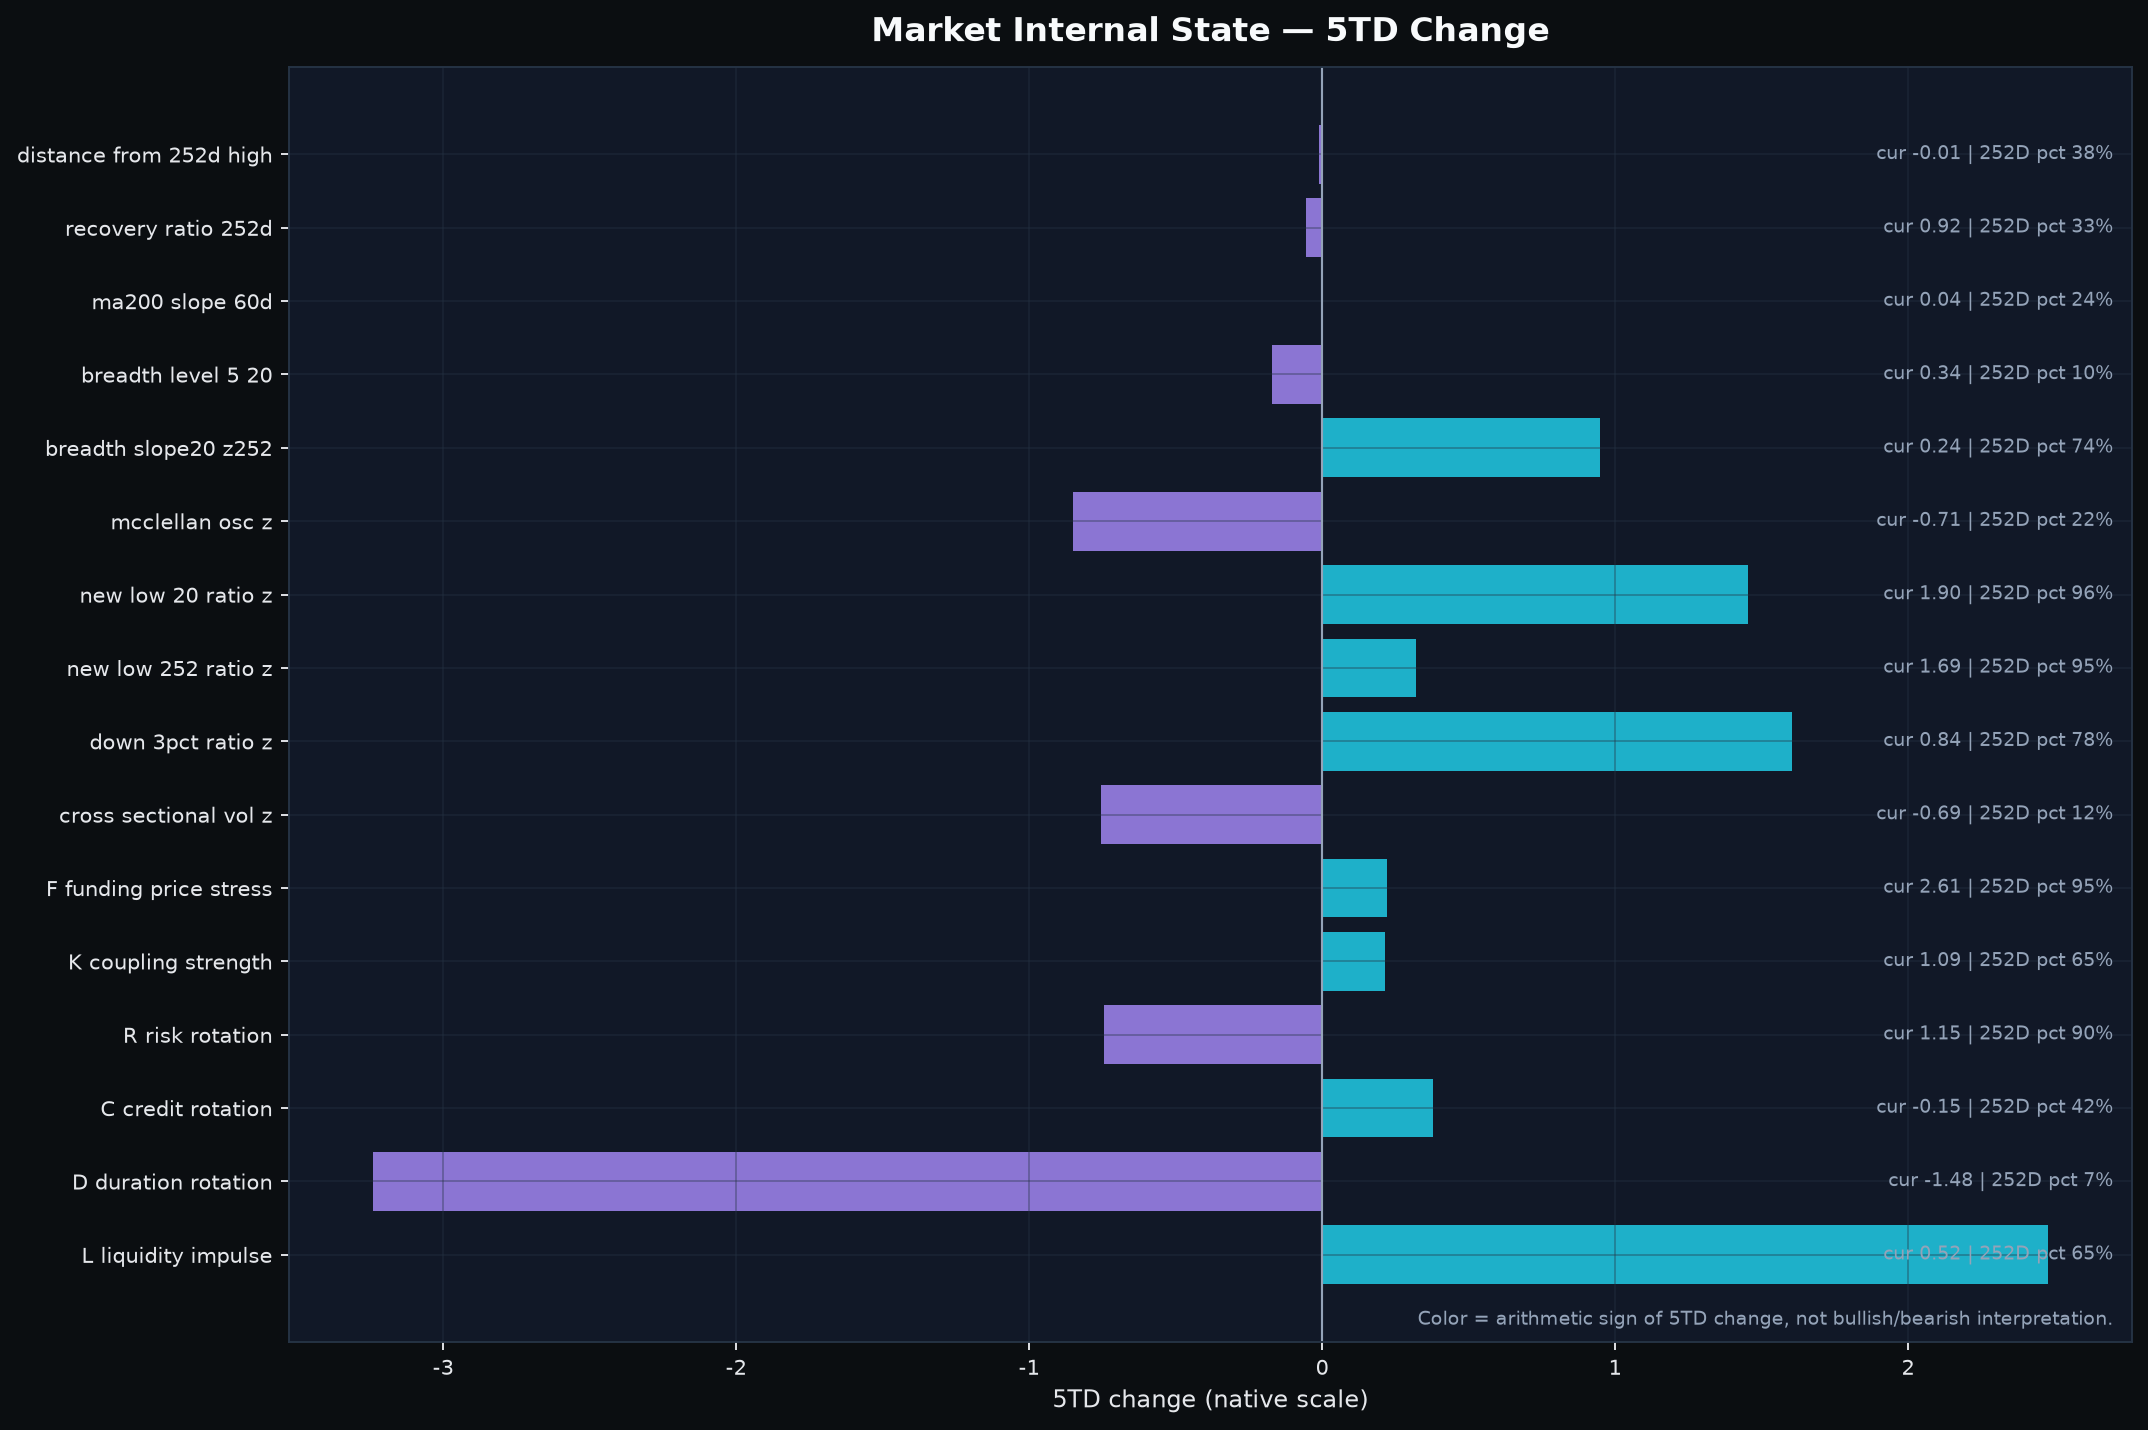
Scale note: the F value in this overview chart uses the market-internal 252-day standardization. The cross-asset F-state z discussed later uses a separate standardization, so the two z-scores should not be compared numerically.
The key change is not that the major indexes broke their medium-term trend; they did not. The change is that fewer stocks are participating while more names are falling into new-low damage. Breadth at 0.339 is in the lower tail of its recent distribution, and the 20-day new-low z-score has risen by roughly 1.45 standard deviations in five trading days. That combination creates a narrower market in which index resilience can conceal deterioration underneath.
The evidence still stops short of a broad liquidation classification. The share of stocks falling more than 3% is below a +1z damage state and cross-sectional volatility is unusually subdued. The appropriate propagation test is therefore whether new-low damage spreads into large-decline breadth and dispersion. If that happens while the indexes lose MA20, the current selective-leadership thesis would weaken sharply. If breadth stabilizes and the damage tail compresses while MA20 holds, the market can remain selective without becoming systemic.
2. Order flow: a late repair attempt from an exceptionally weak state
| Time | Aggressor Flow | Depth Pressure | Alignment | Same-time pct. | Bull aligned | Bear aligned | Buy absorption | Sell absorption | EW bar response |
|---|---|---|---|---|---|---|---|---|---|
| 09:30 | 45.06 | 49.26 | 43.75 | 0.0 | 8.8% | 21.3% | 16.6% | 11.5% | -0.001% |
| 10:30 | 44.79 | 48.68 | 39.70 | 0.0 | 6.1% | 26.7% | 20.6% | 7.8% | -0.004% |
| 11:30 | 44.97 | 50.03 | 41.05 | 0.0 | 8.4% | 26.4% | 28.4% | 6.8% | +0.007% |
| 12:30 | 45.69 | 49.22 | 39.53 | 2.5 | 5.7% | 26.7% | 21.6% | 8.1% | -0.003% |
| 13:30 | 45.69 | 49.71 | 38.85 | 2.5 | 6.1% | 28.4% | 24.0% | 8.4% | -0.000% |
| 14:30 | 45.83 | 48.76 | 37.84 | 2.5 | 6.4% | 30.7% | 23.0% | 8.1% | -0.001% |
| 15:30 | 46.04 | 49.14 | 39.70 | 2.5 | 6.1% | 26.7% | 25.7% | 9.1% | -0.002% |
The seven-bar path is substantially weaker than a close-only snapshot would imply. Aggressor Flow never reached 50 and closed at 46.04. Depth Pressure briefly touched 50.03 at 11:30 but finished at 49.14. Flow/Depth Alignment was below neutral at every checkpoint and fell as low as 37.84 at 14:30 before recovering to 39.70. The same-time percentile was 0 at the first three checkpoints and only 2.5 thereafter. In other words, this was not merely a close below neutral; it was an intraday state that was unusually weak relative to the history of those exact time slots.
The final hour deserves a separate adjudication. Aggressor improved by +0.21 points, Depth by +0.38 and Alignment by +1.86, so all three axes were improving into the close. Bear-aligned breadth fell by 4.05 percentage points and Buy-absorption breadth rose by 2.70 points. The bundle therefore classifies the final-bar confirmation as absorption-compatible non-directional repair. But repair effort is not state repair: Aggressor still needed +3.96 points to reclaim 50, Depth +0.86 and Alignment +10.30. Bull-aligned breadth remained only 6.1%, and the equal-weight basket lost about 0.26% from open to close.
This makes the close more nuanced than either “capitulation” or “successful recovery.” The final hour improved from a deeply weak base, but the 2.5 same-time percentile confirms that the close itself remained historically weak for the time of day. The next session needs an early and persistent reclaim - especially in Alignment and Aggressor Flow - plus better Bull-aligned breadth and a positive equal-weight response. A brief opening rebound that leaves the state axes below 50 would not satisfy that burden.
3. Cross-asset conditions: expensive money, a cooler fresh shock and a short-Treasury destination
| Layer | Current reading | Interpretation |
|---|---|---|
| Price of money (F) | Raw +0.440 (~+44 bp 20TD tightening); state z +2.25 | 2Y +23.5 bp and Real10 +20.5 bp. The state is tight, but the current 5D shock is only +0.44z. |
| Liquidity (L) | State z +0.52; 5D shock +1.57z | Positive liquidity quantity is an important counterweight to the high price of money. |
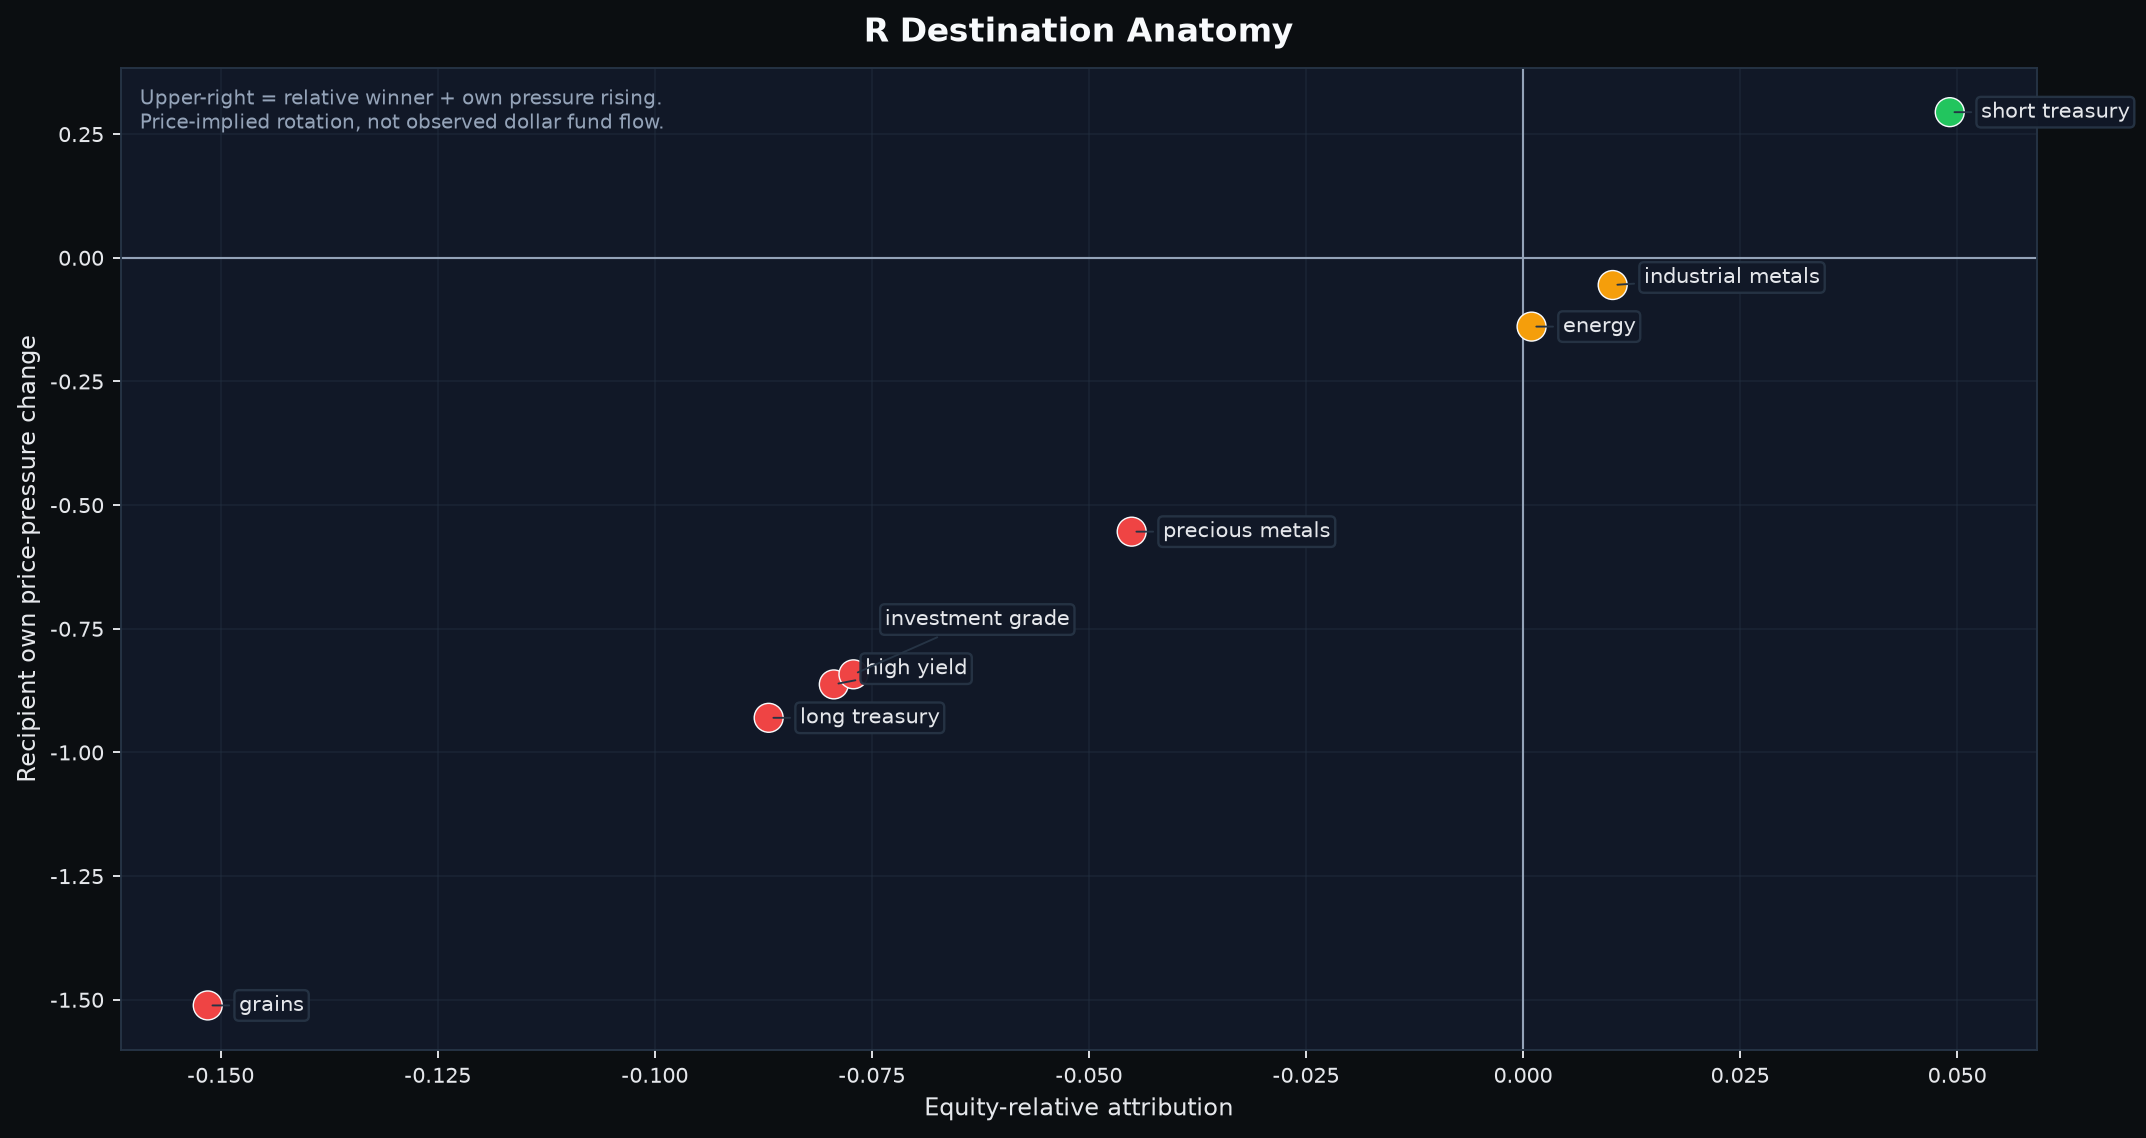
| Relative preference (R) | 20D change +0.38 toward equities | Short Treasuries are the clearest positive non-equity destination; this is price-implied rotation, not observed dollar flow. |
| Coupling (K) | Raw 0.519; 20D +0.073; PR 7.17/9 | Broad, stable common mode, but risk-mode alignment is modest and the equity node contribution is small. |
| CFTC positioning | Sep. 22 positions; released Sep. 25; 4TD age | Fresh under the normal weekly schedule. Equity net-long positioning strengthened, while the short-Treasury destination has little CFTC confirmation. |
Price-of-money pressure is still restrictive, but the distinction between state and fresh shock matters. Raw F is about +0.44, representing roughly +44 bp of blended 20-trading-day tightening: about +23.5 bp from the 2Y component and +20.5 bp from the approximate real-10Y component. The standardized state remains high at about +2.25z. Yet the current five-day shock is only +0.44z, well below the most recent extreme +1.94z Real10-led impulse on September 24, now two trading days old. That means the market is operating under a high discount-rate regime rather than absorbing a newly accelerating rate shock today.
Liquidity quantity provides a real counterforce. L is positive and its five-day shock is about +1.57z, so it would be wrong to reduce the macro picture to “rates up, equities down.” R instead shows where relative-price preference has moved: its 20-day change remains positive toward equities, and short Treasuries are the only clear non-equity destination with both positive R-gap attribution and positive own pressure. Long Treasuries, IG and HY are not acting like classic safety destinations. This is a relative-price statement, not evidence of observed dollar flows.
K reinforces the idea that one macro mode is important without telling us its direction by itself. Raw K is about 0.519, so roughly half of the standardized cross-asset variation is associated with the first common mode. The participation ratio is about 7.17 of 9 sleeves, eigengap is elevated, and 5D mode stability is 0.997. The 20-day increase in K is led mainly by precious metals, industrial metals and long-Treasury-linked relationships; the equity node is small and risk-mode alignment is only about +0.14. Higher coupling therefore does not equal an equity-led risk-off regime.
The CFTC layer is useful but lagged. The September 22 positioning snapshot was released September 25 and is current under the normal weekly COT schedule, while still four trading days behind this market close. Equity Asset Managers remain about +30.8% net long relative to open interest and increased that net-long ratio by roughly 3.12 percentage points over the latest four reports, a moderate positive change (+0.95z). That is broadly compatible with the positive equity-relative R state. By contrast, the short-Treasury price destination has almost no CFTC change confirmation, so futures positioning does not independently validate that destination. This is context, not a same-day veto.
4. Sector leadership: Semiconductors stay on top, but the composition broadens away from last session
| Bull rank | Sector | Bear-risk rank | Balance state | Representative tickers | Public read |
|---|---|---|---|---|---|
| #1 | Semiconductors & Tech Hardware | #1 | Two Sided Conflict | AXTI, AAOI, IONQ, SNDK, ASTS, CBRS, INTC | Leadership remains powerful but two-sided; selected support candidates span optics, test/power and space connectivity. |
| #2 | Autos & Mobility | #12 | Bull Dominant | RIVN, CVNA, F, TSLA, GM, ORLY, AZO | Bull-dominant rank improvement, but selected RIVN still needs price repair. |
| #3 | Asset Management & Capital Markets | #17 | Bull Dominant | IREN, WULF, BMNR, HUT, CRCL, RIOT, MARA | Crypto-sensitive treasury exposure leads selected coverage rather than a classic asset-manager basket. |
| #4 | Credit & Mortgage Finance | #16 | Bull Dominant | PYPL, AGNC, SOFI, RKT, V, MA, AXP | Payments/consumer-finance exposure is represented by PYPL; slower context is weak. |
| #5 | Industrial Machinery, Automation & Instruments | #10 | Bull Dominant | BE, VRT, SMR, COHR, PH, GEV, IR | AI data-center power and cooling infrastructure remain the economic link. |
The current Top 5 is materially different from September 25. Semiconductors remain #1 and still carry the strongest Bear-risk rank, so the leadership is powerful but explicitly two-sided. Asset Management holds #3 but improves from a two-sided state to Bull-dominant. Autos, Credit & Mortgage Finance, and Industrial Machinery enter the Top 5, while Internet/Media, Consumer Services and Enterprise Software fall out. That is a cross-sectional rank and composition change, not evidence of sector dollar inflows.
| Sector | Current leading subcluster(s) | Key names | Economic linkage | Quant/price-support confirmation | Why now/public mechanism | Strongest counterevidence |
|---|---|---|---|---|---|---|
| Semiconductors & Tech Hardware | AI optical connectivity; semiconductor test/power; space connectivity | AAOI, TER, MPWR, GLW, ASTS | AI compute scale-up increases optical bandwidth, test complexity, power density and connectivity demand. | Mixed: TER/MPWR trend strength contrasts with AAOI/GLW below-MA20 controls. | AOI's optical/HFC roadmap and Teradyne's AI/data-center test products support the mechanism. | Bear-risk #1; leadership is explicitly two-sided. |
| Autos & Mobility | EV platform + software-defined vehicle | RIVN | Rivian's vertically integrated EV/software stack ties sector strength to R2 execution and software adoption. | Weak: RIVN is below MA5 and MA20 despite support confirmation. | RivianOS 2 unifies the software stack across R1 and R2. | Single selected name and incomplete trend repair. |
| Asset Management & Capital Markets | Crypto treasury / ETH-sensitive balance-sheet exposure | BMNR | The selected name behaves more like a crypto-treasury vehicle than a traditional asset manager. | Mixed: above MA20 but below MA5; comparable Financial/13F ranks unavailable. | BitMine reported 5.98M ETH tokens and $17.1B crypto-plus-cash holdings on Sep. 21. | Cash-flow quality is poor in official-filing fallback; ownership snapshot is non-comparable. |
| Credit & Mortgage Finance | Digital payments / wallets | PYPL | Payments volume and merchant-consumer network economics link the name to transaction activity rather than rate-sensitive lending alone. | Moderate: price is above MA5/MA20 but Bull/Bear rank gap is narrow. | No incremental current public catalyst is needed to explain the private business exposure. | Financial rank 0.39 and delayed holdings rank 0.16 are both weak. |
| Industrial Machinery, Automation & Instruments | AI data-center onsite power and thermal infrastructure | BE, VRT | Power availability and cooling are bottlenecks as AI data centers scale. | Mixed: BE is above MA20; VRT is below MA20 and both are below MA5. | Bloom highlights 800V DC-native power economics; Vertiv is expanding high-density liquid-cooling services. | Rate pressure and incomplete price confirmation limit the thesis. |
The economic commonality is not one simple theme. AI infrastructure still matters through optical connectivity, test/power and data-center energy/cooling, but the Top 5 now also contains autos, crypto-sensitive balance-sheet exposure and payments. The broader economic coverage is constructive only if price confirmation follows. The counterexample is already inside the selected list: several names have recent support confirmation while still trading below MA20. That makes current sector leadership more of a candidate set than a completed trend signal.
5. Selected stocks: support is close, but transmission quality is highly uneven
| Stock | Sector | Selection tier/role | Bull rank (of 291) | Bear rank (of 291) | Recent structural support | Distance to live support | vs MA5 / MA20 | Slow context |
|---|---|---|---|---|---|---|---|---|
| AAOI | Semiconductors & Tech Hardware | A+ Bull screen | #4 | #36 | same-day center reclaim; 2 TD ago | 0.08% / 0.01 ATR | -4.6% / -5.8% | Financial rank 0.47; delayed 13F rank 0.87 |
| TER | Semiconductors & Tech Hardware | B Bull screen | #25 | #165 | same-day center reclaim; 1 TD ago | 0.06% / 0.01 ATR | +1.6% / +9.8% | Financial rank 0.89; delayed 13F rank 0.86 |
| RIVN | Autos & Mobility | A Bull screen | #13 | #119 | same-day center reclaim; 2 TD ago | 0.48% / 0.11 ATR | -2.3% / -4.9% | Financial rank 0.12; delayed 13F rank 0.25 |
| MPWR | Semiconductors & Tech Hardware | B Bull screen | #16 | #50 | same-day center reclaim; 1 TD ago | 1.07% / 0.26 ATR | -0.5% / +8.6% | Financial rank 0.67; delayed 13F rank 0.79 |
| BE | Industrial Machinery, Automation & Instruments | A+ Bull screen | #1 | #39 | same-day center reclaim; 2 TD ago | 2.20% / 0.28 ATR | -4.1% / +1.5% | Financial rank 0.78; delayed 13F rank 0.84 |
| BMNR | Asset Management & Capital Markets | B Bull screen | #22 | #178 | same-day center reclaim; 2 TD ago | 2.39% / 0.38 ATR | -3.2% / +5.2% | Official-filing fallback: revenue YoY +2167.8%, CFO margin -479.0%, FCF margin -481.4%; ownership snapshot 41.4% (non-comparable fallback, not a 13F flow rank). |
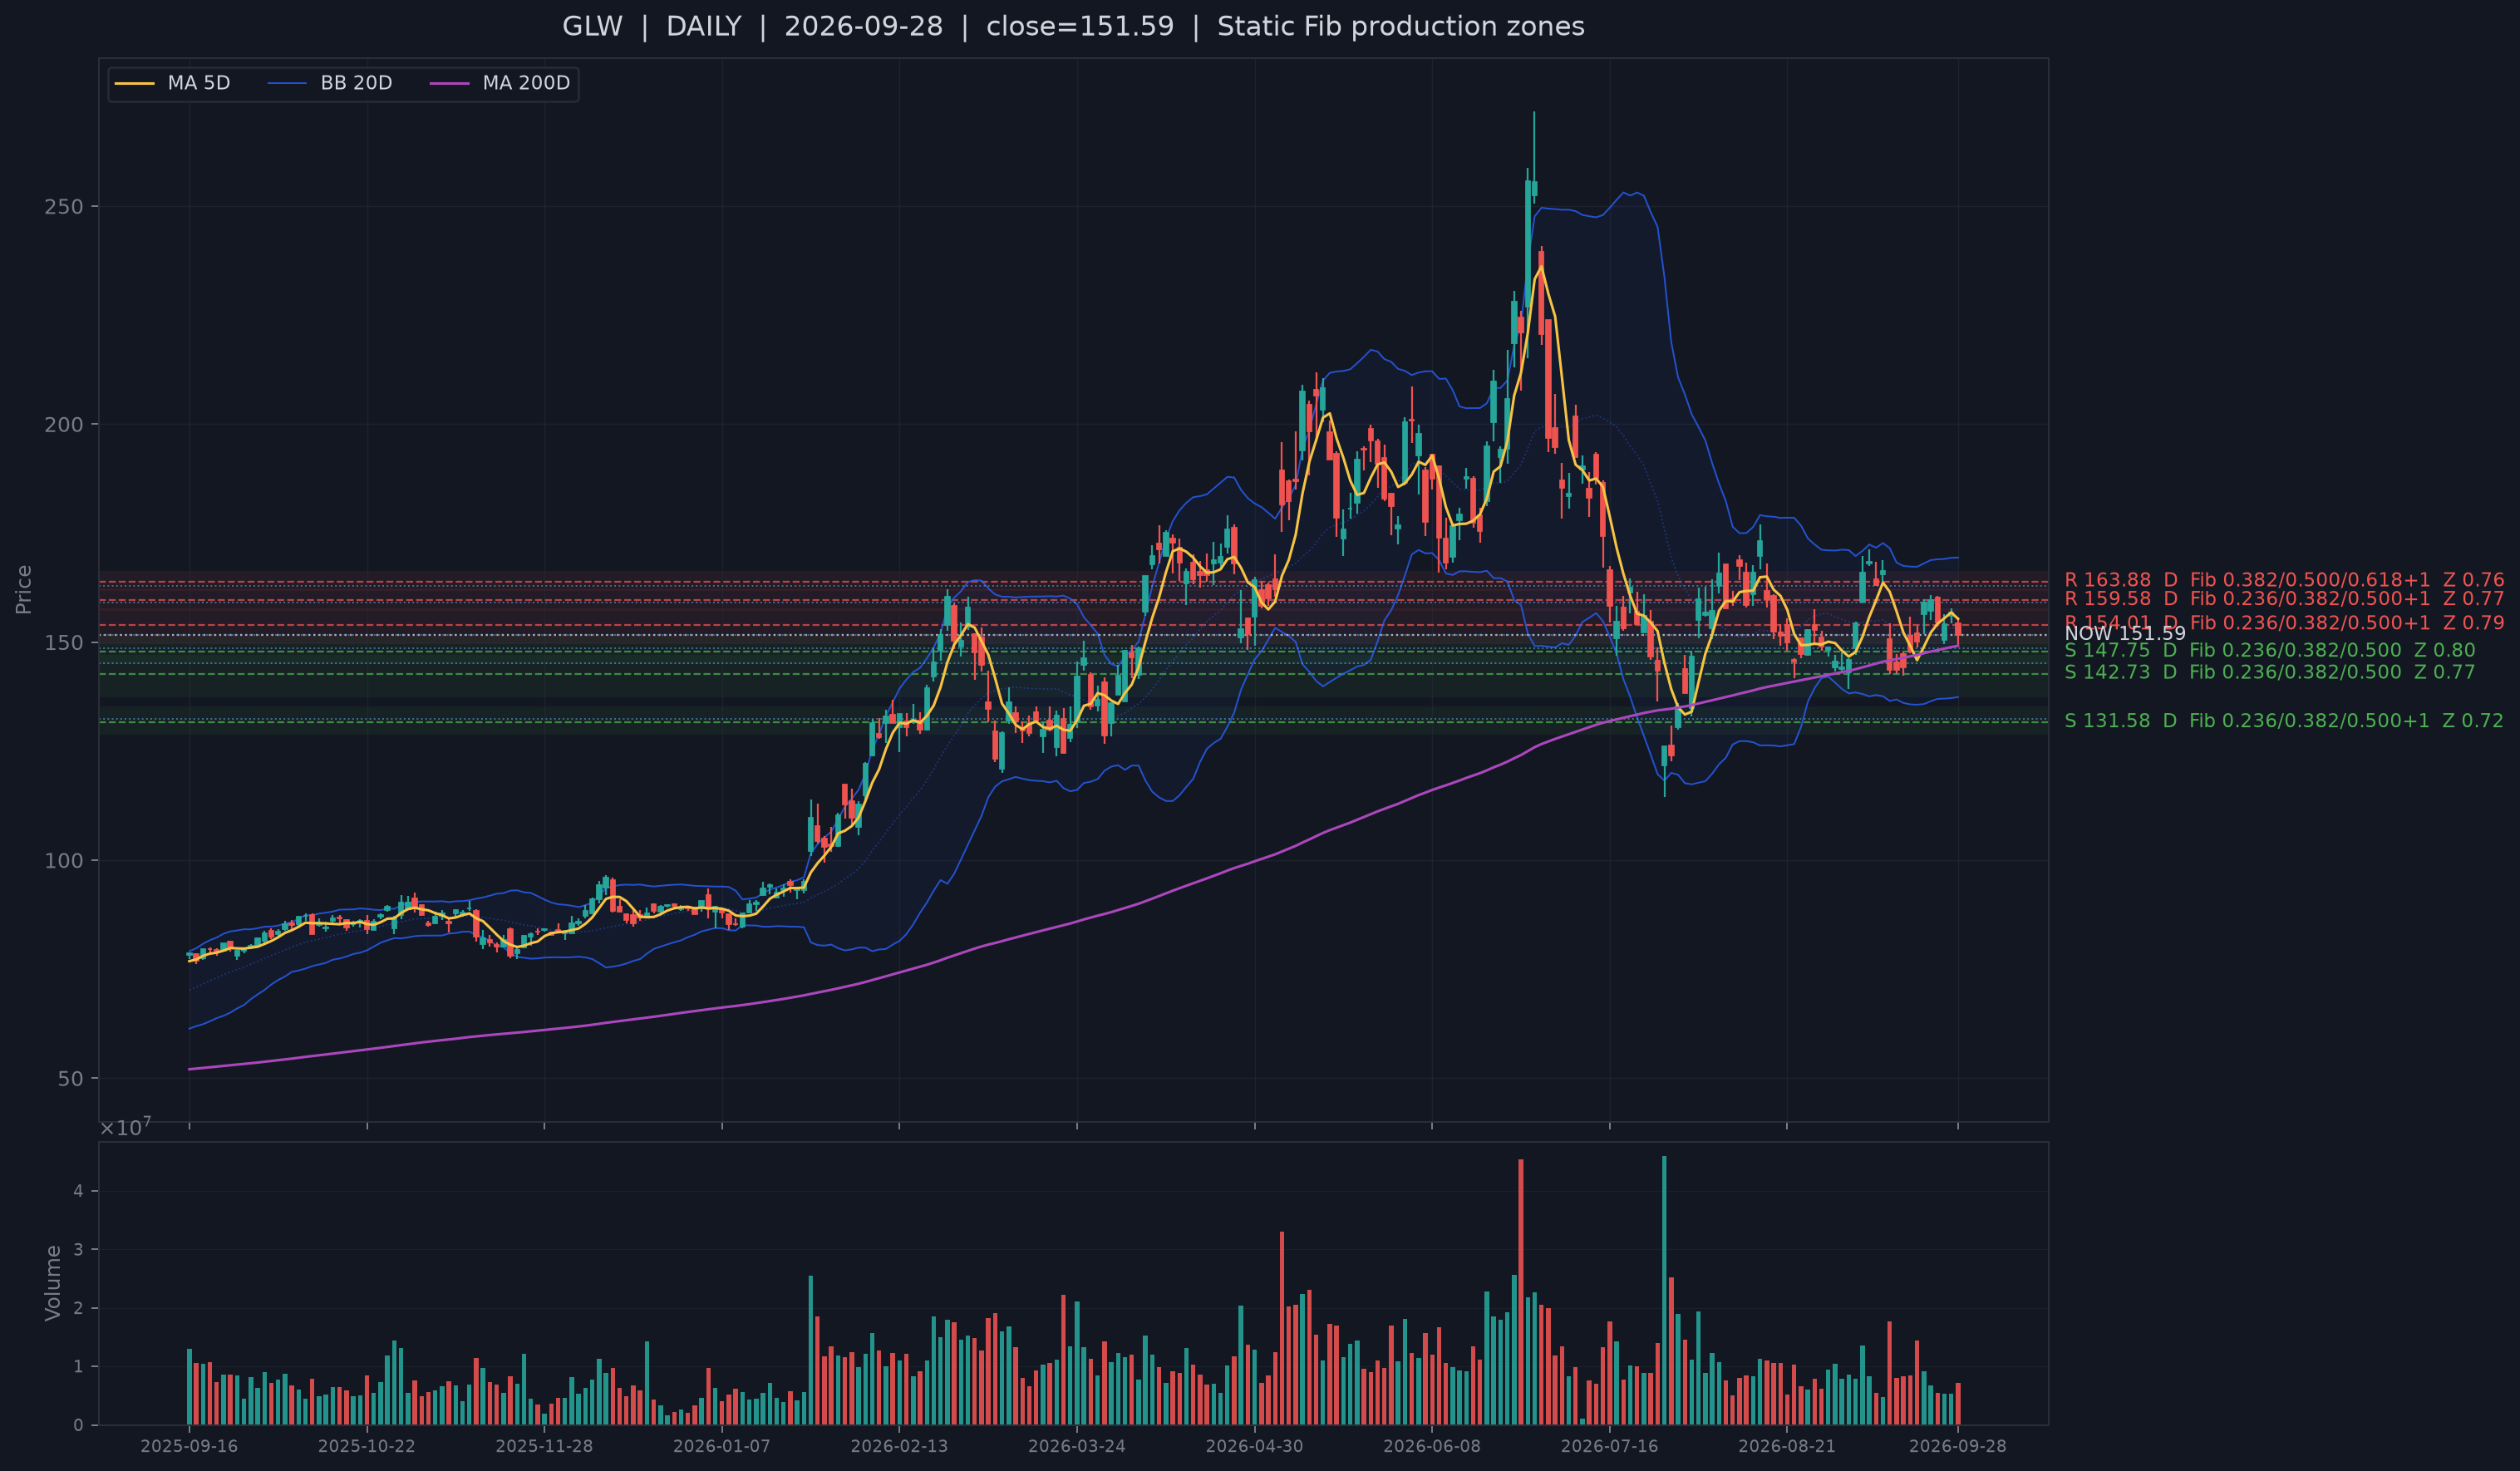
| GLW | Semiconductors & Tech Hardware | A+ Bull screen | #14 | #161 | same-day center reclaim; 1 TD ago | 2.60% / 0.48 ATR | -2.4% / -1.2% | Financial rank 0.71; delayed 13F rank 0.92 |
| VRT | Industrial Machinery, Automation & Instruments | B Bull screen | #28 | #122 | same-day center reclaim; 2 TD ago | 2.74% / 0.52 ATR | -2.0% / -3.9% | Financial rank 0.81; delayed 13F rank 0.89 |
| PYPL | Credit & Mortgage Finance | B Bull screen | #29 | #43 | wick then next-day center reclaim; 2 TD ago | 1.96% / 0.60 ATR | +1.5% / +1.5% | Financial rank 0.39; delayed 13F rank 0.16 |
| ASTS | Semiconductors & Tech Hardware | A+ Bull screen | #9 | #152 | same-day center reclaim; 2 TD ago | 4.77% / 0.70 ATR | -0.8% / +0.1% | Financial rank 0.02; delayed 13F rank 0.66 |
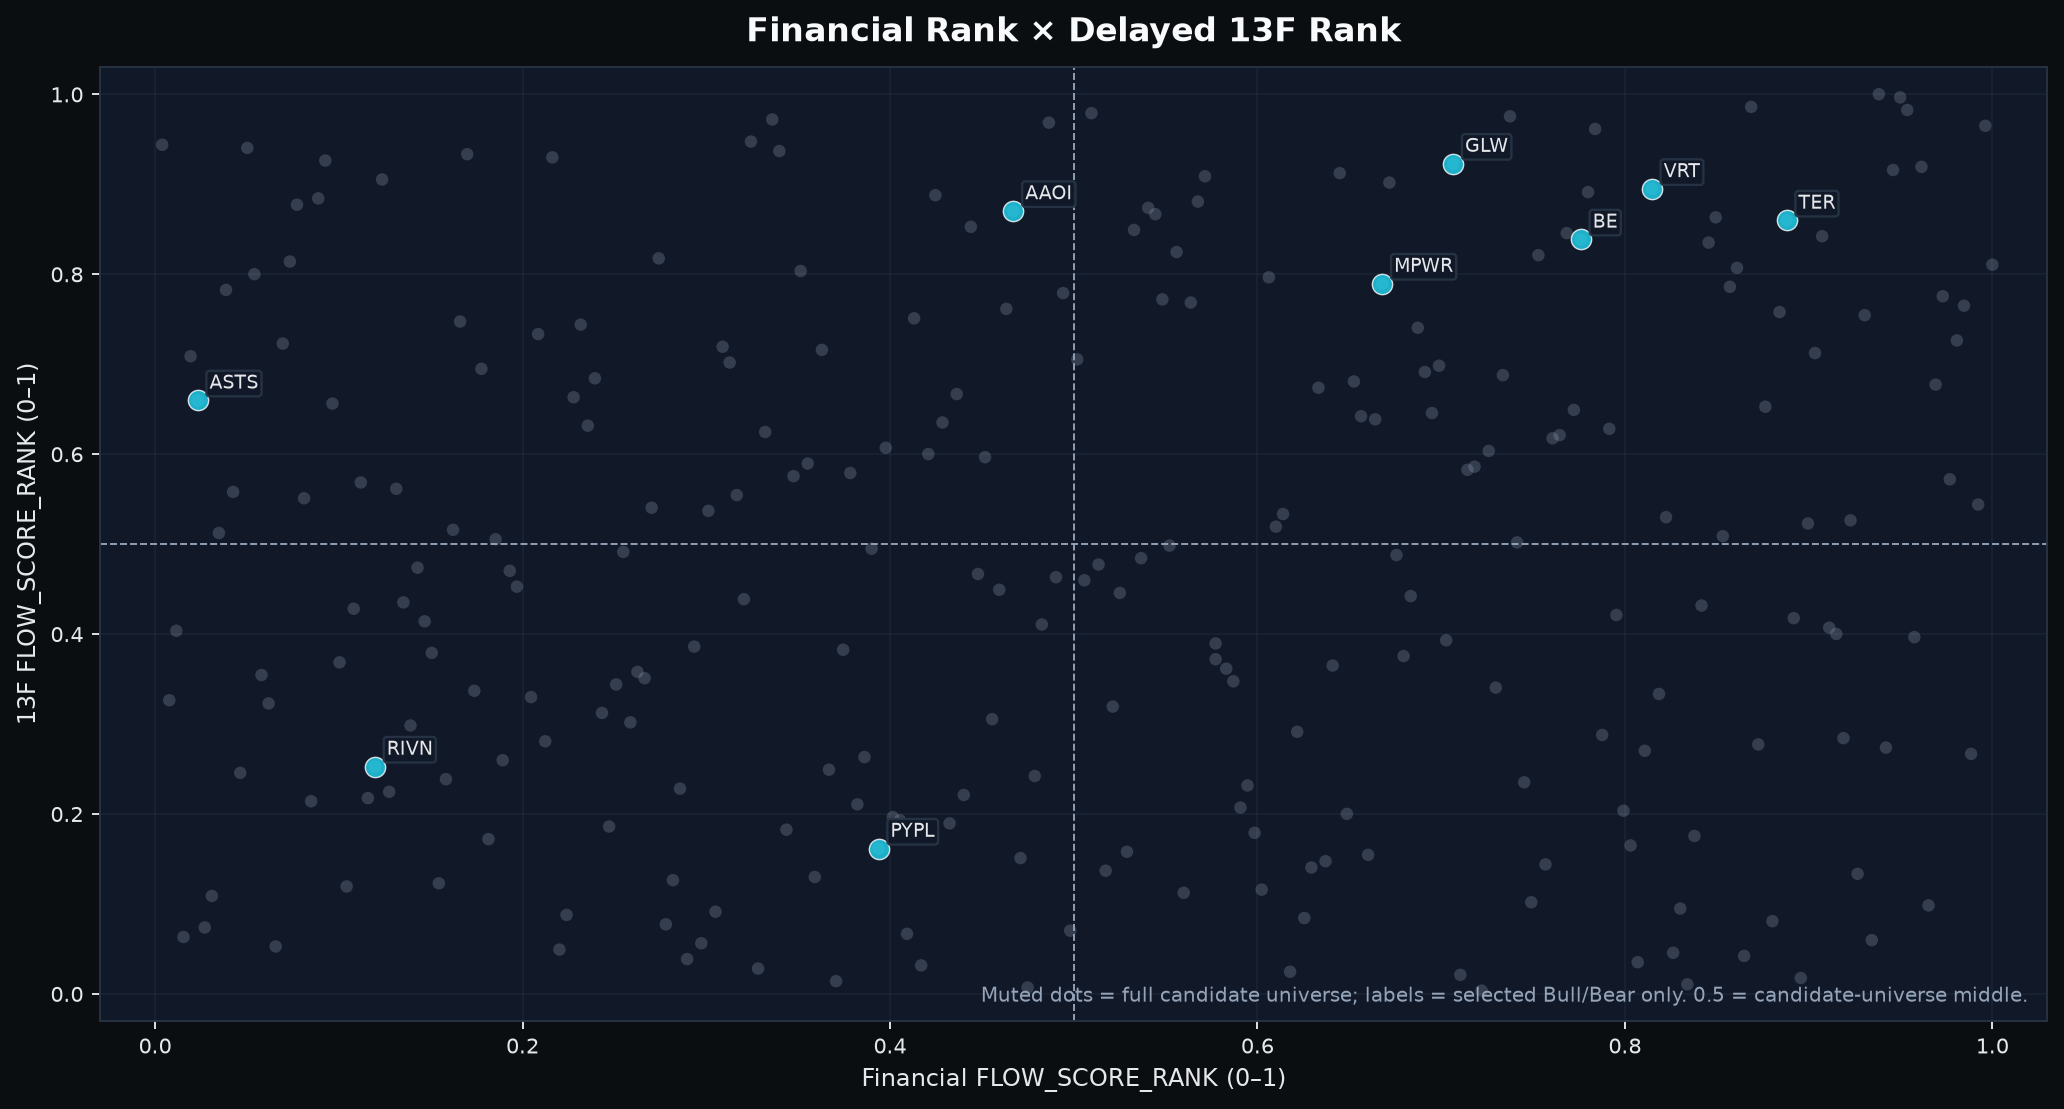
The quantitative screen fixes the ten-name selection order above; public research does not add, remove or rerank them. The most useful way to read the list is by contrast rather than by repeating ten mini-reports.
Closest support, very different trend quality: AAOI versus TER
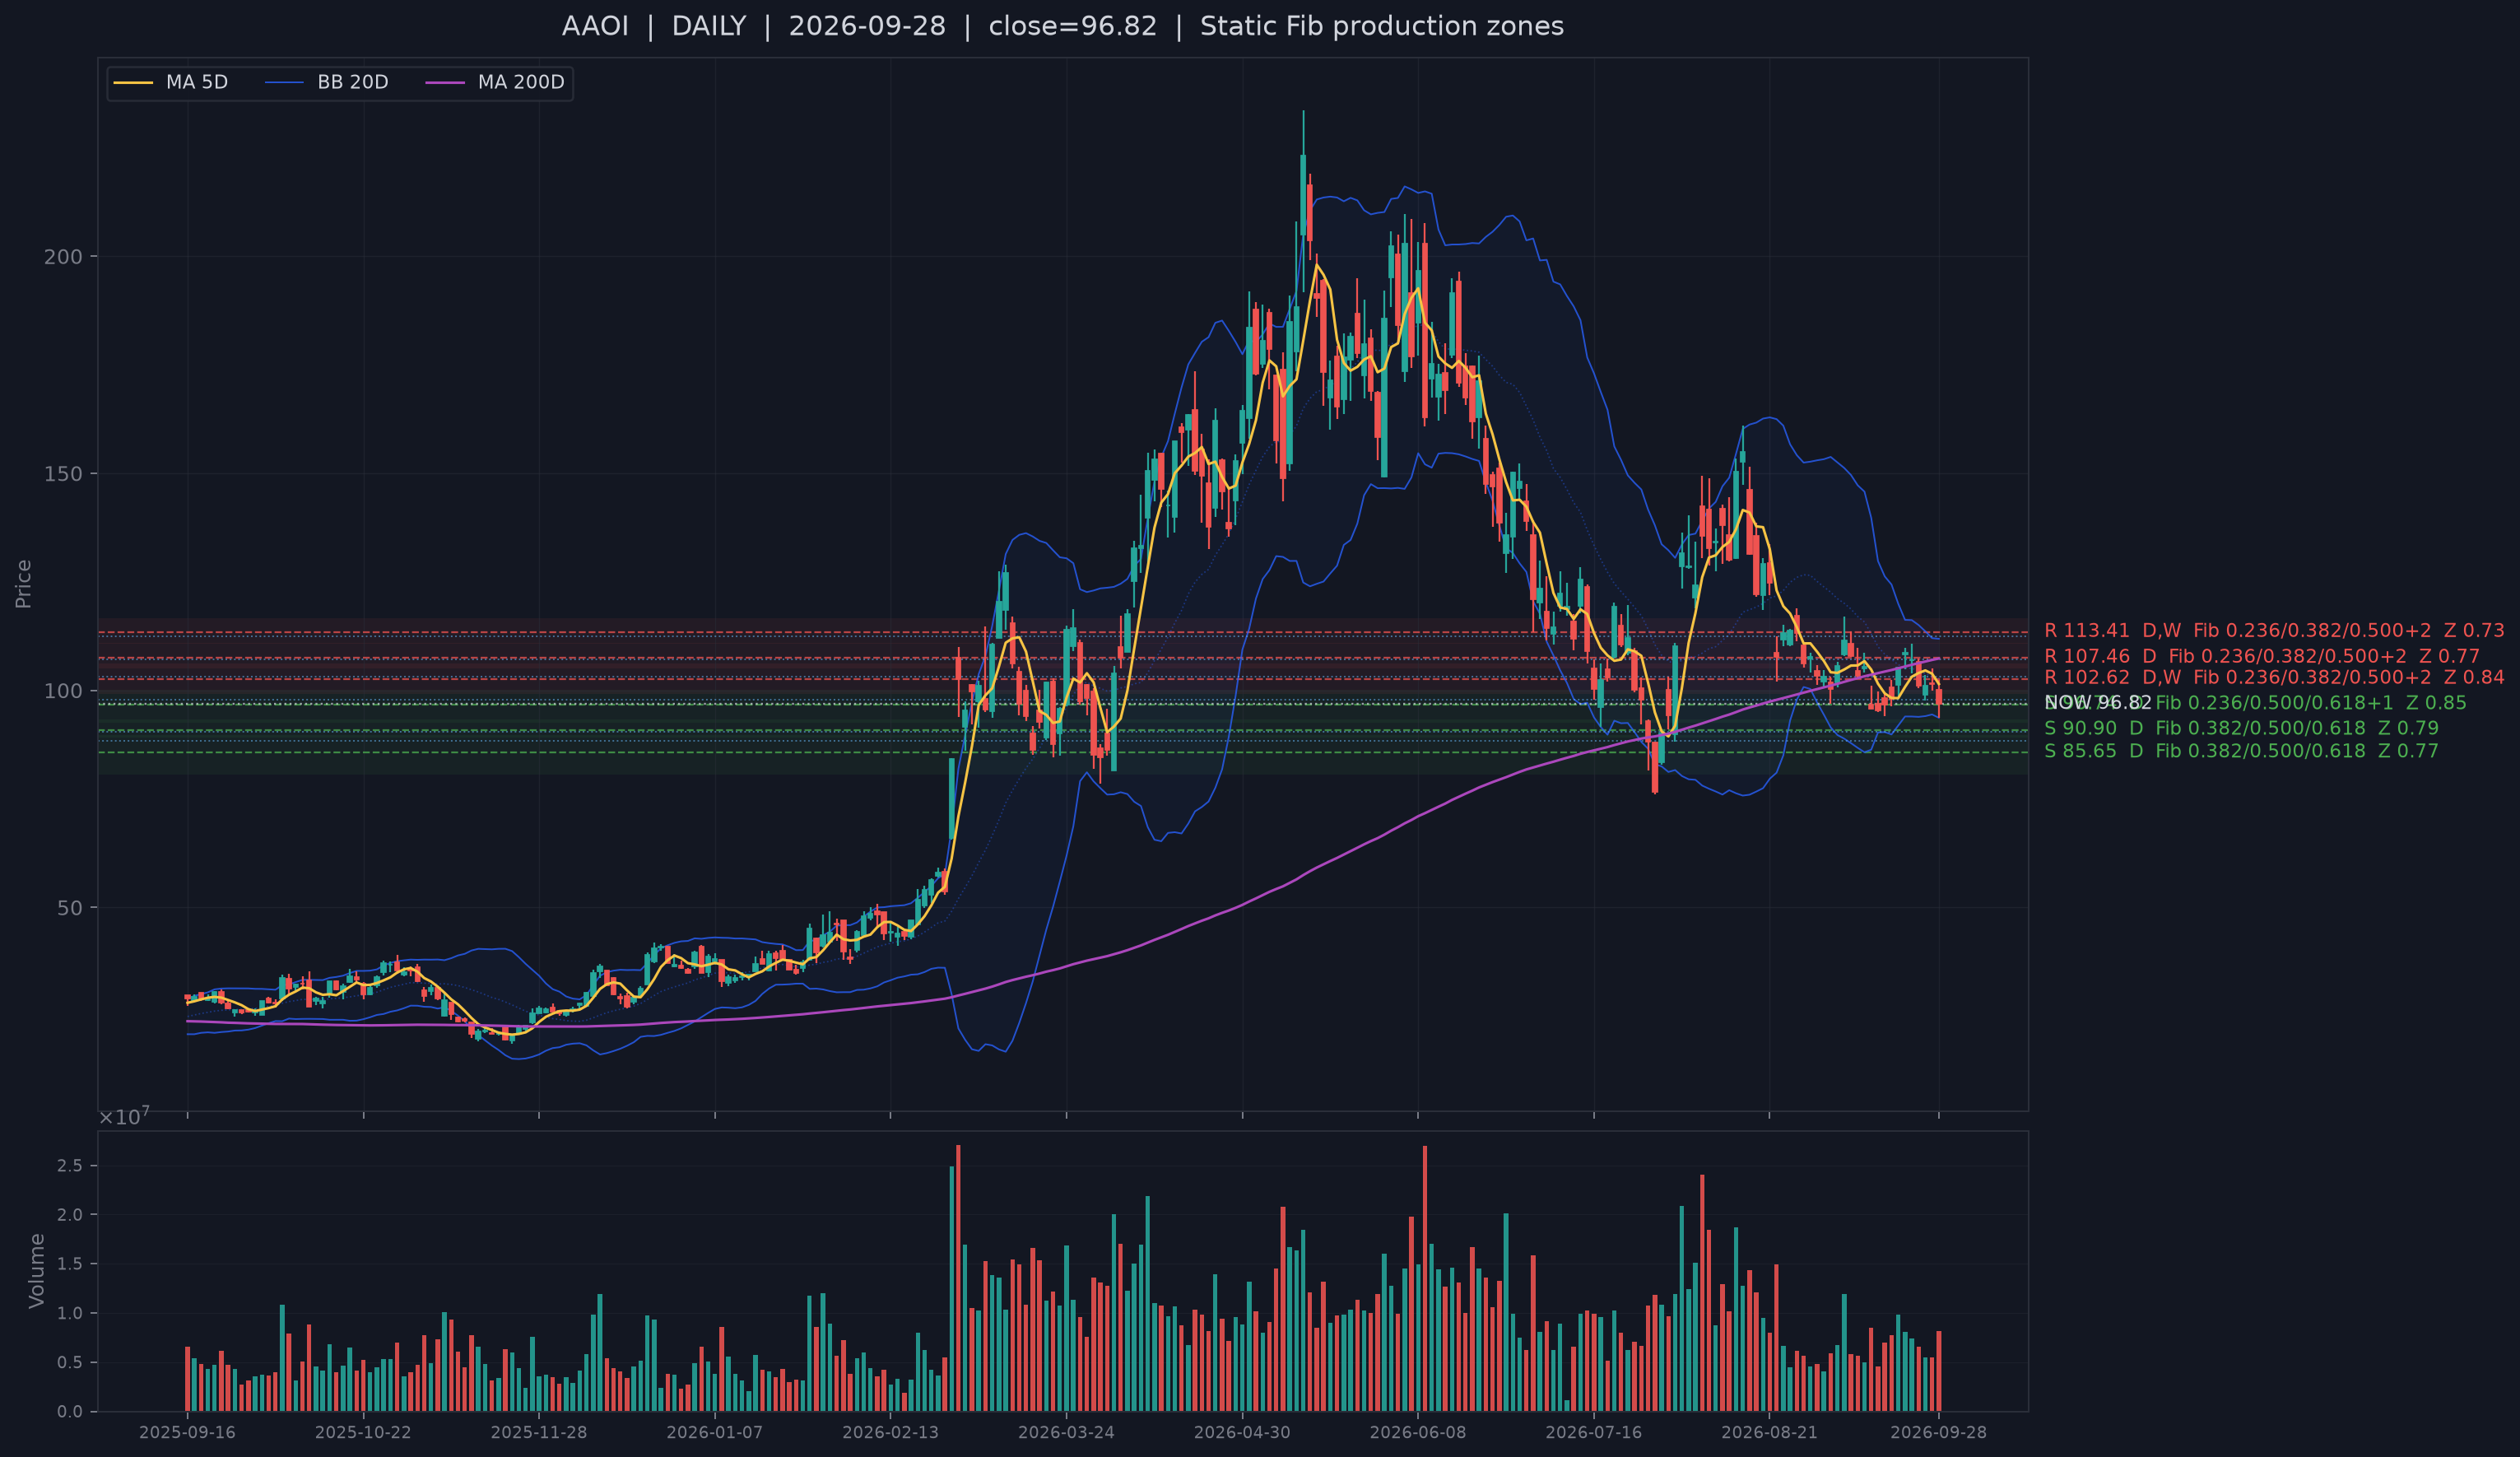
AAOI is almost exactly on live structural support - only 0.01 ATR away - but price is 4.6% below MA5 and 5.8% below MA20. The slower layer is much stronger than the current chart, especially the delayed holdings rank of 0.87. AOI's September 24 optical/HFC product roadmap gives a plausible demand mechanism, but the setup still needs price repair; the public story cannot substitute for it.
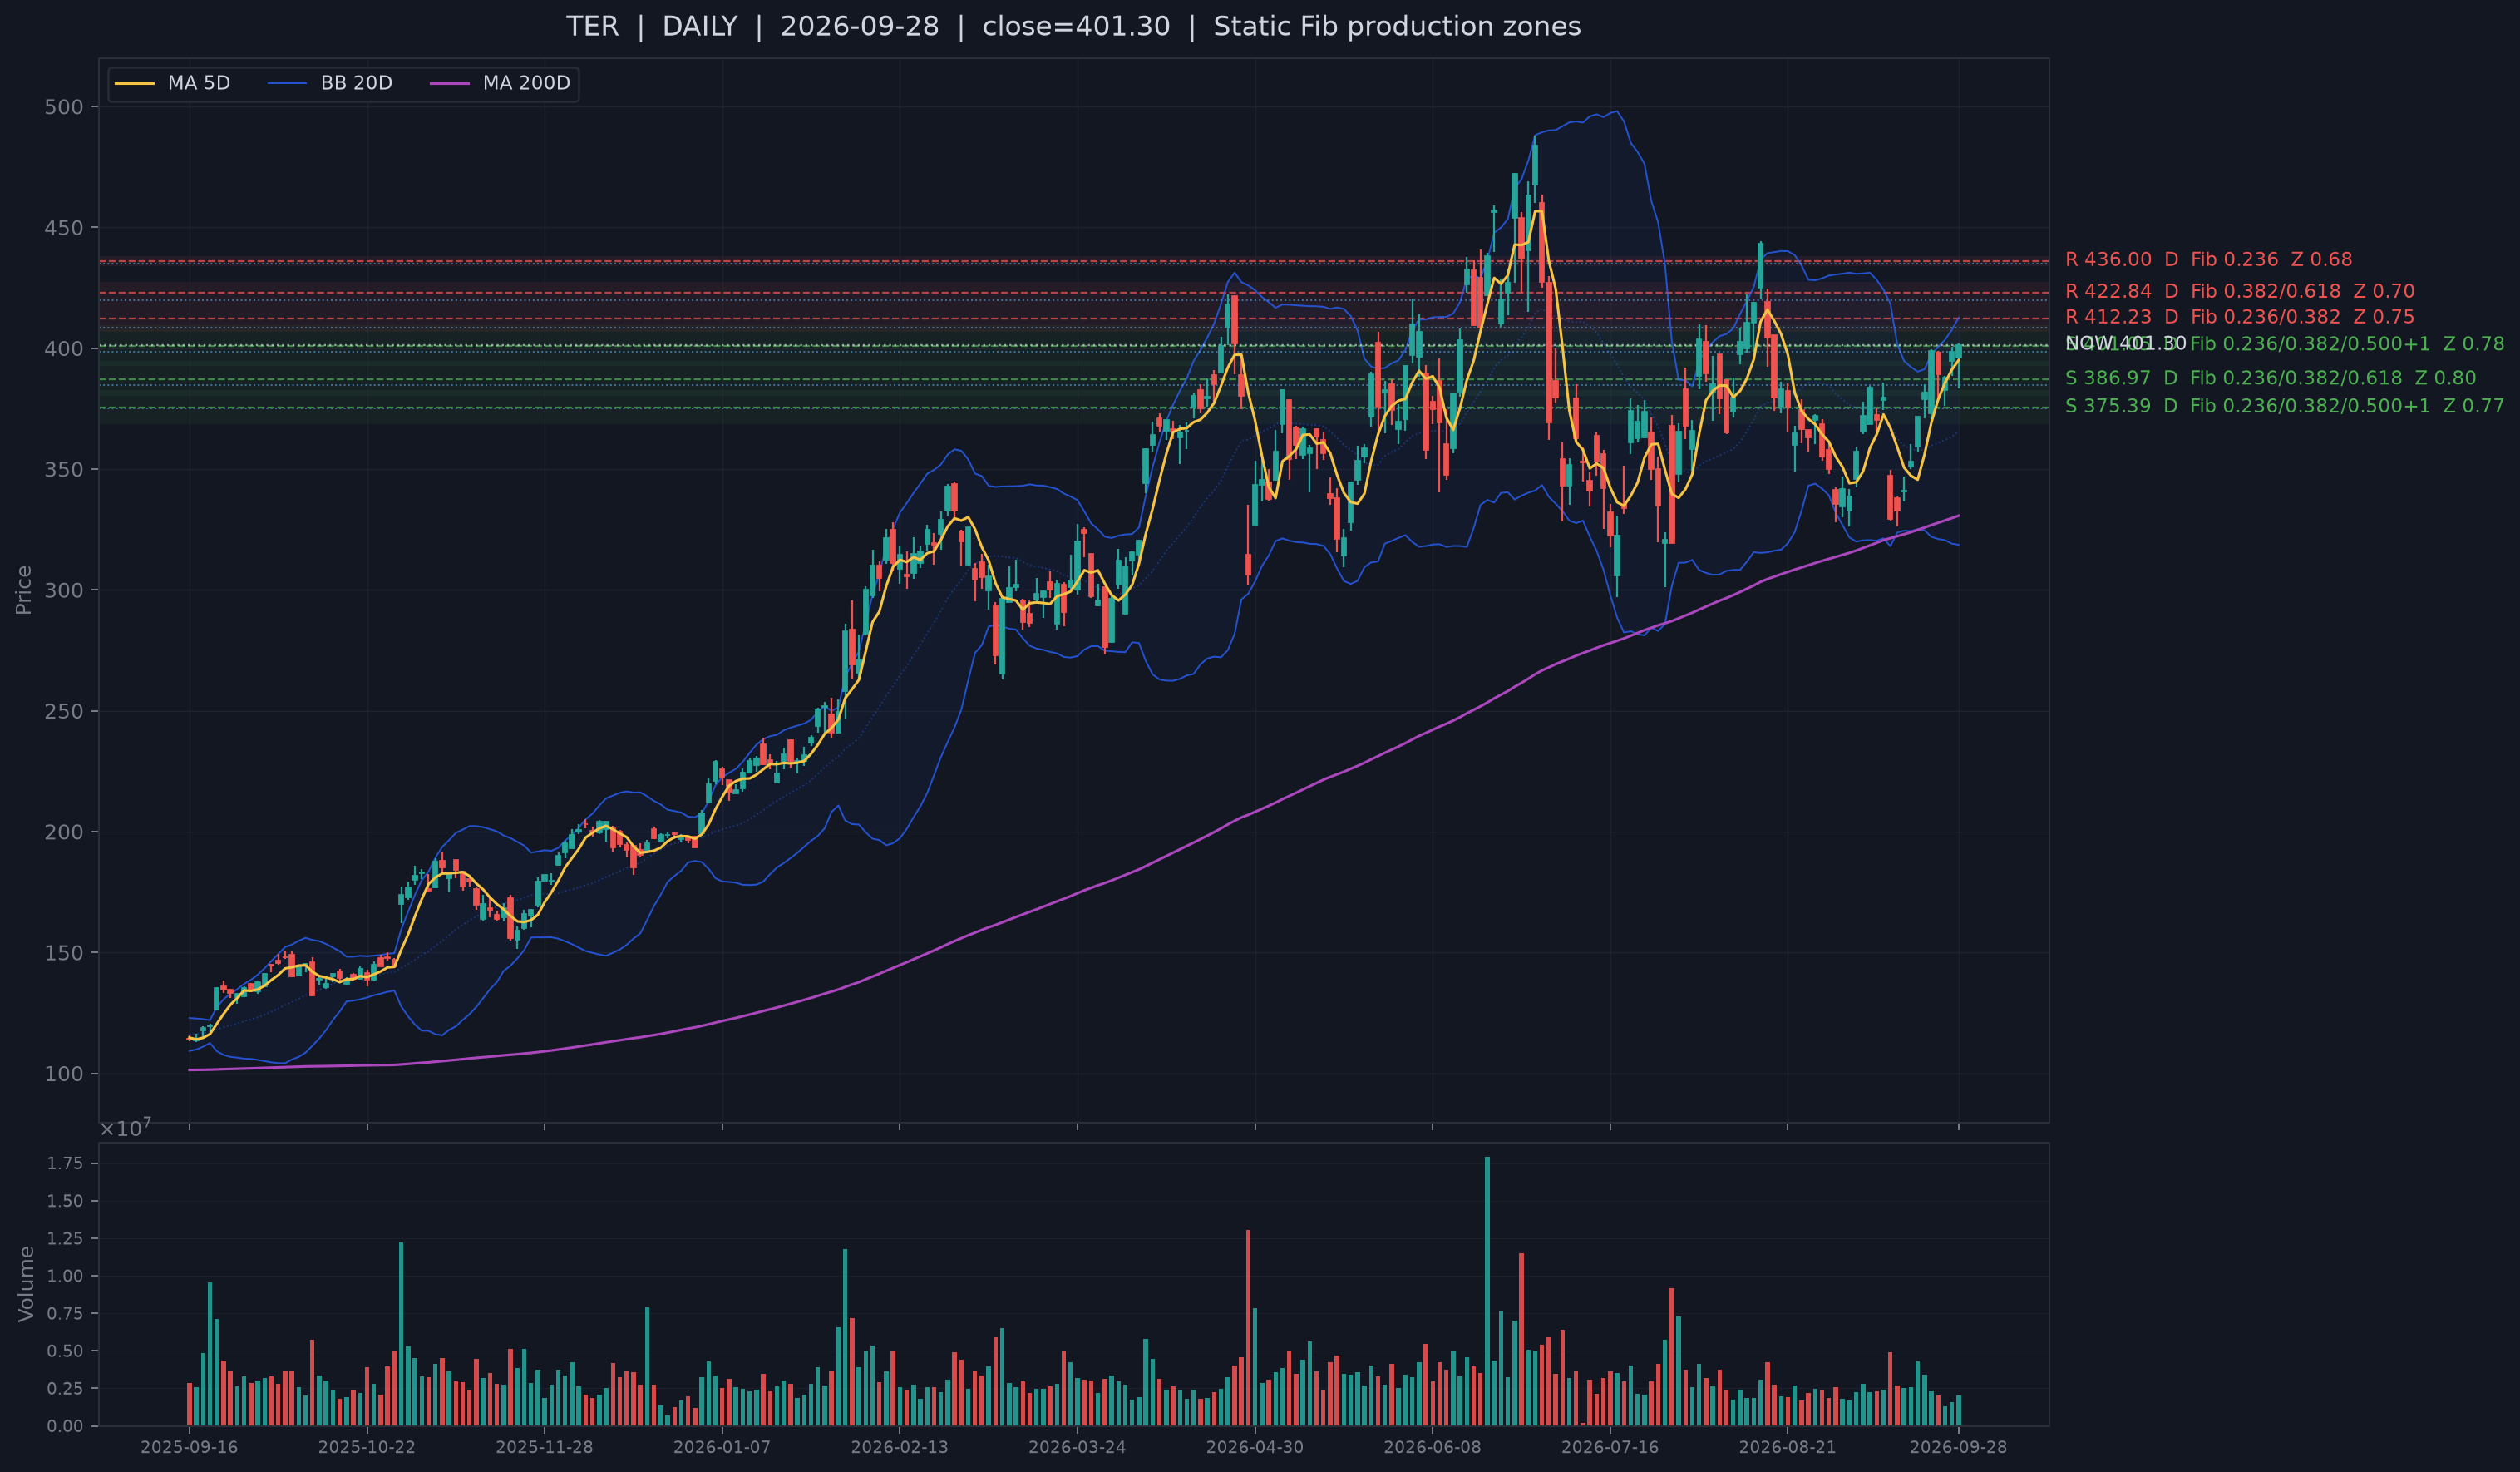
TER is the cleaner transmission control. It is also only about 0.01 ATR from live support, but price is 1.6% above MA5 and 9.8% above MA20, with Financial and delayed-holdings ranks near 0.89 and 0.86. Teradyne's recent AI/data-center optical and semiconductor test products fit the sector mechanism. The counterevidence is market-level rather than company-specific: even clean individual transmission is vulnerable if the deeply weak market microstructure fails to repair.
AI infrastructure: strong mechanisms do not guarantee completed price repair
MPWR retains a strong MA20 trend (+8.6%) and supportive slow context, while BE is only modestly above MA20 and VRT is 3.9% below it. Bloom's 800V DC-native data-center power architecture and Vertiv's expansion of high-density liquid-cooling services explain why the Industrial group can rank well economically. But the different price states are the point: a shared AI-infrastructure mechanism is not the same thing as shared chart confirmation.
Price controls: RIVN and GLW show why support confirmation is not trend confirmation
RIVN sits near support but remains below both MA5 and MA20, with weak Financial and delayed-holdings ranks. RivianOS 2 strengthens the software-defined vehicle mechanism, but the setup still needs a price reclaim. GLW has much stronger slow context - Financial 0.71 and delayed holdings 0.92 - yet it is still slightly below MA20. Its Q2 optical-communications growth gives a credible AI-connectivity mechanism, but again the chart has not fully caught up.
Non-comparable slower context must stay non-comparable
BMNR is above MA20 but lacks comparable Financial and delayed-13F percentile ranks. The official-filing fallback instead shows extraordinary revenue growth alongside deeply negative CFO and FCF margins, while the 41.4% institutional-ownership snapshot is a display-only, non-comparable fallback - not a replacement 13F flow rank. BitMine's reported ETH holdings explain the crypto-sensitive balance-sheet mechanism, but they do not resolve cash-flow quality.
PYPL is the opposite kind of control: price is above both MA5 and MA20, but slower Financial and delayed-holdings ranks are weak. ASTS has only a thin MA20 cushion and a very weak Financial rank but materially stronger delayed holdings. These disagreements are useful because they prevent slow context from becoming a hidden membership gate. The list is selected by the quantitative support/rank process; slower evidence only shows how much confirmation or contradiction sits behind the same support signal.
For GLW, the current price-path/risk secondary model is internally mixed: the 10-day expected-return context is positive while the energy-side recommendation is short. I therefore classify the secondary layer as NEUTRAL. It does not alter the selected list or the primary support/price conclusion.
6. Base case and falsification
Base case (3-10TD): selective leadership survives, but the market needs microstructure repair before the setup can be called broadly constructive. Semiconductors remain the strongest sector signal, with several support-confirmed names positioned for rebound if market internals stabilize. Confidence is moderate-low because breadth is weak, new-low damage is elevated and the order-flow state is unusually poor for the time of day.
What would strengthen it: early Aggressor and Alignment reclaims above 50 that persist into the afternoon; Bull-aligned breadth rising rather than only absorption improving; breadth stabilizing from 0.339; new-low damage retreating without a jump in down-3% breadth or dispersion; and the S&P/Nasdaq holding MA20. That combination would show that the final-hour repair effort was the start of state repair rather than a temporary absorption episode.
What would invalidate it: another session with Aggressor and Alignment trapped below neutral, a failure of MA20 in the indexes, breadth making new lows, and the currently elevated new-low damage propagating into down-3% breadth and cross-sectional volatility. The macro risk would be larger if the fresh F shock re-accelerates while positive liquidity and equity-relative R fail to transmit into price.
Sources
- Reuters, Sep. 28, 2026 - U.S. stocks fell as higher oil prices and Treasury yields weighed on risk assets.
- Applied Optoelectronics, Sep. 24 - Quantum30 3.0 GHz concept demo and HFC capacity roadmap.
- Teradyne, Sep. 21 - Iris 100 optical test platform for next-generation interconnects used in AI data-center scale-up.
- Rivian, Sep. 4 - RivianOS 2 unified software platform across R1 and R2.
- BitMine - Sep. 21 investor-relations update listing 5.98M ETH tokens and $17.1B crypto-plus-cash holdings.
- Corning, Jul. 28 - Q2 2026: Optical Communications +32%; Enterprise Networks +65%, with Gen-AI sales growing faster.
- Bloom Energy, Sep. 16 - 800V DC-native AI data-center power architecture and cost/efficiency claims.
- Vertiv, Sep. 24 - agreement to acquire King Environmental Services to expand high-density liquid-cooling services.
- CFTC - Commitments of Traders reports; September 22 positions were released September 25 and used only as lagged positioning context.