Breadth Repaired, but Late Order Flow Slipped Below Neutral as Semiconductors Reclaimed Leadership
Breadth and fresh damage repaired, but final-hour Aggressor and Alignment slipped below neutral while semiconductors reclaimed sector leadership under a still-tight price-of-money backdrop.
Horizon: 3-10 trading days.
This research is designed for 3-10 trading-day swing setups. The signals and conclusions may not transfer to intraday trading or longer-horizon investing.
Breadth Repaired, but Late Order Flow Slipped Below Neutral as Semiconductors Reclaimed Leadership
The market repaired more than it broke, but the close did not fully confirm the repair. The S&P 500 and Nasdaq both finished above MA5 and MA20, breadth improved to 0.433, and the prior new-low damage spike largely normalized. That removes the strongest immediate propagation evidence from the prior session. It does not erase the elevated warning-state memory or the high price-of-money hurdle.
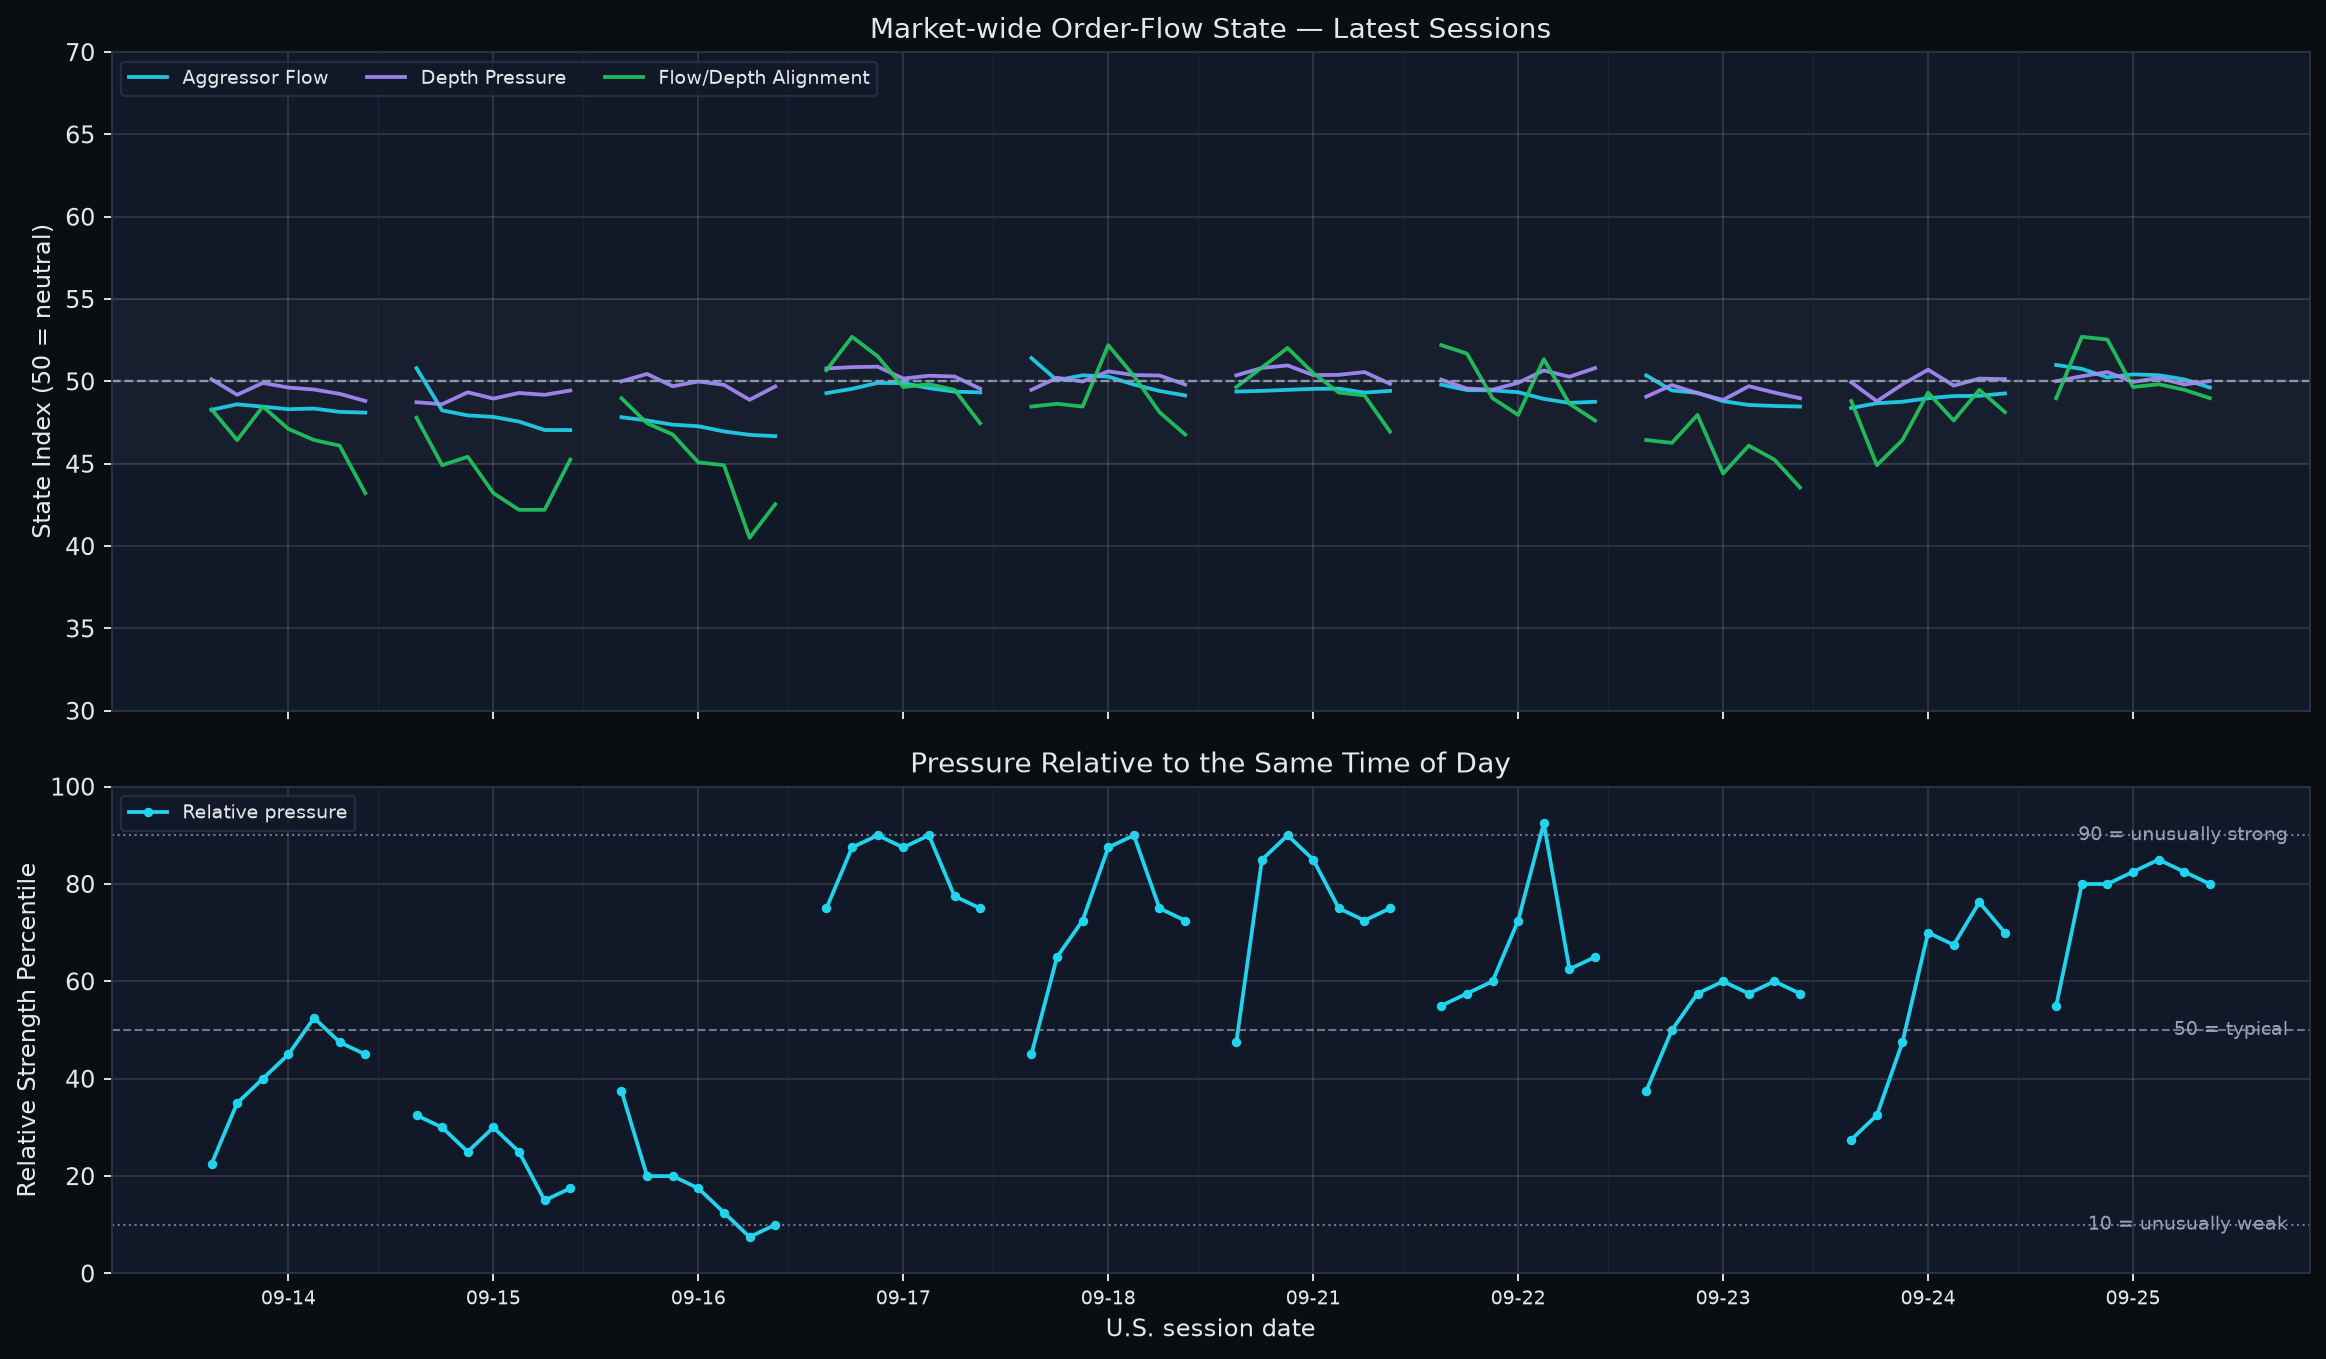
The microstructure path explains why the conclusion remains conditional. Aggressor Flow opened above neutral and Alignment reached above 52 during the morning, but all three axes deteriorated late. Depth barely held 50 at the close; Aggressor and Alignment finished below it. Final-hour aligned breadth also deteriorated. The strong counterevidence is that the close still ranked at the 80th same-time percentile and the equal-weight basket gained about 0.34% from open to close. This is late deterioration with partial state support, not a broad liquidation signal.
My base case is selective and conditionally constructive, with a high confirmation burden. Semiconductors reclaimed the #1 Bull-sector rank and Internet/Media moved to #2, but four of the Bull Top 5 sectors are also high on the Bear-risk side. Macro conditions are equally mixed: price-of-money pressure remains very tight and the current five-day shock is still positive, while liquidity quantity is supportive and cross-asset rotation does not resemble a classic long-Treasury/credit safety flight. The next session needs sustained Aggressor/Alignment reclaims with breadth confirmation, not simply another strong opening hour.
How to read today's indicators
| Indicator | Reader scale | Interpretation |
|---|---|---|
| Market-wide order-flow state | Three component indices; 50 = neutral | Aggressor Flow, Depth Pressure and Flow/Depth Alignment answer different questions. Read confirmation/divergence; they are not probabilities. |
| Same-time order-flow percentile | 0-100; 50 = same-time historical median | 90 is unusually strong and 10 unusually weak for that intraday slot. Historical context, not event probability. |
| Flow × depth state breadth | Cross-sectional percentages | Bull/Bear aligned show joint direction; absorption-compatible states describe divergence, not actor intent. |
| Market breadth | 0-1; practical balance ~0.50 | Above 0.50 means broader participation. Direction and slope show whether participation is improving or fading. |
| z-score | 0 = historical mean | |z| ~1 is notable and |z| ~2 unusual. Standardized distance, not probability. |
| Historical percentile | 0-100; 50 = median | 90+ is historically elevated. A percentile is not event probability. |
| FLOW_SCORE_RANK | 0-1; 0.50 = median | 0.80+ is relatively strong slow context. Confirmation/context, not a standalone entry signal. |
| Financial / 13F price divergence | Approx. -1 to +1; 0 = little gap | Positive means slow context is ahead of price; negative means price is ahead. Reader bands are descriptive, not learned thresholds. |
| Expected next-session range | Non-directional high-low amplitude | Pair raw estimate with its same-day cross-sectional percentile. It is not an upside target. |
1. Price, breadth and damage: participation repaired and fresh damage normalized
| Layer | Current reading | Interpretation |
|---|---|---|
| S&P 500 | +0.09% vs MA5; +0.92% vs MA20 | Medium-term price trend remains intact. |
| Nasdaq Composite | +0.02% vs MA5; +2.21% vs MA20 | Stronger trend cushion than the S&P. |
| Breadth | 0.433; 5TD change +0.048 | Still below 0.50, but participation is improving rather than deteriorating. |
| Fresh downside damage | 20D new-low z -0.14; 252D new-low z -0.08 | Down-3% z -0.73 and cross-sectional vol z -1.12: current liquidation evidence is subdued. |
| Warning memory | Structural-watch percentile 98.8; systemic-warning 94.0 | Historical warning configurations remain active; percentiles are not crash probabilities. |
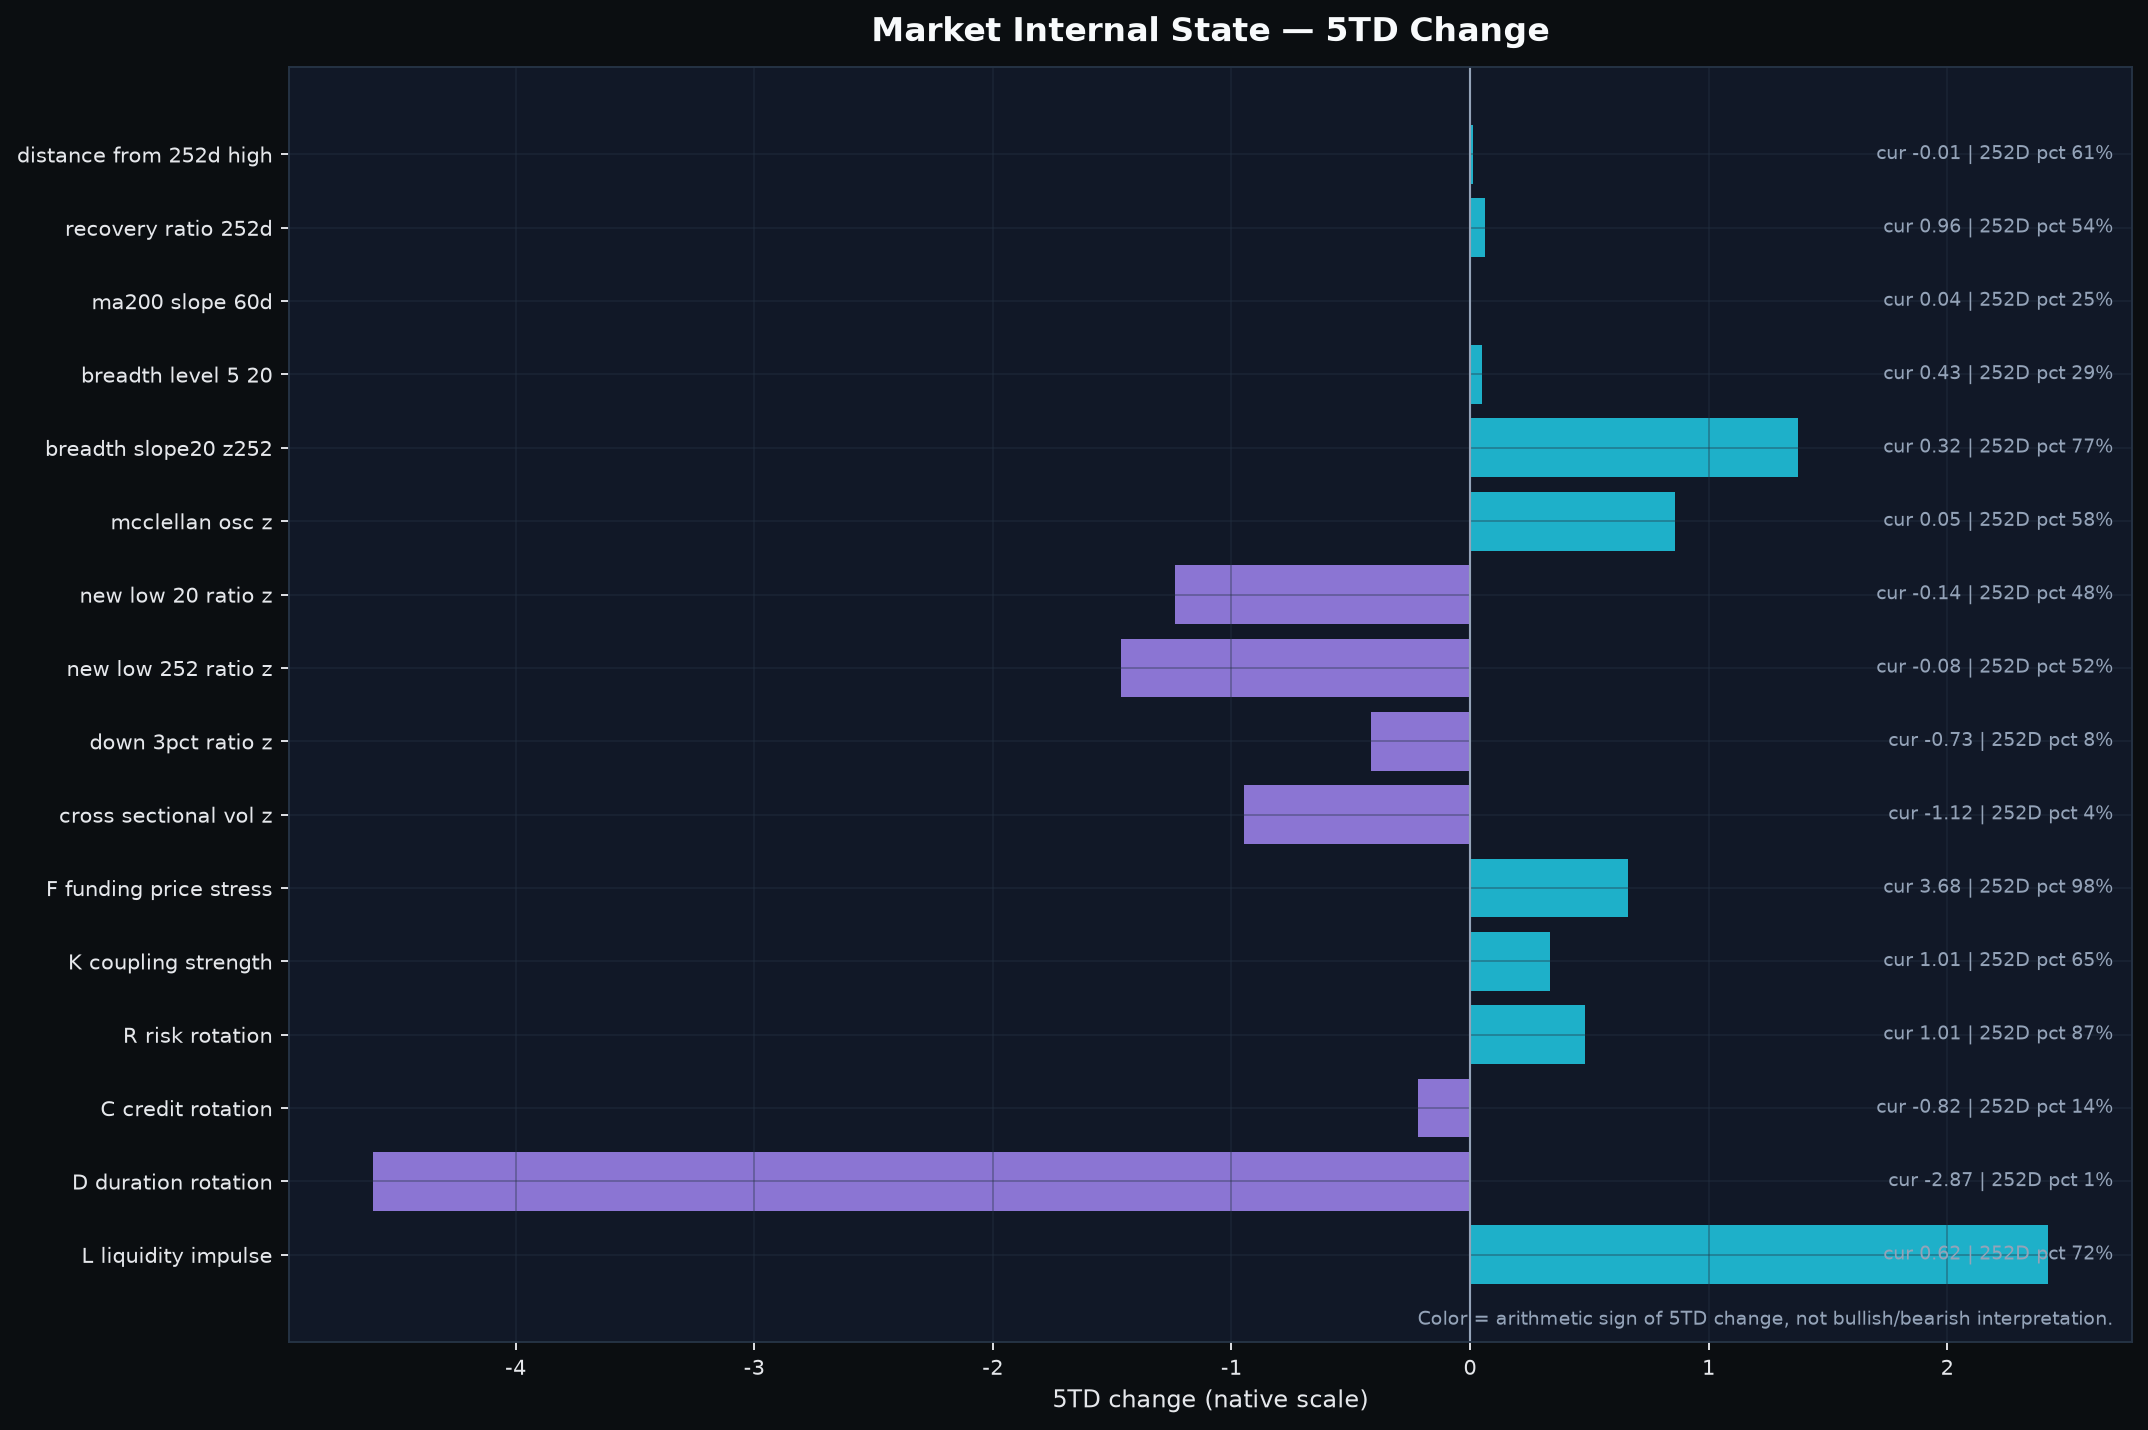
The day-to-day change is meaningful. Breadth rose to 0.433 and the prior session's new-low damage spike did not persist in the current daily readings. That makes a synchronized liquidation thesis harder to defend. At the same time, participation remains below balance and the frozen systemic/structural warning states are still elevated, so one repaired session is not enough to declare a durable broadening.
The falsifier is straightforward: if breadth turns lower again while new-low, large-decline and dispersion measures re-expand, then today's repair was temporary. A move toward 0.50 breadth with quiet damage would strengthen the selective constructive case.
2. Order flow: morning strength gave way to a bearish final-hour breadth read
| Time | Aggressor Flow | Depth Pressure | Alignment | Same-time pct. | Bull aligned | Bear aligned | Buy absorption | Sell absorption | EW bar response |
|---|---|---|---|---|---|---|---|---|---|
| 09:30 | 51.00 | 50.01 | 48.98 | 55.0 | 15.3% | 17.3% | 16.6% | 15.9% | -0.27% |
| 10:30 | 50.77 | 50.32 | 52.71 | 80.0 | 16.9% | 11.5% | 17.6% | 16.6% | +0.16% |
| 11:30 | 50.25 | 50.57 | 52.54 | 80.0 | 20.0% | 14.9% | 13.2% | 14.9% | +0.43% |
| 12:30 | 50.43 | 49.97 | 49.66 | 82.5 | 15.6% | 16.3% | 14.9% | 15.6% | -0.17% |
| 13:30 | 50.38 | 50.21 | 49.83 | 85.0 | 14.6% | 14.9% | 15.6% | 16.3% | -0.08% |
| 14:30 | 50.13 | 49.82 | 49.49 | 82.5 | 14.9% | 15.9% | 14.6% | 15.9% | -0.06% |
| 15:30 | 49.63 | 50.02 | 48.98 | 80.0 | 14.6% | 16.6% | 14.2% | 13.6% | +0.07% |
The morning looked materially better than the prior session. Aggressor Flow opened at 51.00 and remained above 50 through 14:30; Depth was also near or above neutral for most checkpoints. Alignment reached 52.71 at 10:30 and 52.54 at 11:30, a genuine period of joint flow/depth agreement. The repair then stalled after midday.
The final hour matters separately. Aggressor fell 0.50 points from 50.13 to 49.63, leaving a 0.37-point neutral reclaim burden. Depth improved 0.21 points to 50.02 and barely preserved neutral. Alignment fell 0.51 points to 48.98, leaving a 1.02-point reclaim burden. Breadth confirmation moved in the same bearish direction: Bull-aligned breadth fell 0.34 percentage points, Bear-aligned rose 0.68 points and Buy-absorption breadth fell 0.34 points, producing the bundle's bearish breadth deterioration final-bar read. Sell-absorption breadth also fell sharply, so the deterioration was not a simple one-state takeover.
The counterevidence is strong enough to prevent a bearish regime call. The close sat at the 80th same-time percentile and the equal-weight basket gained about 0.34% from open to close. In other words, the close was weak relative to the absolute 50-neutral scale but not unusually weak relative to its intraday history, and price breadth was constructive. The next session therefore inherits a partial-repair burden: Aggressor and Alignment need early, persistent 50 reclaims accompanied by better aligned breadth, rather than another morning burst that fades late.
3. Cross-asset conditions: tight money, positive liquidity and no classic safety flight
| Layer | Current reading | Interpretation |
|---|---|---|
| Price of money (F) | Raw +0.585 (~+58.5 bp 20TD tightening); state z +3.01 | 2Y +33.5 bp; Real10 +25 bp. Current 5D shock +1.04z; last extreme +1.94z on Sep. 24, Real10-led. |
| Liquidity (L) | State z +0.61; 5D shock +1.54z | Positive quantity impulse is a counterweight to rate pressure. |
| Relative preference (R) | 20D change +0.32 toward equities | Short Treasuries and industrial metals are positive non-equity destinations; long Treasuries/credit are not classic safety leaders. |
| Coupling (K) | Raw 0.511; 20D +0.067; PR 7.24/9 | Broad, stable common mode; risk-mode only +0.13 and equity node contribution is small. |
| CFTC positioning | Sep. 22 positions; released Sep. 25; 3TD age | Fresh under the normal weekly schedule; equity positioning supports, destination confirmation remains mixed. |
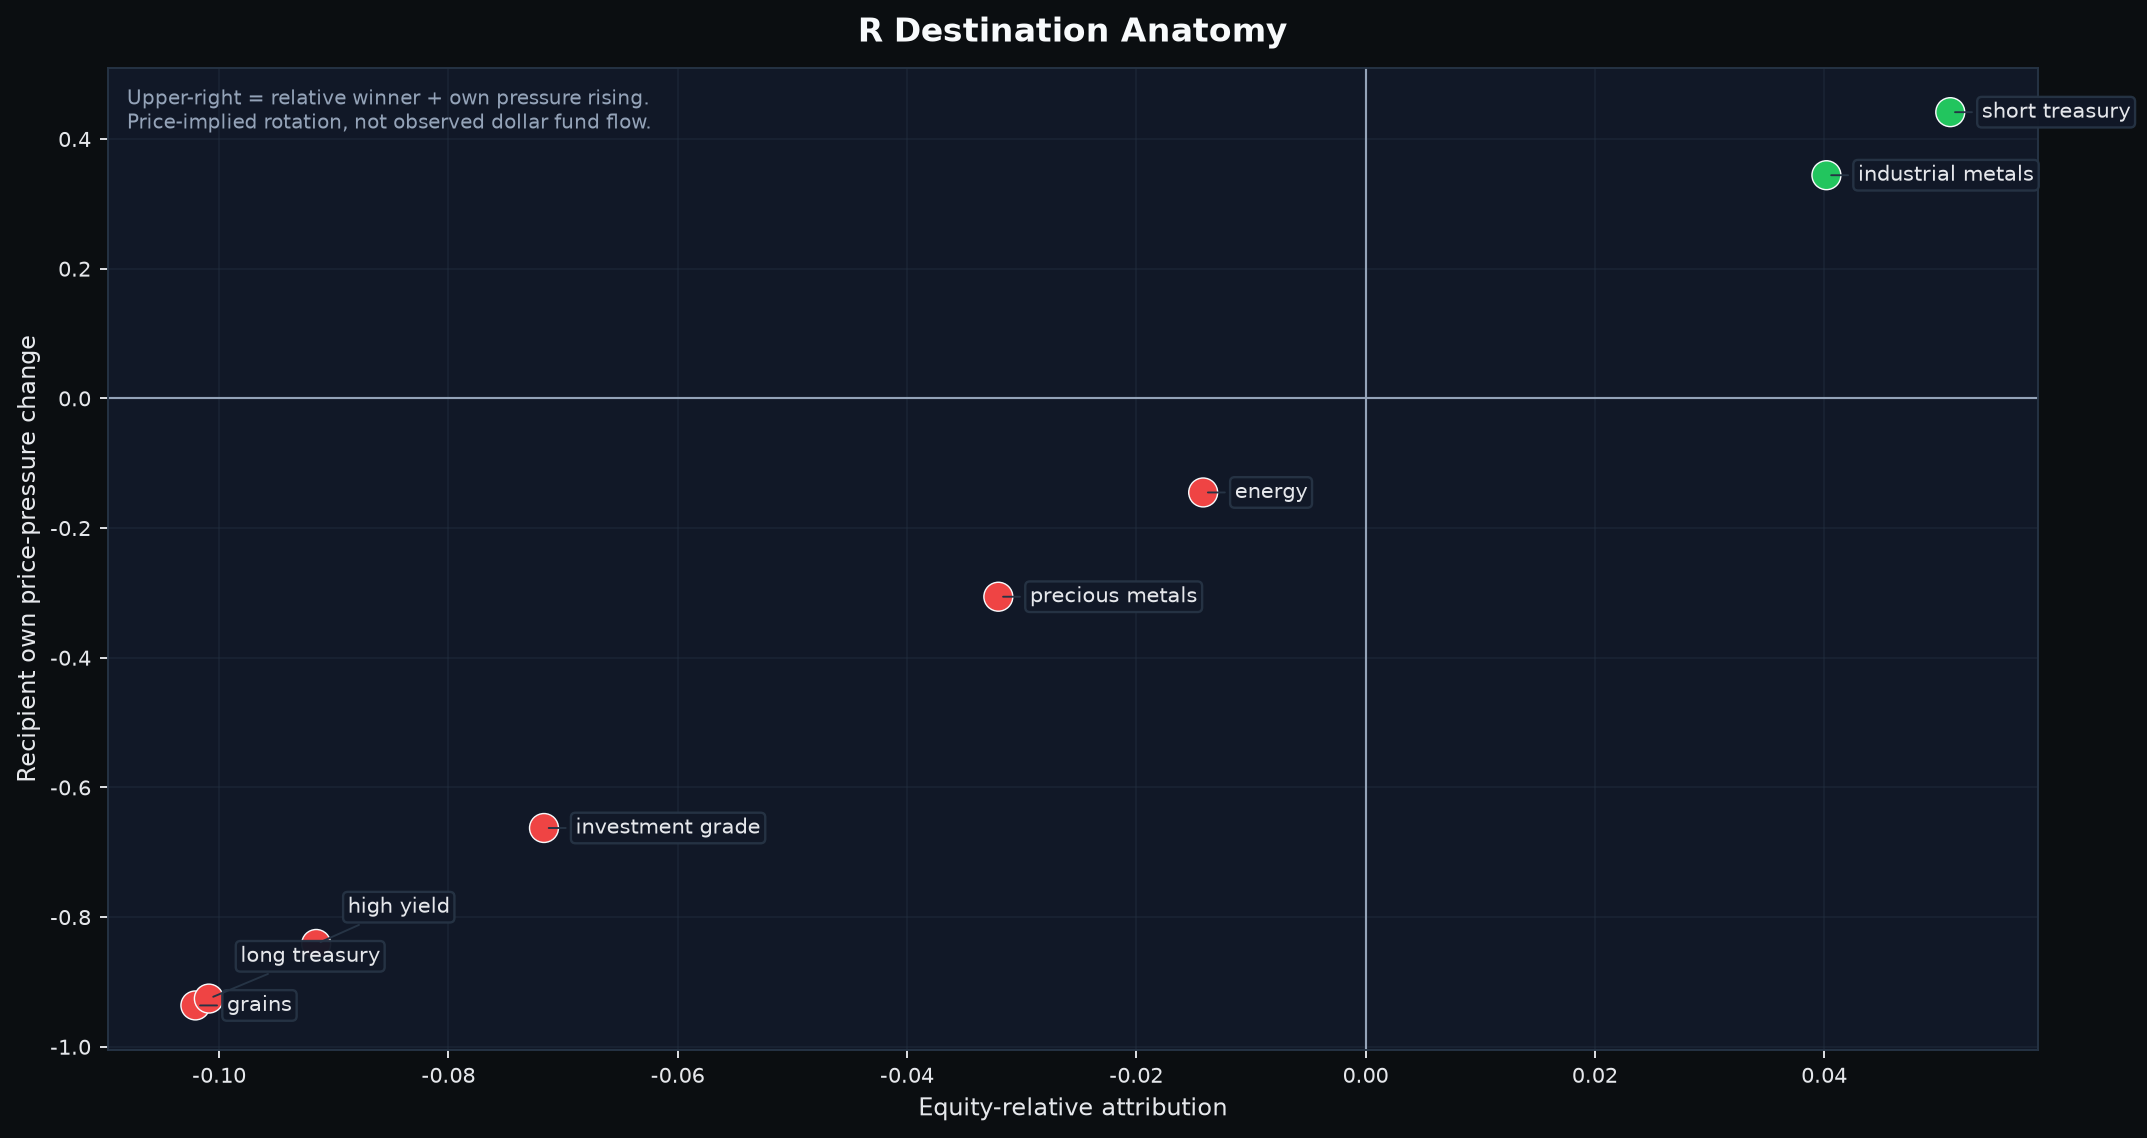
Price-of-money pressure remains the largest macro hurdle. Raw F is +0.585, roughly +58.5 bp of blended 20-trading-day tightening, split between about +33.5 bp in the 2Y component and +25 bp in the approximate 10Y real-rate component. The current five-day shock is still positive at +1.04z, and the last extreme tightening impulse was only one trading day ago at +1.94z and Real10-led. This is not a funding-plumbing crisis measure; it is persistent discount-rate pressure with a still-active recent shock. Positive liquidity quantity is the important counterweight.
R and K do not confirm a classic safety-flight story. The 20-day relative-preference change still favors equities overall, while short Treasuries and industrial metals are the positive non-equity destinations; long Treasuries, IG and HY are not. Raw K is about 0.51 and the common mode spans roughly 7.2 of 9 sleeves, with a strong eigengap and 5D stability near 1.0. But risk-mode alignment is only modest and the equity node contributed little to the 20-day rise in coupling. Higher K therefore means a broad common macro structure, not automatically equity-led risk-off.
The latest CFTC positions are dated September 22 and were released September 25, so they are current under the normal weekly COT schedule but still three trading days behind this market close. Equity Asset Managers are roughly +30.8% net long relative to open interest and increased that ratio by about 3.12 percentage points over the latest four reports; the change is +0.95z, directionally consistent with the recent equity-relative price move. Yet the active non-equity destinations do not receive broad positioning confirmation, leaving the system-level destination confirmation weak/mixed. CFTC remains a lagged confirmation layer, not a same-day veto.
4. Sector leadership: semiconductors reclaimed #1, but the Top 5 is still mostly two-sided
| Bull rank | Sector | Bear-risk rank | Balance state | Representative tickers | Public read |
|---|---|---|---|---|---|
| 1 | Semiconductors & Tech Hardware | 1 | TWO_SIDED_CONFLICT | P, INTC, AXTI, ALAB, IONQ, SNDK, TER | Two-sided leadership |
| 2 | Internet, Media & Telecom | 6 | TWO_SIDED_CONFLICT | META, NBIS, RBLX, RDDT, APP, GOOG, WBD | Two-sided leadership |
| 3 | Asset Management & Capital Markets | 3 | TWO_SIDED_CONFLICT | SCHW, BMNR, WULF, IREN, MARA, HUT, CRCL | Two-sided leadership |
| 4 | Consumer Services, Leisure & Hospitality | 13 | BULL_DOMINANT | RCL, EXPE, BKNG, ABNB, DKNG, MCD, HLT | Bull-dominant |
| 5 | Enterprise Software & IT Services | 4 | TWO_SIDED_CONFLICT | INTU, ADBE, TEAM, AKAM, SNPS, NET, APLD | Two-sided leadership |
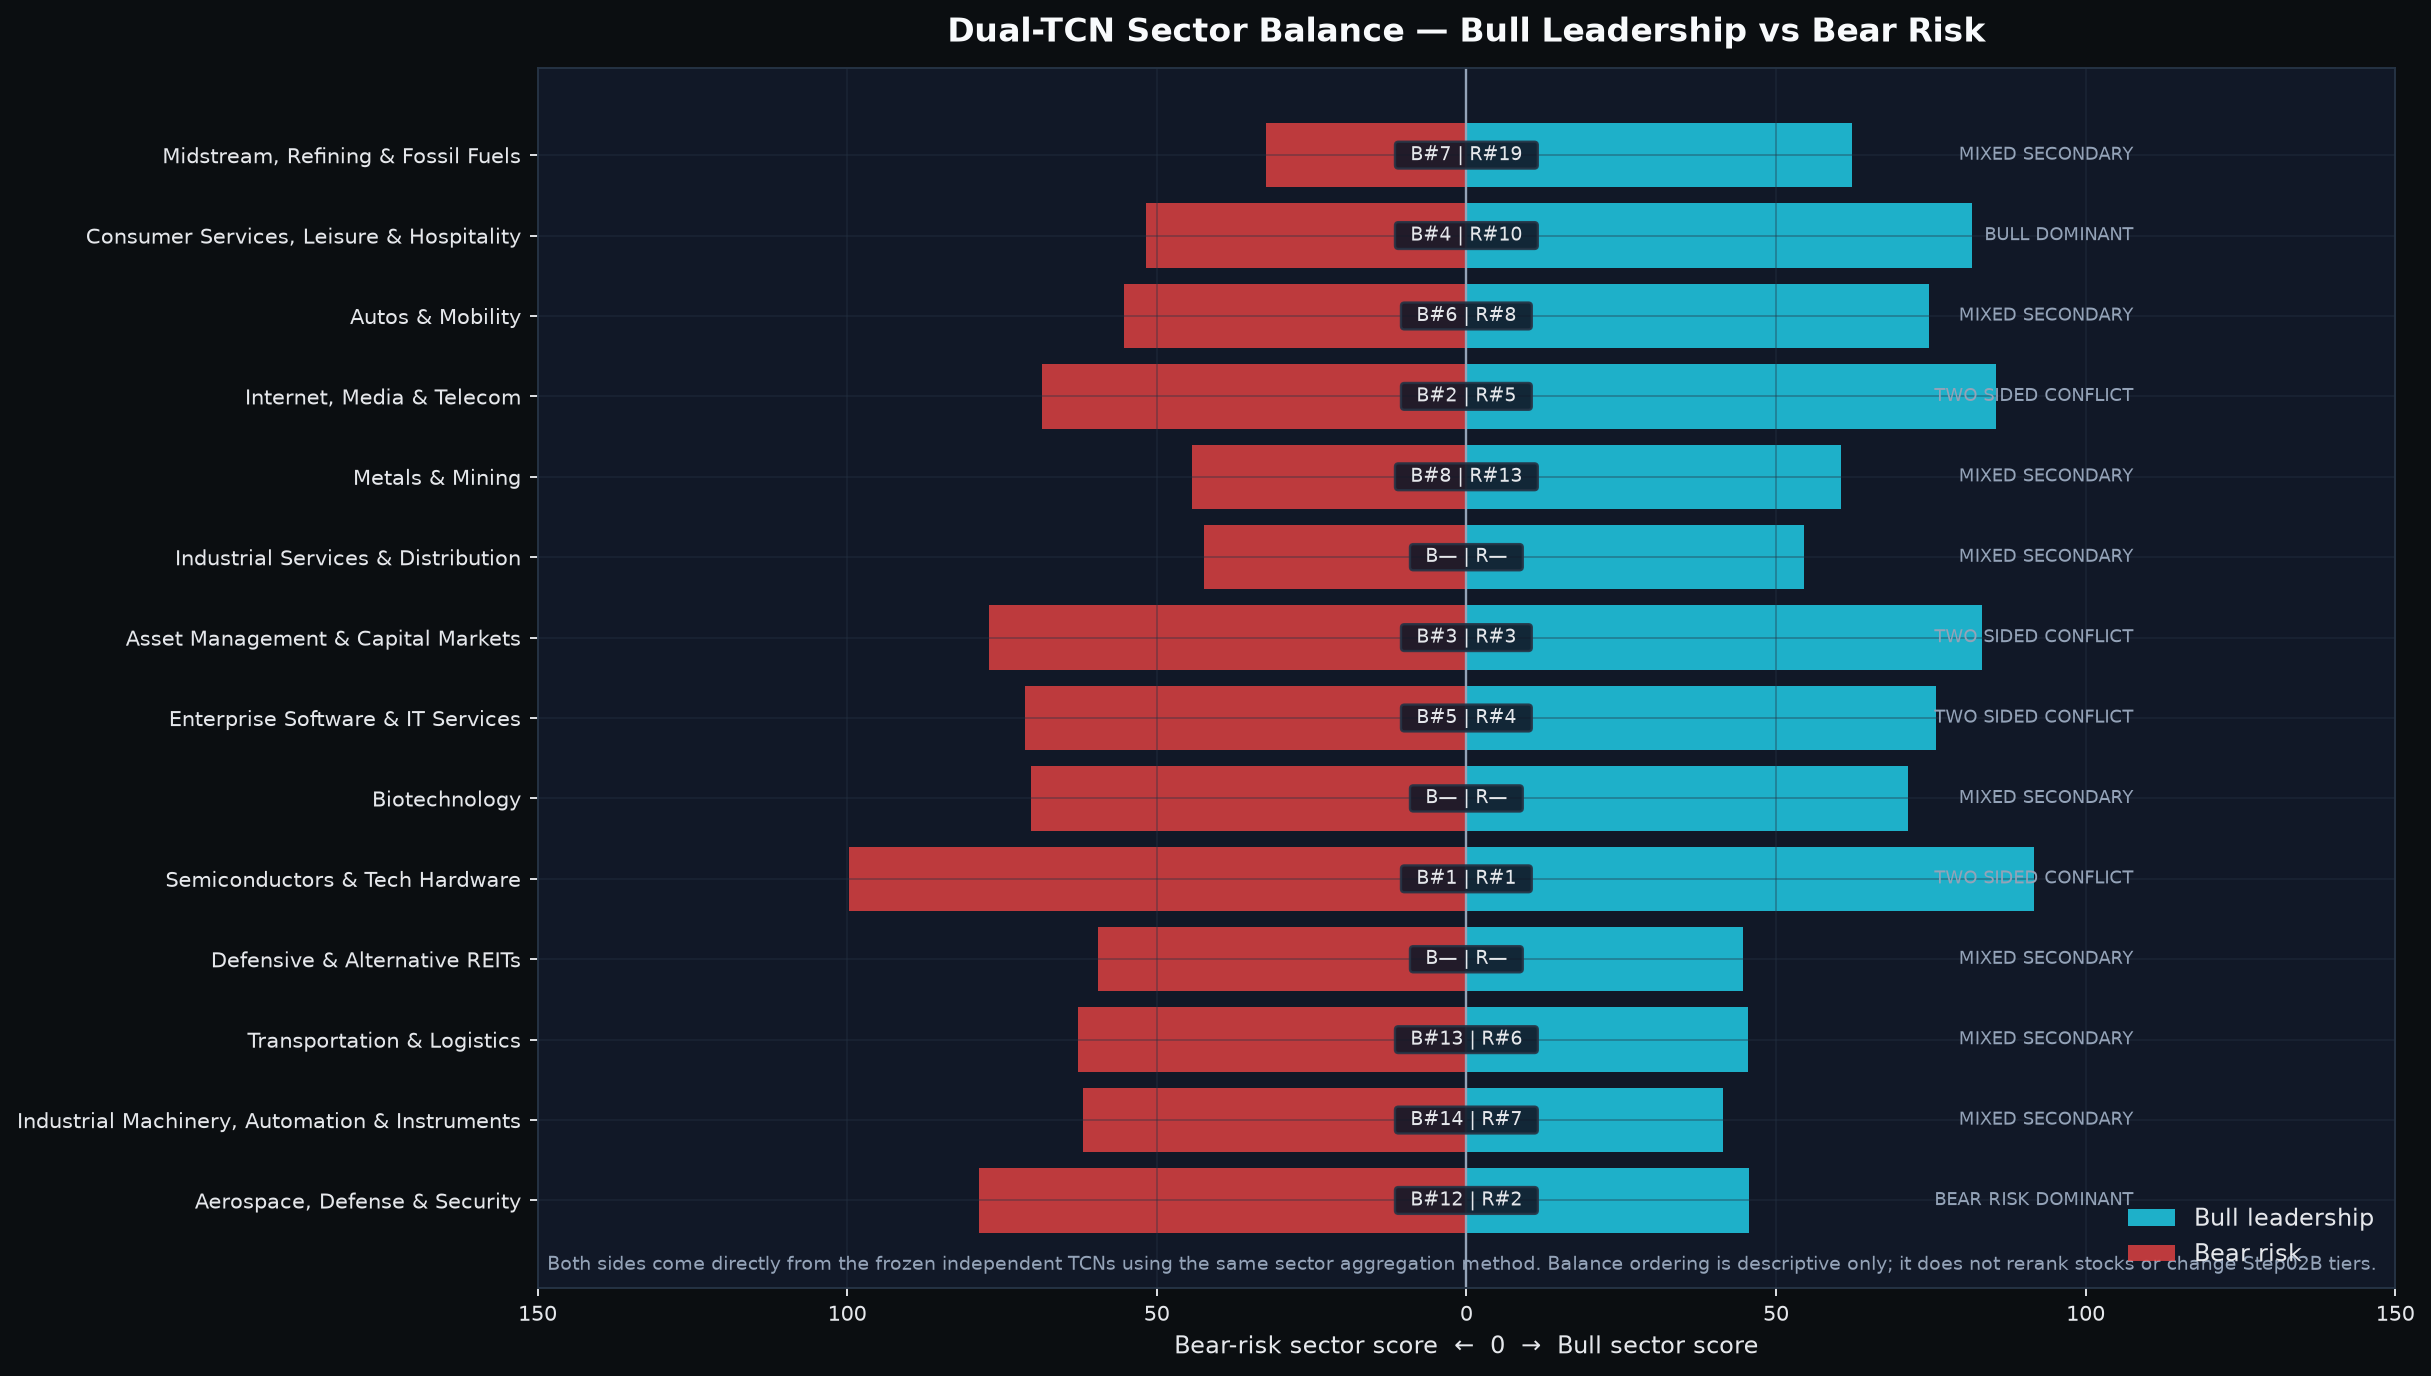
The composition changed sharply from the prior session. Semiconductors moved from #3 to #1 and Internet/Media from #5 to #2. Asset Management entered at #3 and Consumer Services at #4, while Enterprise Software fell from #1 to #5. Autos and Metals exited the Bull Top 5. This is a leadership shift in relative ranking, not evidence of observed dollar flows.
| Sector | Current leading subcluster(s) | Key names | Economic linkage | Quant / price-support confirmation | Why now / public mechanism | Strongest counterevidence |
|---|---|---|---|---|---|---|
| Semiconductors & Tech Hardware | AI compute, memory/test, data-center silicon | INTC, TER, IONQ | AI compute capacity, semiconductor test and next-gen compute demand | Three selected names hold recent support; INTC/TER/IONQ are above MA20 | Intel cites AI-driven compute; Teradyne reports record test demand; IonQ reports record deployments | Bear-risk rank #1; leadership is explicitly two-sided |
| Internet, Media & Telecom | AI cloud / digital platforms | NBIS, META, RBLX | AI compute/cloud and monetizable digital engagement | NBIS is support-confirmed and +6.9% above MA20 | Nebius is scaling a full-stack AI cloud platform | Only one selected name; sector Bear-risk #6 |
| Asset Management & Capital Markets | Power-rich AI infrastructure inside a broad finance taxonomy | WULF, IREN, MARA, HUT | Compute/data-center assets sharing power and financing sensitivity | WULF passed support but remains below MA20 | TeraWulf has a long-duration Anthropic AI-infrastructure lease | Bear-risk rank #3; WULF trend has not repaired |
| Consumer Services, Leisure & Hospitality | Cruise / travel demand | RCL | Discretionary travel and experience spending | RCL has fresh support but remains ~4.9% below MA20 | Royal Caribbean reported strong close-in demand and raised guidance | Selected coverage is narrow; travel remains macro-sensitive |
| Enterprise Software & IT Services | AI work-management, EDA, AI data centers, commerce infrastructure | TEAM, APLD, SNPS, SHOP | Enterprise AI software, chip-design stack and compute infrastructure | Four selected support names; trend quality ranges from TEAM weak to SNPS strong | Atlassian AI adoption, Synopsys AI design demand, APLD contracted AI capacity, Shopify growth | Bear-risk rank #4; TEAM/SHOP slower context is weak |
The cross-sector synthesis is broader than a single AI narrative but still not clean. Semiconductor/test/quantum compute, AI cloud, power-rich compute infrastructure, travel demand and enterprise AI software all participate. The common macro constraint is expensive money; the sector-specific overlays are different. Four of the five Bull leaders are simultaneously high on the Bear-risk side, so the market is rewarding selective mechanisms rather than delivering a broad, one-directional endorsement.
Semiconductors are the clearest example. INTC, TER and IONQ all passed recent support tests and remain well above MA20, yet the sector is also Bear-risk #1. That makes current strength useful but fragile: support and public demand evidence need to keep translating into price. Consumer Services is the cleaner sector-level exception because its Bull #4 signal is not paired with a Top-5 Bear-risk rank, although the selected coverage is narrow and RCL itself remains below MA20.
5. Selected stocks: support is real, but transmission quality varies widely
| Stock | Sector | Selection tier/role | Bull rank (of 293) | Bear rank (of 293) | Recent support | Distance from live S1 | Trend context |
|---|---|---|---|---|---|---|---|
| TEAM | Enterprise Software & IT Services | A Bull screen | #12 of 293 | #256 of 293 | next-day wick reclaim; 2 TD ago | 0.25% / 0.05 ATR | MA5 -2.2% / MA20 -0.5% |
| APLD | Enterprise Software & IT Services | B Bull screen | #20 of 293 | #173 of 293 | same-day bullish reclaim; 1 TD ago | 0.65% / 0.10 ATR | MA5 -4.4% / MA20 +0.2% |
| SNPS | Enterprise Software & IT Services | B Bull screen | #16 of 293 | #245 of 293 | same-day bullish reclaim; 2 TD ago | 0.58% / 0.16 ATR | MA5 +2.6% / MA20 +5.5% |
| NBIS | Internet, Media & Telecom | B Bull screen | #19 of 293 | #52 of 293 | same-day bullish reclaim; 1 TD ago | 1.79% / 0.25 ATR | MA5 +0.9% / MA20 +6.9% |
| RCL | Consumer Services, Leisure & Hospitality | B Bull screen | #22 of 293 | #260 of 293 | same-day bullish reclaim; 0 TD ago | 1.54% / 0.37 ATR | MA5 +1.4% / MA20 -4.9% |
| INTC | Semiconductors & Tech Hardware | A+ Bull screen | #6 of 293 | #48 of 293 | next-day wick reclaim; 1 TD ago | 2.04% / 0.39 ATR | MA5 -0.6% / MA20 +17.7% |
| WULF | Asset Management & Capital Markets | B Bull screen | #26 of 293 | #133 of 293 | same-day bullish reclaim; 1 TD ago | 3.65% / 0.48 ATR | MA5 -5.4% / MA20 -2.4% |
| TER | Semiconductors & Tech Hardware | B Bull screen | #24 of 293 | #44 of 293 | same-day bullish reclaim; 0 TD ago | 2.95% / 0.56 ATR | MA5 +1.9% / MA20 +9.6% |
| IONQ | Semiconductors & Tech Hardware | A+ Bull screen | #15 of 293 | #31 of 293 | same-day bullish reclaim; 0 TD ago | 3.71% / 0.59 ATR | MA5 +6.1% / MA20 +15.2% |
| SHOP | Enterprise Software & IT Services | B Bull screen | #29 of 293 | #66 of 293 | same-day bullish reclaim; 1 TD ago | 2.98% / 0.60 ATR | MA5 -0.6% / MA20 +3.3% |
The table order is preserved exactly from the current support-confirmed list. Public facts, slower context and price-path risk context can explain or challenge the setup; they do not change membership or ranking.
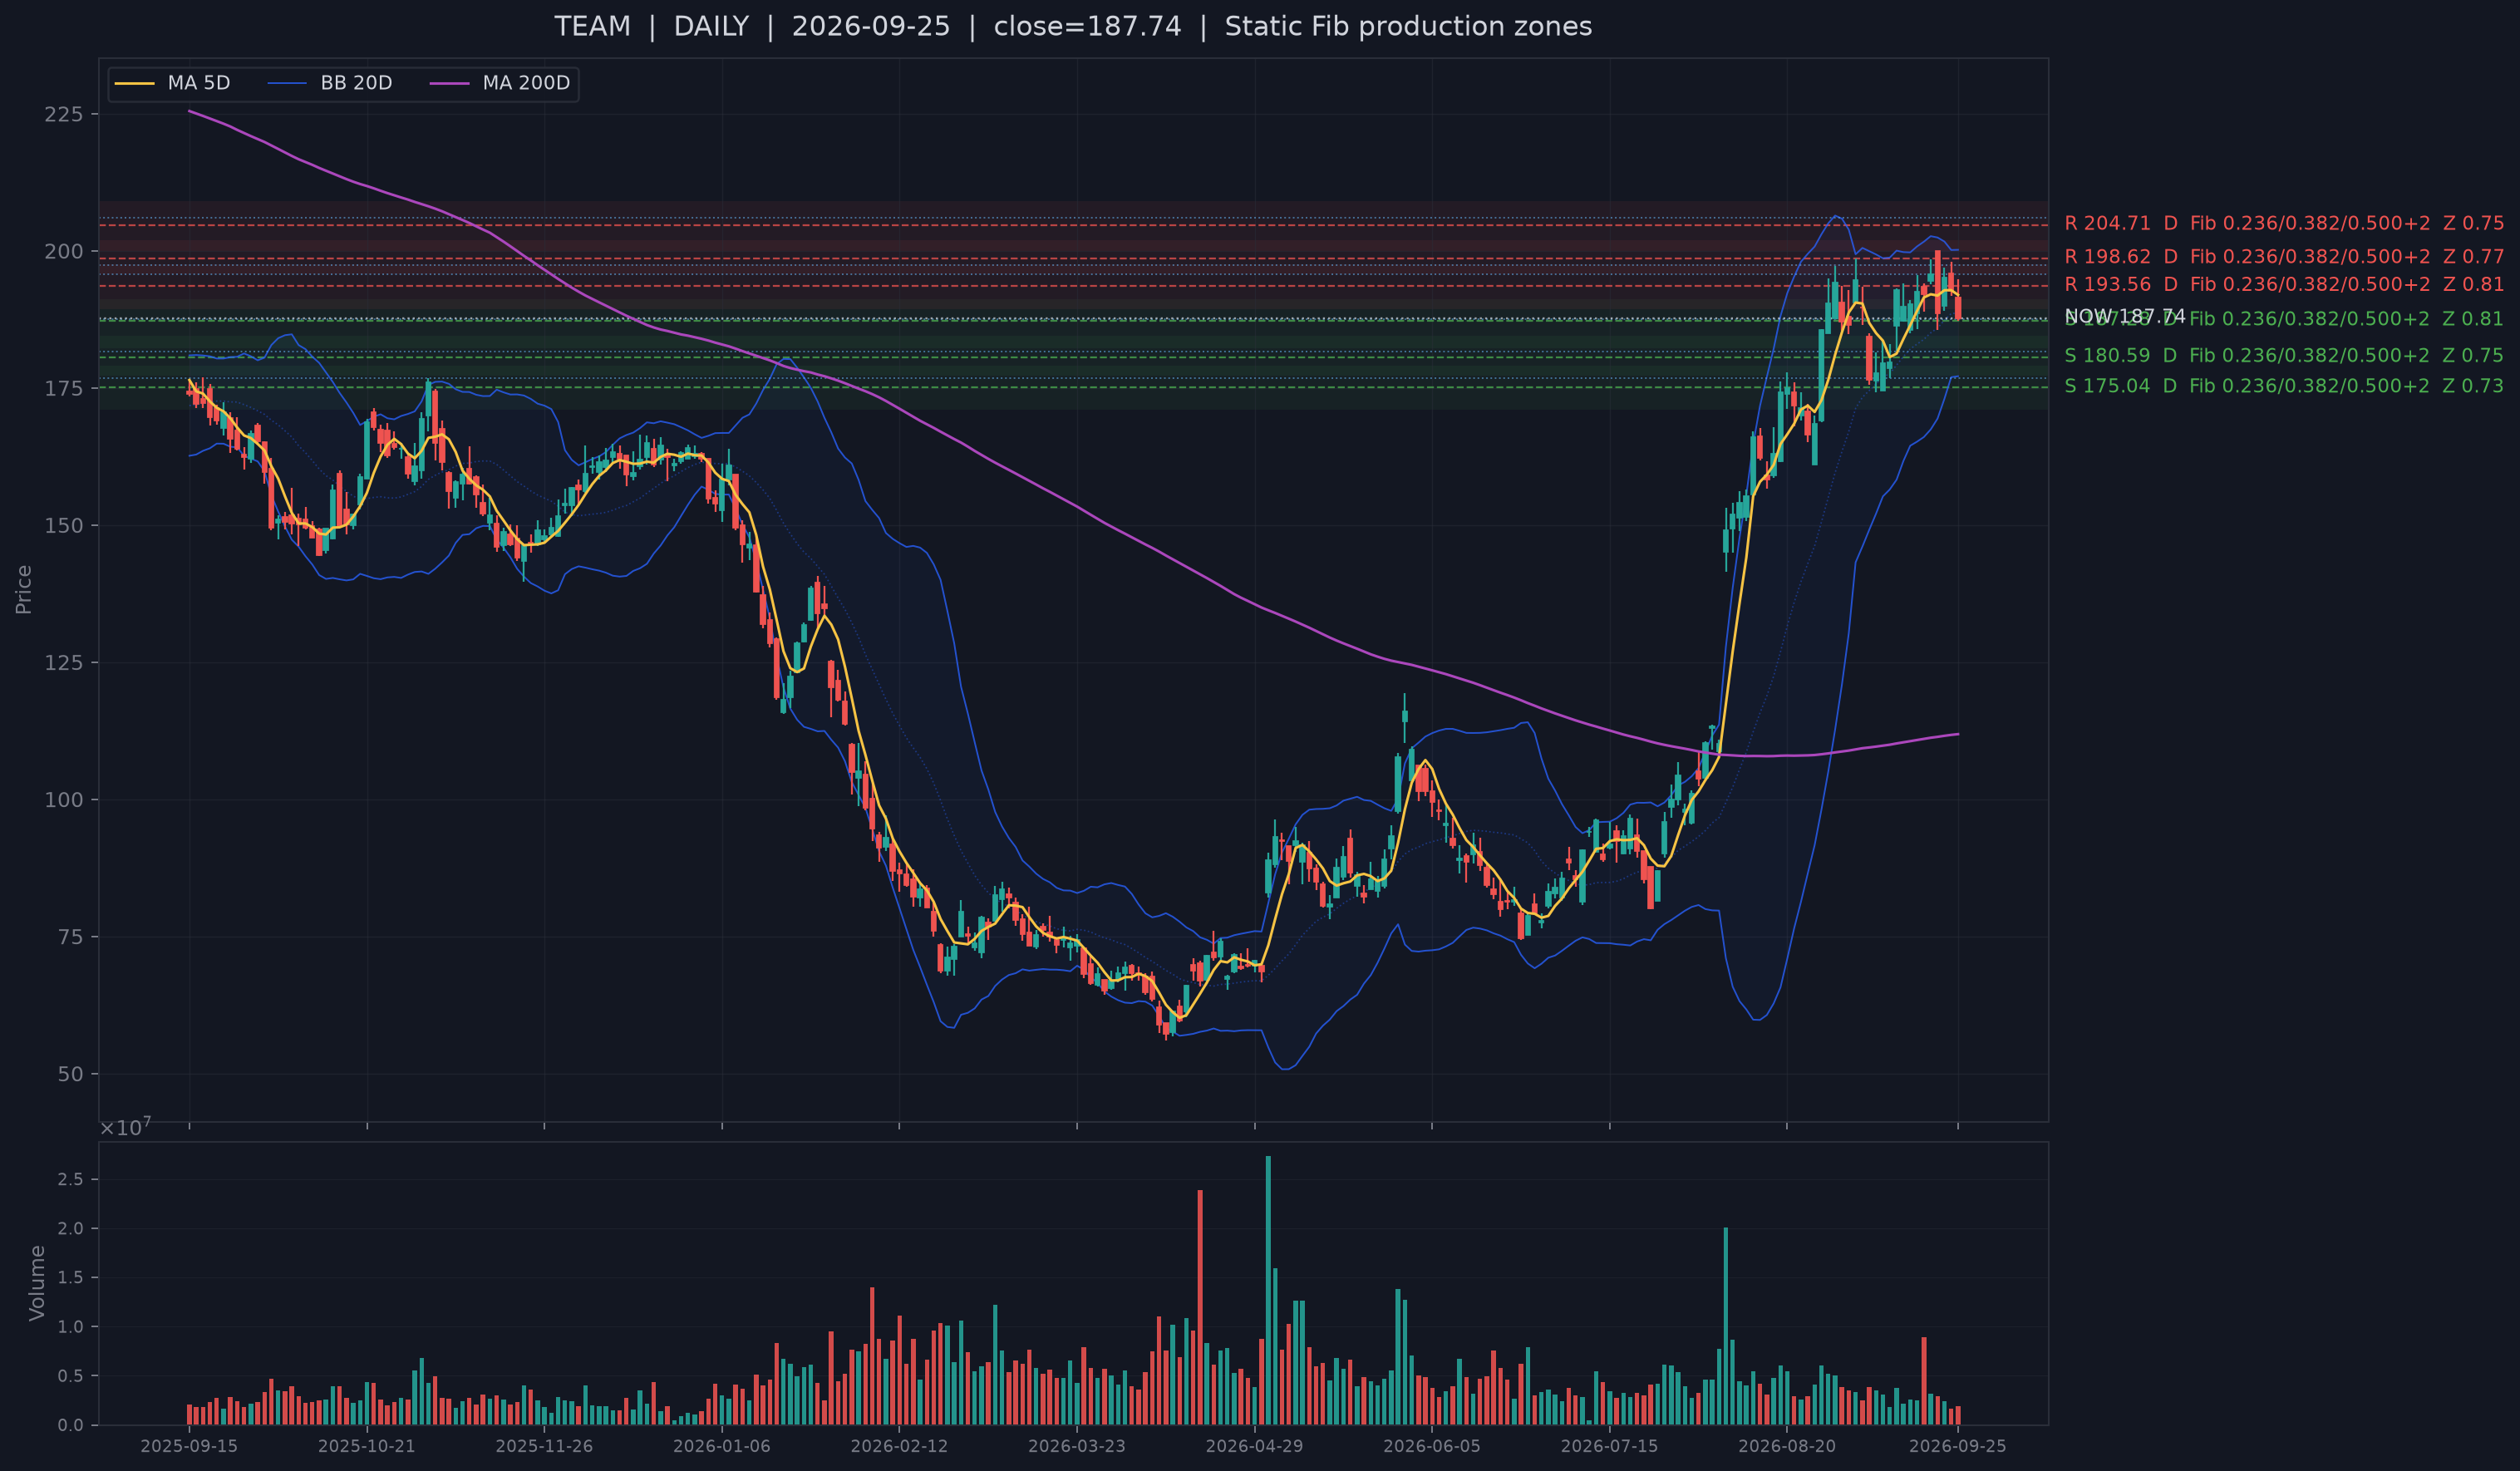
TEAM is the closest support name, but it is not a clean trend confirmation. It sits only 0.05 ATR from live S1 while remaining slightly below MA20. Atlassian's Q4 numbers show strong cloud growth, record large-enterprise deal activity and deeper Rovo usage, but the slower layers are weak: Financial rank 0.81 contrasts with delayed holdings rank 0.03, and the price-divergence readings are negative. The separate price-path/risk context is also internally mixed—positive expected-return context versus a short energy-side recommendation—so it is best treated as neutral secondary evidence. The next test is price repair, not narrative strength.
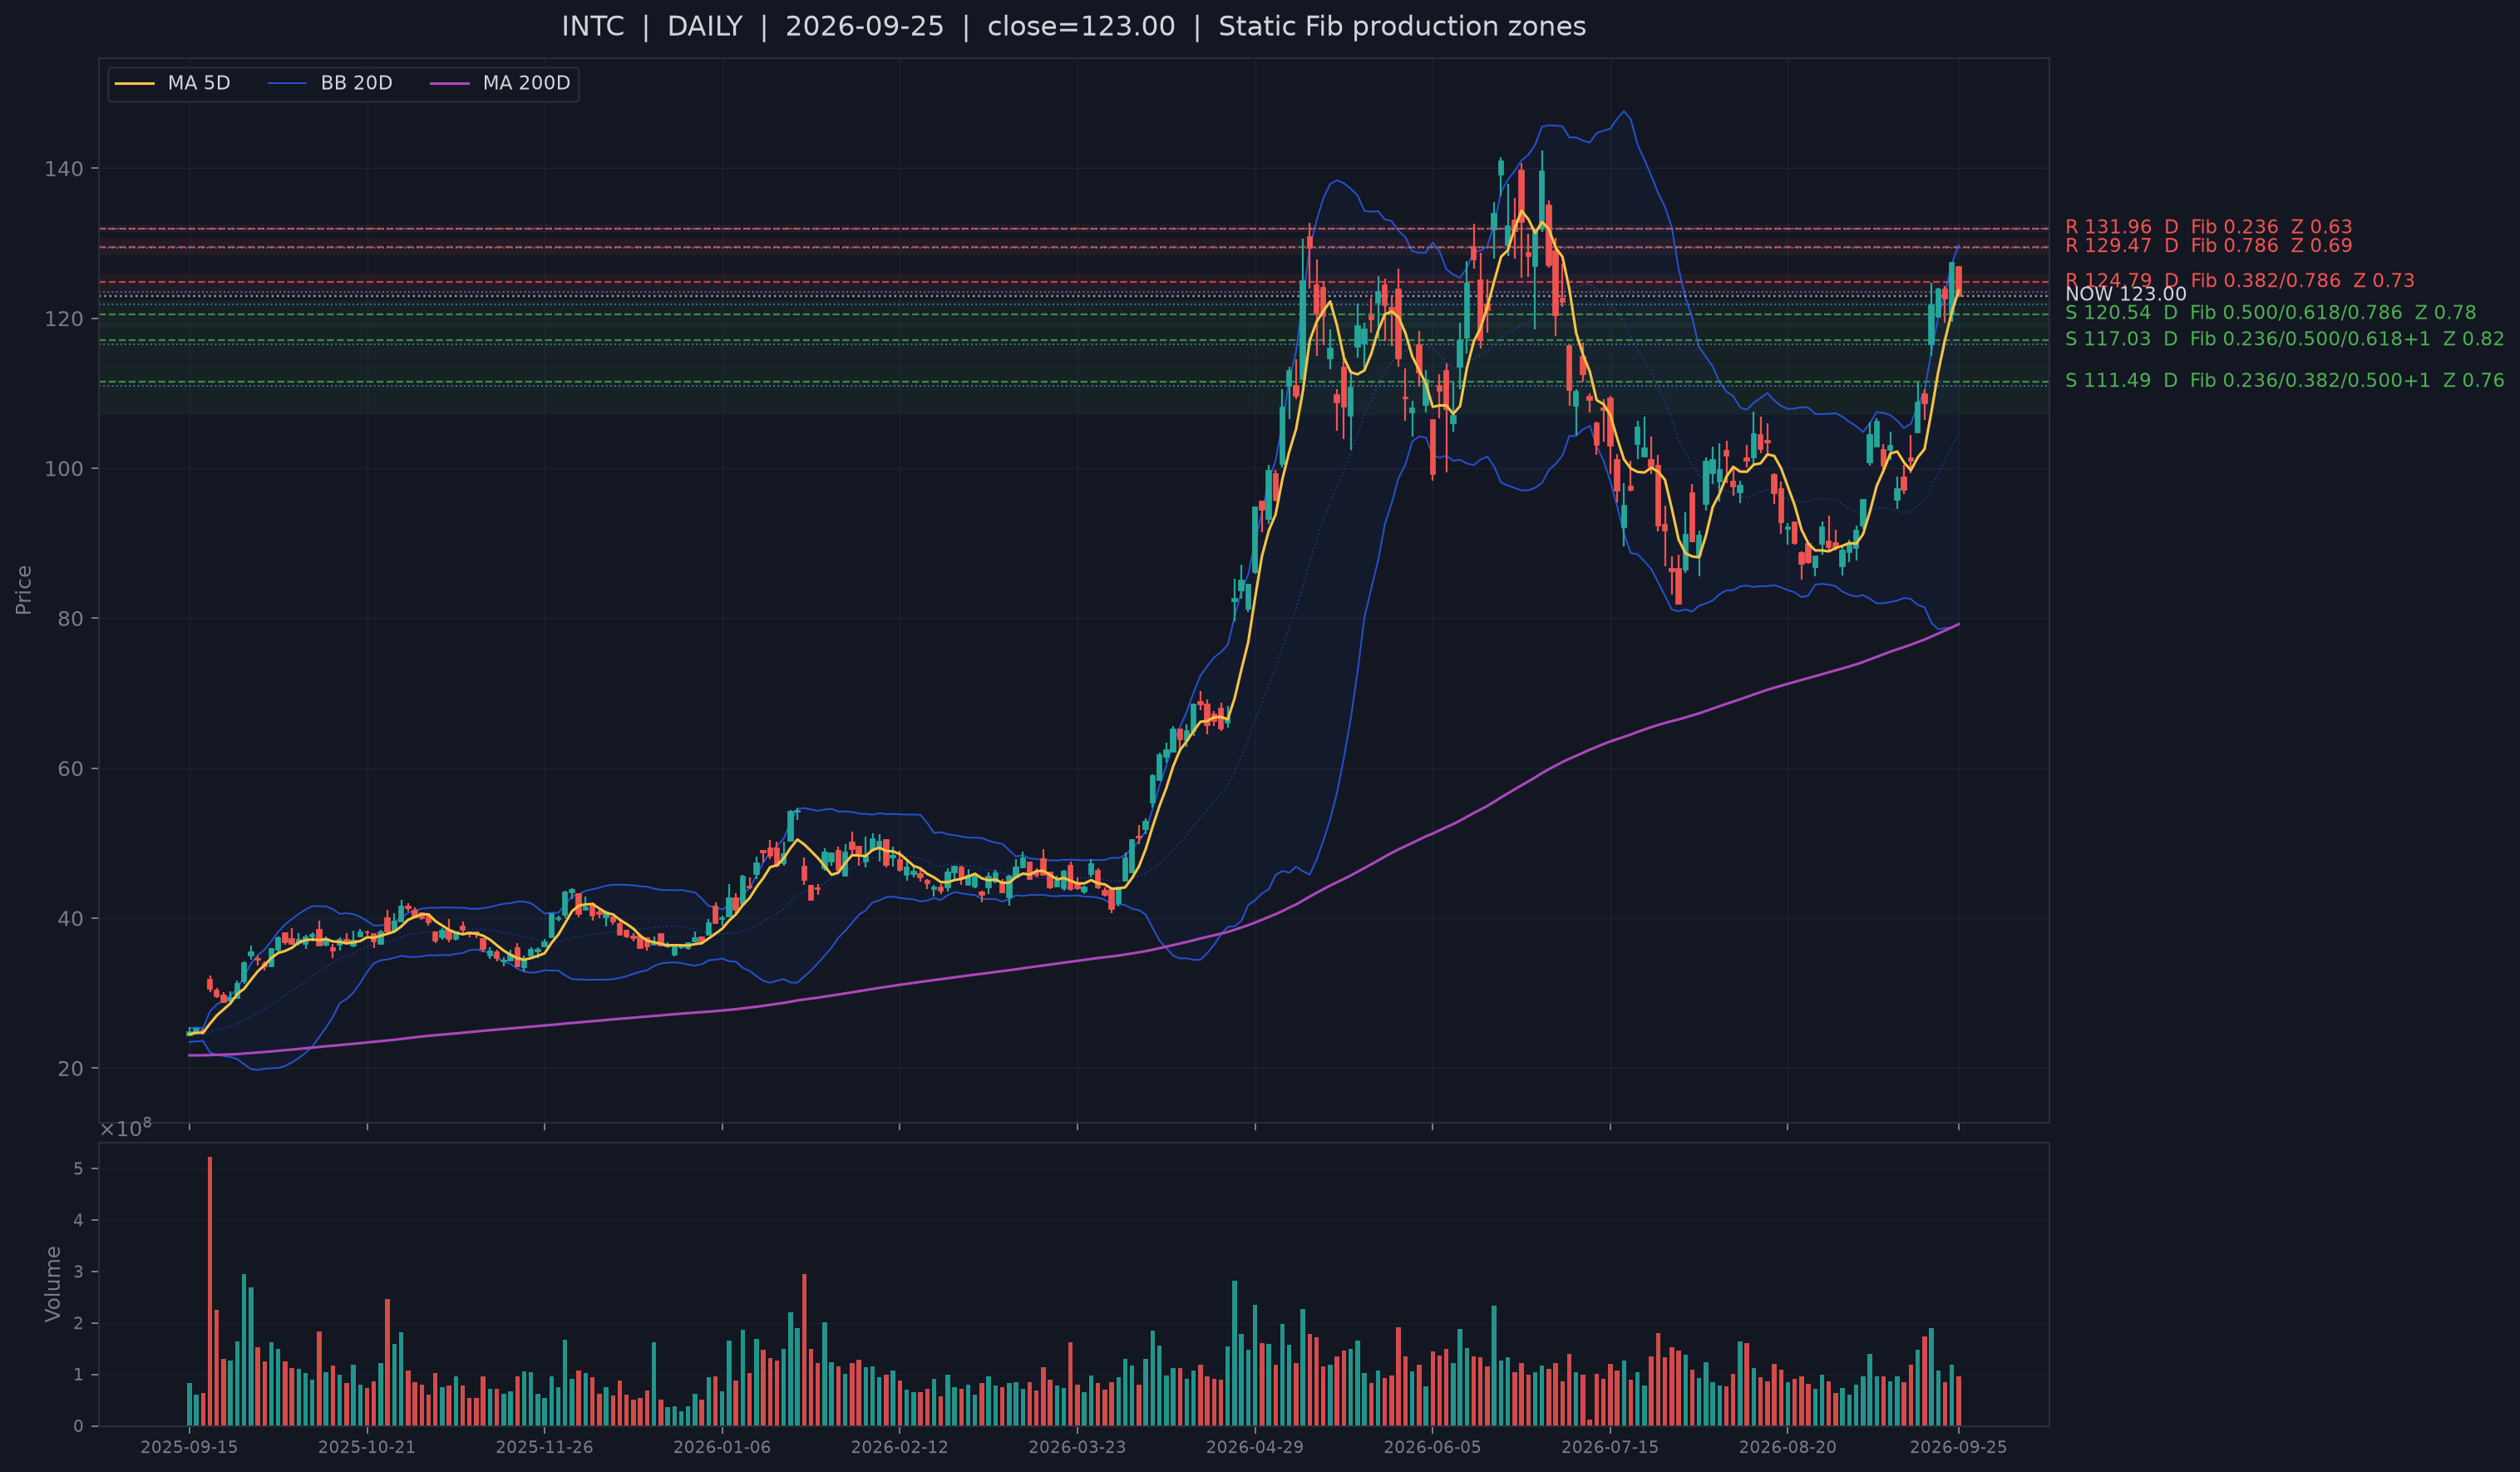
INTC, TER and IONQ define the cleaner semiconductor transmission cluster. INTC is +17.7% above MA20 with both slower ranks strong; Intel's Q2 release explicitly tied demand to AI compute, ASICs, advanced packaging and foundry. TER is +9.6% above MA20 with Financial and delayed-holdings ranks near the top of the selected group, and its Q2 semiconductor-test revenue was exceptionally strong. IONQ is +15.2% above MA20 after record quarterly revenue and platform deployments, although its delayed-holdings rank is less supportive than its price trend. Together they show how the Bull #1 semiconductor signal is translating in selected names despite sector-level Bear conflict.
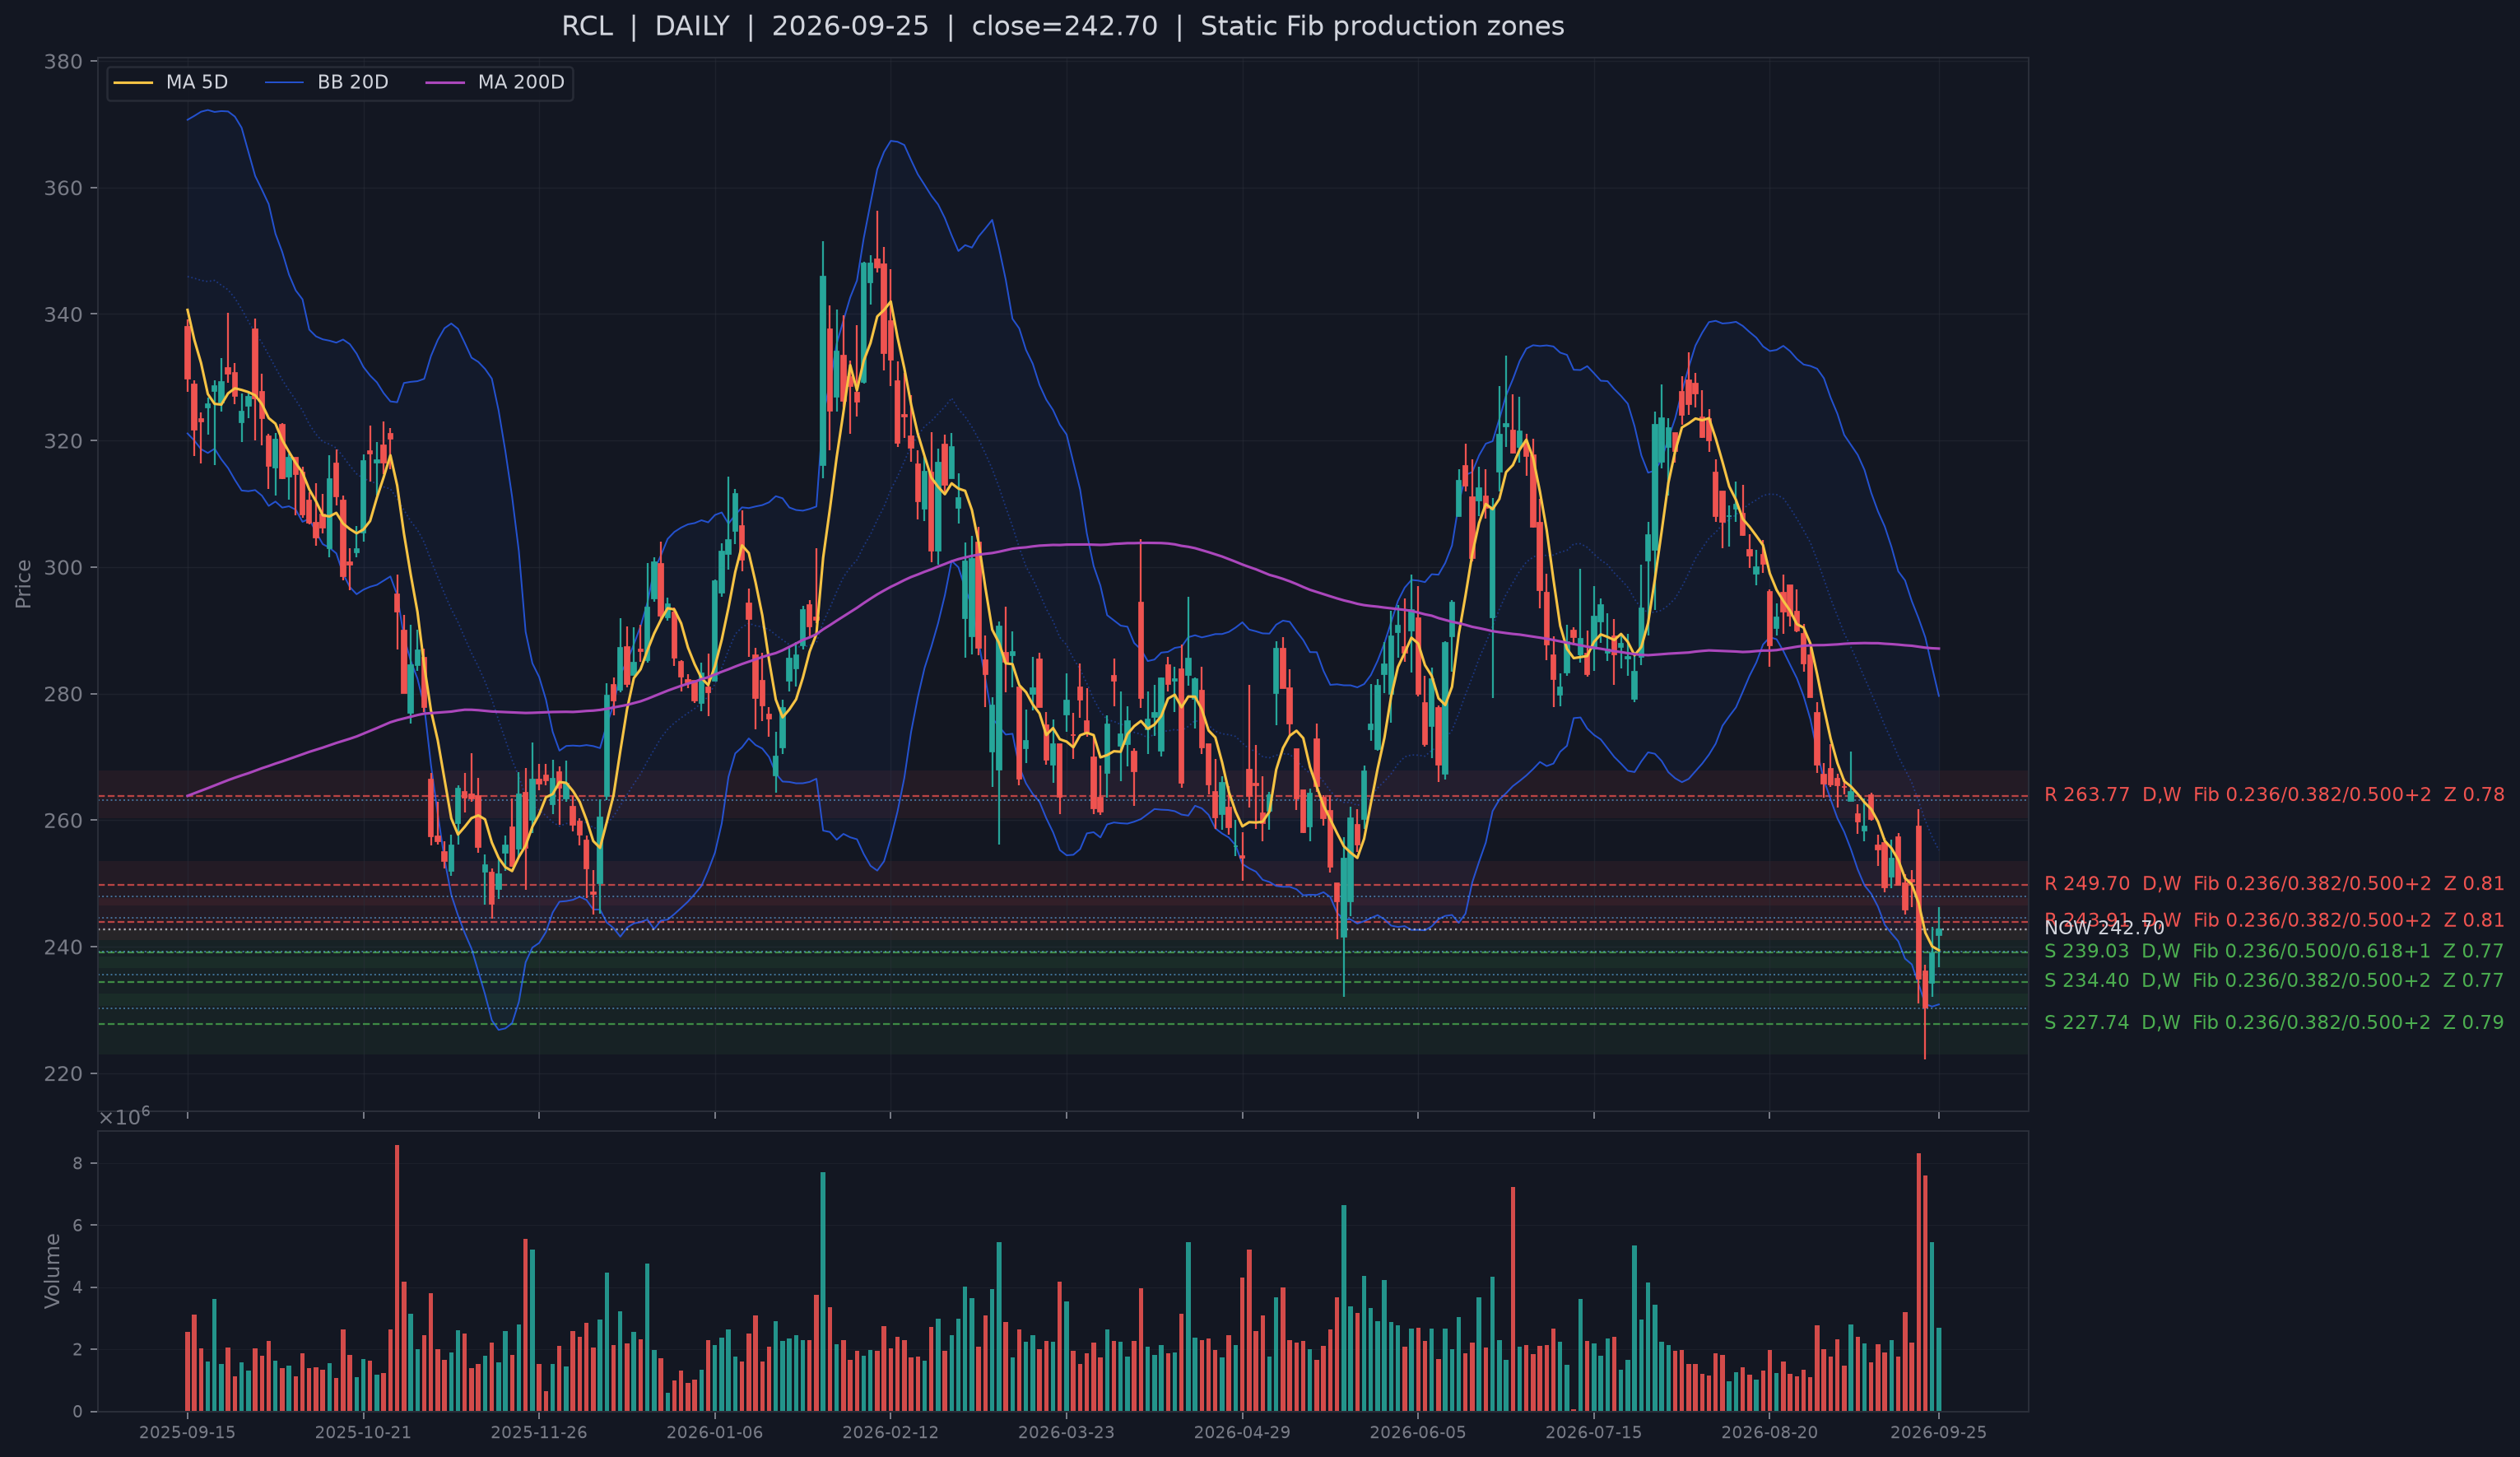
RCL is the fresh-support / incomplete-trend control. The support confirmation occurred on the current session, but the stock is still 4.9% below MA20. Royal Caribbean's strong close-in demand and raised guidance provide a credible operating mechanism; they do not substitute for price repair. NBIS is the opposite trend-quality example: it is +6.9% above MA20 and has positive delayed-holdings context, but no comparable current Financial rank is available, so that missing layer stays neutral.
APLD, WULF and SNPS show three different AI-infrastructure / enterprise contrasts. APLD is essentially on MA20 with long-duration hyperscaler lease visibility, but its Financial rank is weak. WULF has a long-duration Anthropic lease and strong delayed-holdings context, yet price is below MA20 and its Financial rank is only 0.08. SNPS is +5.5% above MA20 and benefits from AI-driven design complexity, while its slower evidence is mixed rather than uniformly supportive. SHOP is modestly above MA20 and public operating growth is strong, but both slower ranks are weak; its current price-path/risk context is also internally mixed and therefore neutral rather than a ranking override.
Slower context is confirmation or counterevidence, not a ranking override
| Stock | Financial context | Delayed institutional-holdings context |
|---|---|---|
| TEAM | Financial rank 0.81; price divergence -0.35 | Delayed 13F rank 0.03; price divergence -0.78 |
| APLD | Financial rank 0.21; price divergence +0.37 | Delayed 13F rank 0.45; price divergence +0.43 |
| SNPS | Financial rank 0.42; price divergence +0.15 | Delayed 13F rank 0.19; price divergence -0.03 |
| NBIS | Financial context not available from comparable current sources | Delayed 13F rank 0.73; price divergence +0.37 |
| RCL | Financial rank 0.12; price divergence -0.10 | Delayed 13F rank 0.42; price divergence -0.00 |
| INTC | Financial rank 0.86; price divergence +0.48 | Delayed 13F rank 0.80; price divergence +0.60 |
| WULF | Financial rank 0.08; price divergence +0.28 | Delayed 13F rank 0.72; price divergence +0.67 |
| TER | Financial rank 0.89; price divergence +0.37 | Delayed 13F rank 0.85; price divergence +0.50 |
| IONQ | Financial rank 0.36; price divergence +0.43 | Delayed 13F rank 0.18; price divergence +0.27 |
| SHOP | Financial rank 0.75; price divergence -0.26 | Delayed 13F rank 0.10; price divergence -0.61 |
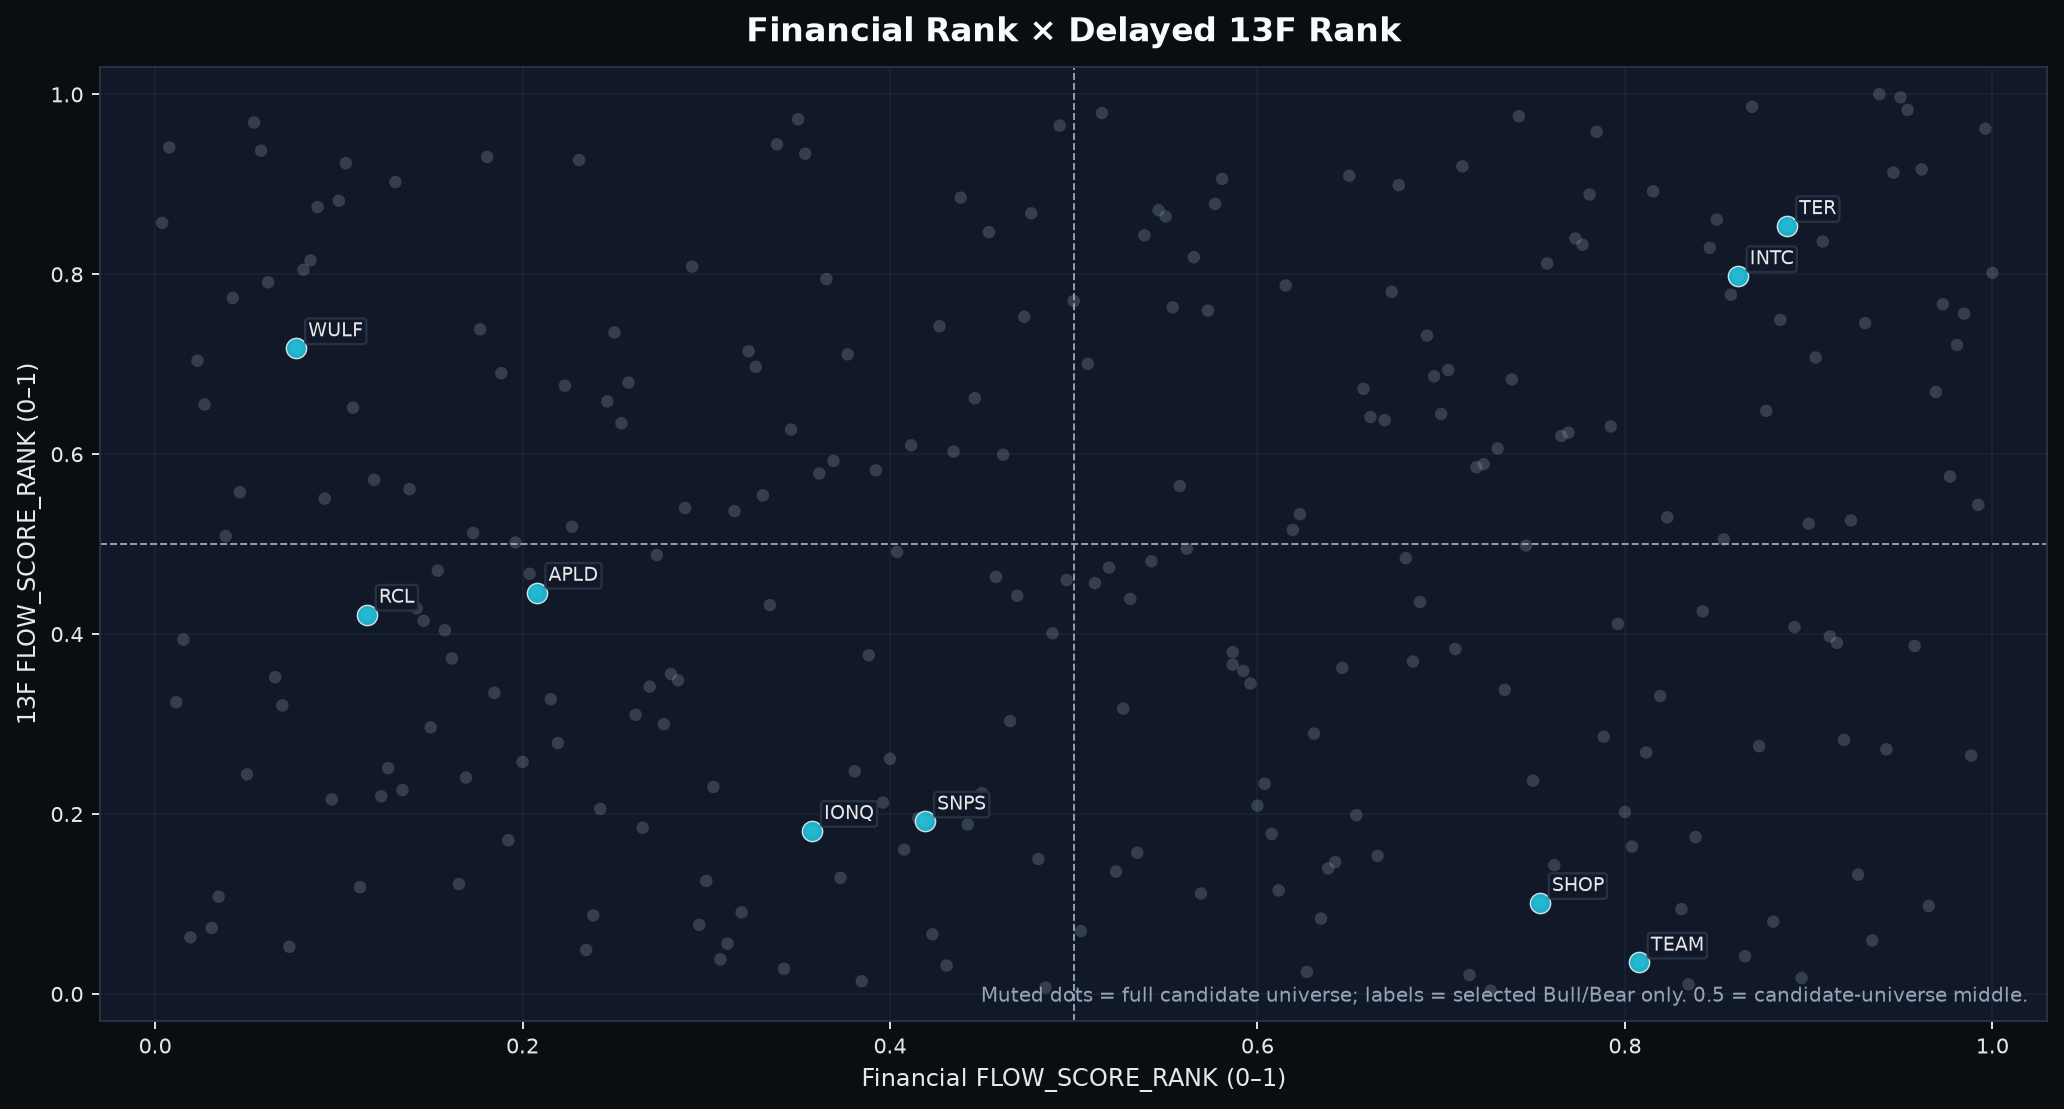
Most comparable institutional-holdings snapshots became available in late May or early June 2026, so they are multi-month context rather than a current-flow measure. The clearest agreement cases are INTC and TER; the clearest disagreements are TEAM and SHOP, where high Financial ranks coexist with very weak delayed-holdings ranks and negative price divergence. NBIS has no comparable current Financial rank, so that layer is explicitly unavailable rather than treated as negative evidence.
6. Base case, confidence and falsification
Base case (3-10 trading days): selective and conditionally constructive, with a high confirmation burden. Confidence is moderate. Breadth and fresh damage repaired, the indexes remain above MA20 and several selected names show good support-to-trend transmission. But the final-hour order-flow deterioration, high price-of-money state, still-positive F shock and four-of-five two-sided sector structure prevent a broad risk-on conclusion.
What strengthens it: Aggressor and Alignment reclaim 50 early and sustain the move with improving Bull-aligned breadth and equal-weight price; breadth moves toward 0.50 while damage remains quiet; and weak-trend names such as TEAM, RCL and WULF repair toward or through MA20 without losing live S1.
What invalidates it: repeated Aggressor/Alignment failure below 50 combined with renewed new-low, large-decline or dispersion damage; index MA20 failure; and multiple live-S1 breaks among the selected names. That combination would turn a conditional repair into a more credible propagation signal.
Sources
- Atlassian (2026-08-06) - Q4 FY26 revenue $1.8B (+28%), cloud revenue $1.2B (+31%) and deeper Rovo/AI usage.
- Applied Digital (2026-04-23) - A 300 MW critical-IT hyperscaler lease at Delta Forge 1 with about $7.5B base-term value.
- Synopsys (2026-08-26) - Q3 revenue $2.477B with Design Automation strength and continued AI-driven demand.
- Nebius (2026-08-12) - Nebius describes a rapidly expanding full-stack AI cloud platform serving developers and enterprises.
- Royal Caribbean / SEC (2026-07-28) - Q2 results exceeded expectations on strong close-in demand and full-year guidance was raised.
- Intel (2026-07-23) - Q2 revenue $16.1B (+25%); management cited AI demand across CPUs, ASICs, advanced packaging and foundry.
- TeraWulf / SEC filing (2026-07-06) - 20-year Anthropic lease for up to 401 MW critical IT load, expected to generate about $19B contracted revenue.
- Teradyne (2026-07-28) - Q2 revenue $1.329B (+104%) with record memory revenue and strong semiconductor-test demand.
- IonQ (2026-08-05) - Q2 revenue $80.1M (+287%) driven by deployments across the quantum platform.
- Shopify (2026-08-05) - Q2 revenue grew 34% and free-cash-flow margin was 18%.
- CFTC (2026-09-25 release / 2026-09-22 positions) - Weekly COT positioning used only as release-aware, lagged positioning context.
Methodology / horizon note
This note uses private quantitative evidence to define the research question first, then public facts to test mechanisms and counterevidence. Sector and stock ranks are not changed by news. Relative cross-asset destinations are price-implied, not observed fund flows. F describes price-of-money movement rather than funding-plumbing stress; K describes common-mode strength rather than direction; CFTC and delayed holdings are slower confirmation layers. The 3-10 trading-day horizon is intentional; the conclusions may not transfer to intraday trading or longer-horizon investing.