Late Order-Flow Repair Stopped Short of Neutral as New-Low Damage Deepened
Indexes remain above MA20 and market-wide order flow repaired late, but Aggressor Flow and Alignment still closed below neutral while breadth stayed weak, long-horizon new-low damage spiked and a fresh Real10-led tightening shock raised the confirmation burden.
Horizon: 3-10 trading days.
This research is designed for 3-10 trading-day swing setups. The signals and conclusions may not transfer to intraday trading or longer-horizon investing.
Late Order-Flow Repair Stopped Short of Neutral as New-Low Damage Deepened
The index trend survived, but the market underneath it became harder to trust. The S&P 500 and Nasdaq both remain above MA20, yet both finished just below MA5. Breadth is only 0.405, while the 252-day new-low measure jumped to +3.09z. That is a serious weak-end warning, but it is not broad liquidation: the share of stocks falling 3% or more is still subdued at -0.56z and cross-sectional volatility is -1.06z.
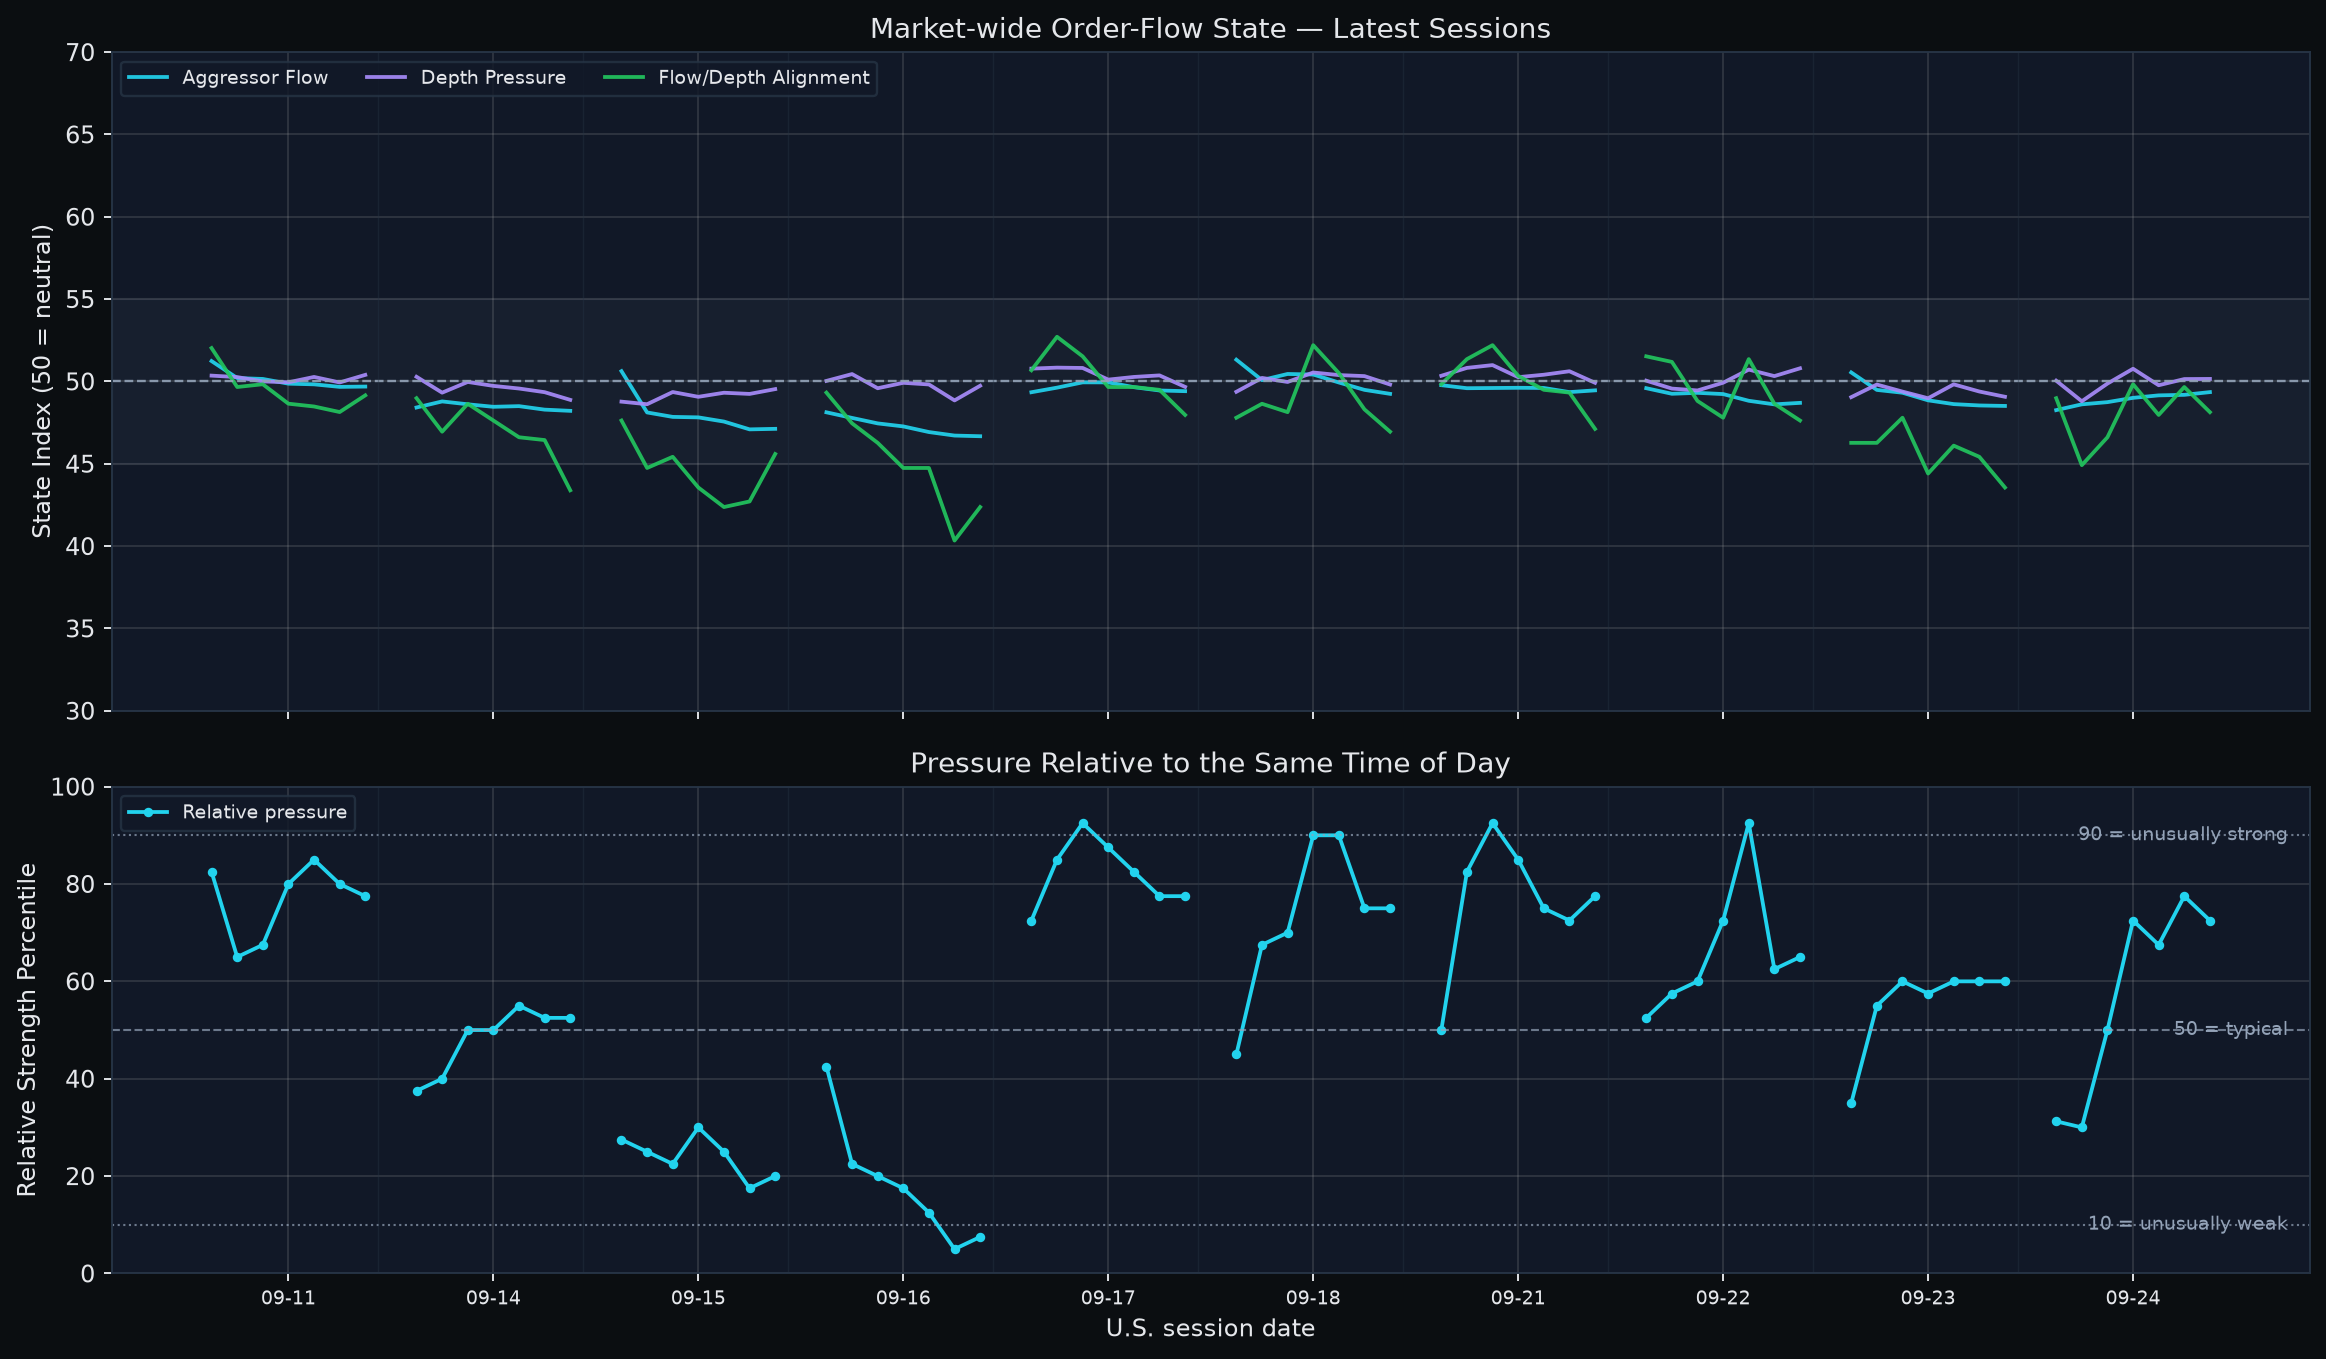
The intraday tape offered a partial counterweight. Market-wide order flow recovered from a weak morning into the afternoon, with Depth finishing slightly above neutral. But Aggressor Flow never reclaimed 50 at any checkpoint and Alignment fell back below neutral in the final hour. The close therefore represents late repair without full neutral reclaim, not a repaired state. Equal-weight price also finished slightly lower from open to close.
My base case is selective upside inside a market with weak participation, a severe long-horizon new-low tail and a renewed discount-rate shock. The strongest constructive evidence is that the major indexes remain above MA20 and several selected support leaders still show good trend transmission. The strongest counterevidence is the combination of 0.405 breadth, +3.09z long-horizon new-low pressure, two-sided technology leadership and a fresh Real10-led price-of-money shock. The next session must convert the late repair into a sustained Aggressor/Alignment neutral reclaim; otherwise the repair burden remains unresolved.
How to read today's indicators
| Indicator | Reader scale | Interpretation |
|---|---|---|
| Market-wide order-flow state | Three component indices; 50 = neutral | Aggressor Flow, Depth Pressure and Flow/Depth Alignment answer different questions. Read confirmation or divergence across the three; they are not probabilities. |
| Same-time order-flow percentile | 0-100; 50 = same-time historical median | 90 is unusually strong and 10 unusually weak for that intraday slot. This is historical context, not event probability. |
| Flow × depth state breadth | Cross-sectional percentages | Bull/Bear aligned show joint direction; absorption states describe compatible divergence only, not proven actor intent. |
| Market breadth | 0-1; practical balance ~0.50 | Above 0.50 means broader participation. Direction and slope show whether participation is improving or fading. |
| z-score | 0 = historical mean | |z| ~1 is notable and |z| ~2 is unusual. It is standardized distance, not probability. |
| Historical percentile | 0-100; 50 = median | 90+ is historically elevated. A percentile is not an event probability. |
| FLOW_SCORE_RANK | 0-1; 0.50 = median | 0.80+ is relatively strong slow context. It is confirmation/context, not a standalone entry signal. |
| Financial / 13F price divergence | Approx. -1 to +1; 0 = little gap | Positive means slow context is ahead of price; negative means price is ahead. ±0.20 / ±0.50 are reader bands only, not learned thresholds. |
| Expected next-session range | Non-directional high-low amplitude | Always pair the raw estimate with its same-day cross-sectional percentile. It is not an upside target. |
1. Price, breadth and damage: trend survives while the weak tail worsens
| Layer | Current reading | Interpretation |
|---|---|---|
| S&P 500 | -0.18% vs MA5; +0.42% vs MA20 | Trend remains above MA20, but short-term price repair is incomplete. |
| Nasdaq Composite | -0.05% vs MA5; +1.82% vs MA20 | Still materially above MA20; close finished high in the daily range. |
| Breadth | 0.405; 5TD change +0.007 | Below balance even though the 20D breadth slope has stopped deteriorating. |
| Downside damage | 20D new-low z +1.39; 252D new-low z +3.09 | Down-3% z -0.56; cross-sectional vol z -1.06: weak-end damage without synchronized liquidation. |
| Cross-asset pressure | Raw F +55bp over 20TD; fresh 5D shock +1.52z | R +0.60 over 20TD; K 0.507; credit roughly neutral; duration weak. |
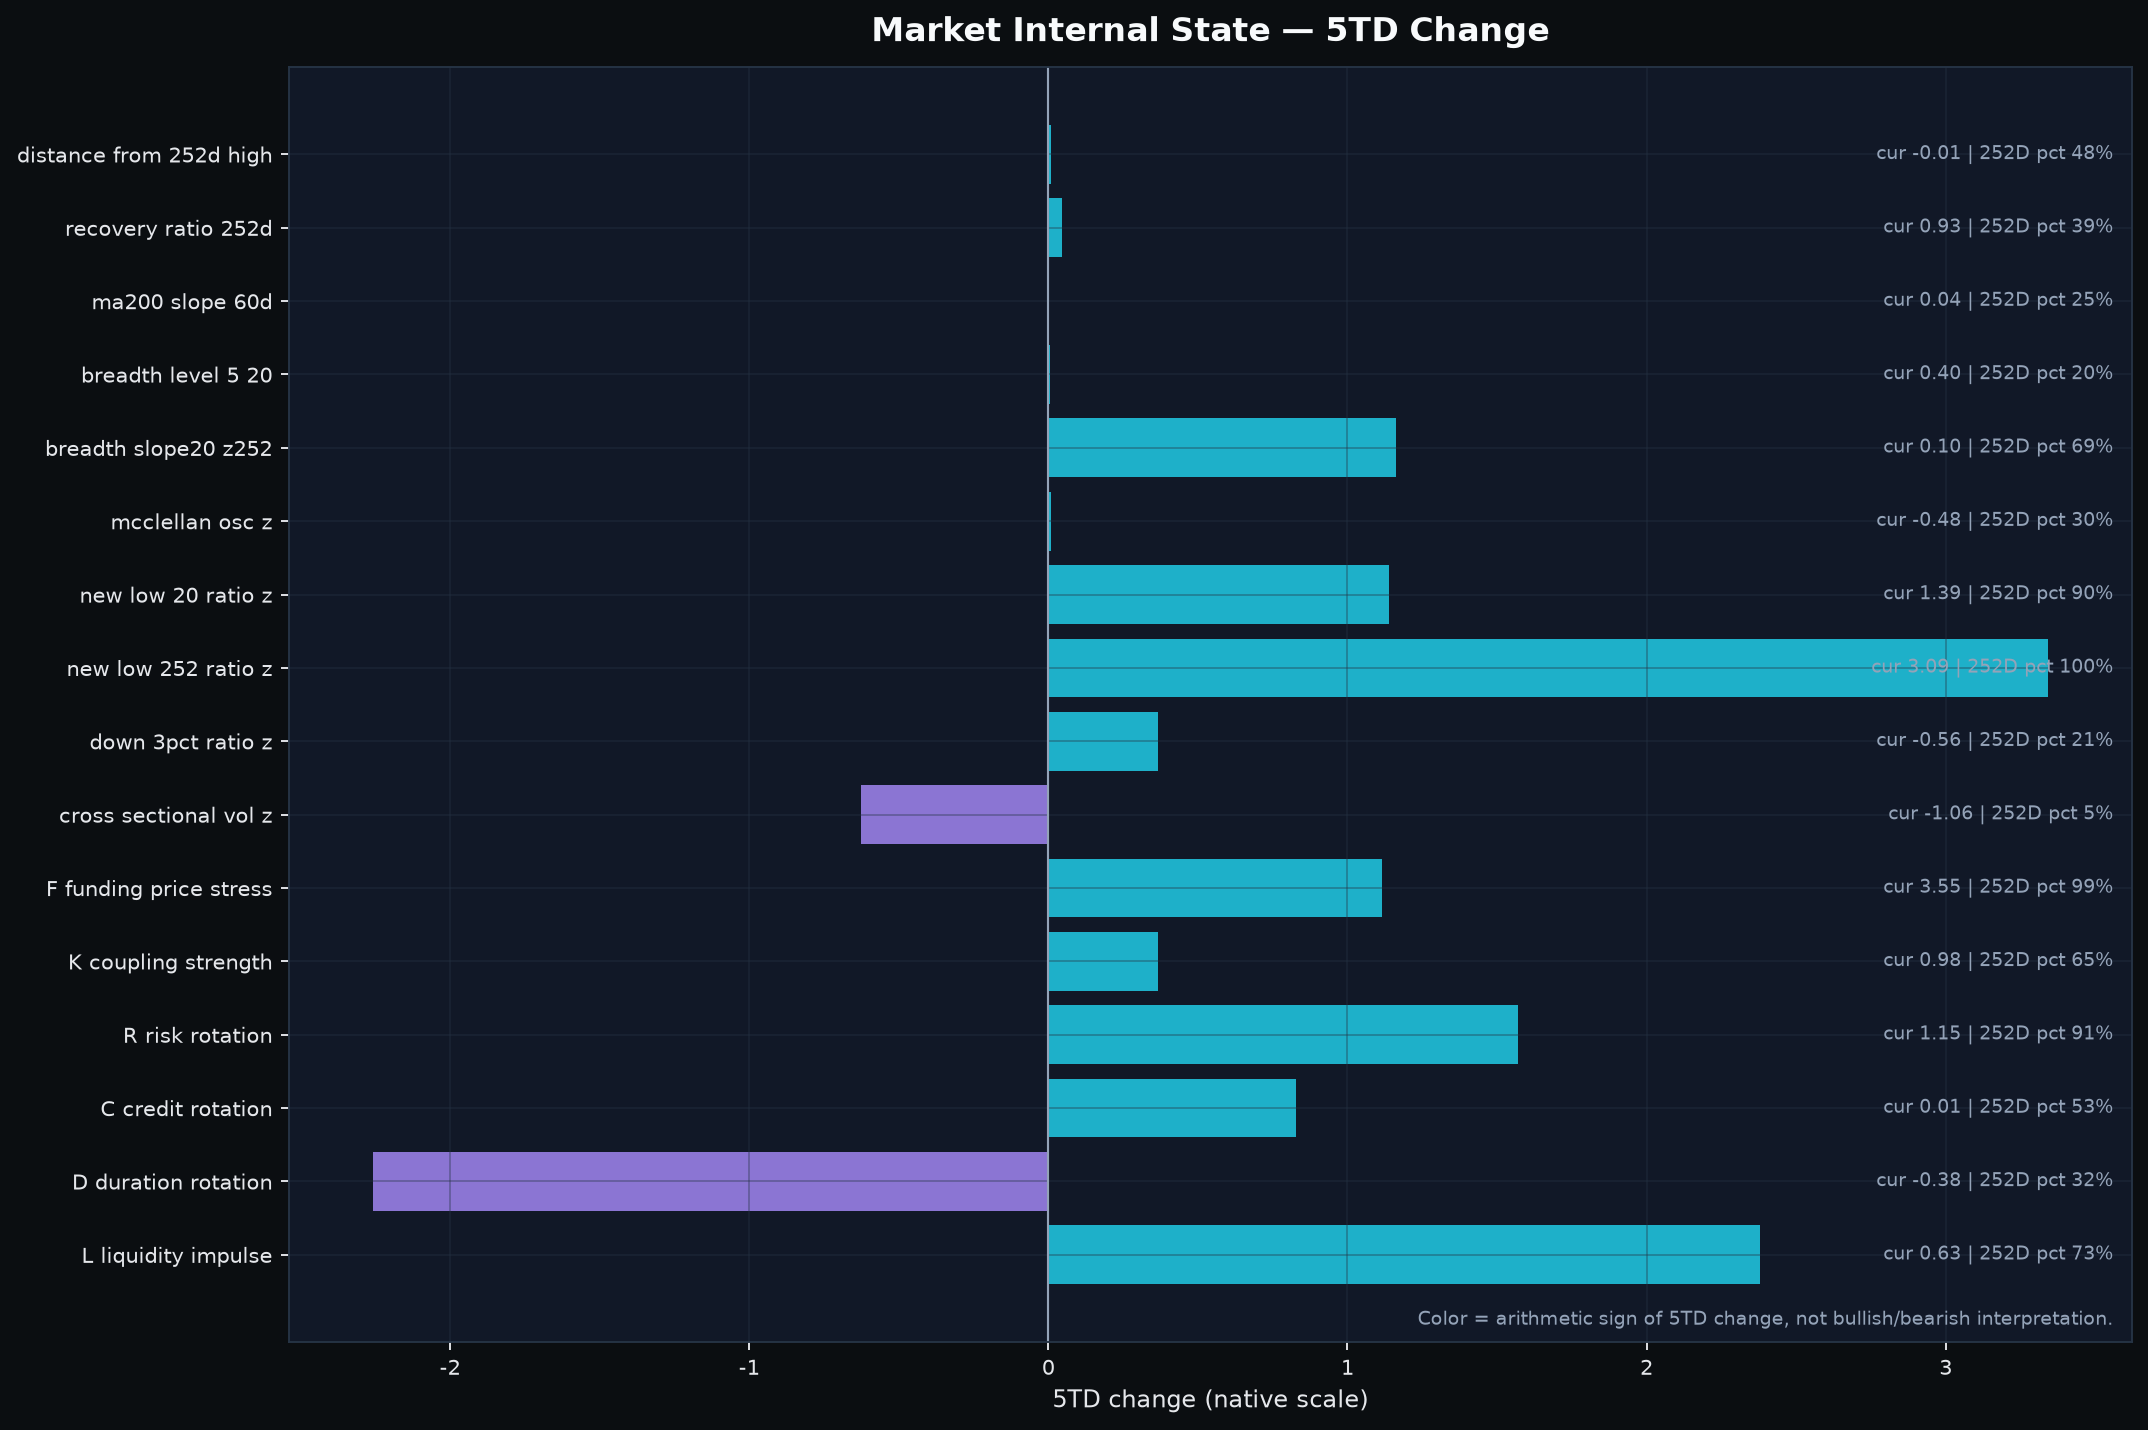
Price and breadth are telling different stories. The S&P is 0.42% above MA20 and the Nasdaq 1.82% above, so the medium-term index trend has not failed. But breadth at 0.405 is still meaningfully below balance. More important, the 252-day new-low z-score has accelerated to +3.09 even though down-3% breadth and cross-sectional volatility remain quiet. The evidence therefore points to deepening damage in a narrower weak tail before synchronized liquidation.
The distinction matters for the next session. If the weak tail begins to spread into large-decline breadth and dispersion while the indexes lose MA20, the current selective thesis would deteriorate quickly. If new lows stabilize while breadth repairs back toward 0.50, today’s long-horizon damage spike can remain a warning rather than a propagation signal.
2. Order flow: afternoon repair improved the path, not the state
| Time | Aggressor Flow | Depth Pressure | Alignment | Same-time pct. | Bull aligned | Bear aligned | Buy absorption | Sell absorption | EW bar response |
|---|---|---|---|---|---|---|---|---|---|
| 09:30 | 48.26 | 50.05 | 48.98 | 31.25 | 12.9% | 14.9% | 19.7% | 13.9% | +0.00% |
| 10:30 | 48.61 | 48.80 | 44.92 | 30.0 | 10.8% | 21.0% | 15.6% | 15.3% | -0.00% |
| 11:30 | 48.74 | 49.87 | 46.61 | 50.0 | 9.2% | 15.9% | 21.7% | 18.0% | +0.01% |
| 12:30 | 49.00 | 50.77 | 49.83 | 72.5 | 13.6% | 13.9% | 26.1% | 12.9% | -0.00% |
| 13:30 | 49.15 | 49.77 | 47.97 | 67.5 | 13.2% | 17.3% | 20.3% | 14.2% | +0.00% |
| 14:30 | 49.19 | 50.14 | 49.66 | 77.5 | 14.2% | 14.9% | 20.3% | 11.5% | -0.00% |
| 15:30 | 49.35 | 50.15 | 48.14 | 72.5 | 12.5% | 16.3% | 18.6% | 12.9% | -0.00% |
The path is more constructive than the morning snapshot but less constructive than the close in price. Aggressor Flow rose from 48.26 at the open to 49.35 at the close, and Depth recovered from a morning low of 48.80 to 50.15. Alignment also rebounded from 44.92 to 49.66 by 14:30 before slipping back to 48.14 in the final hour.
That was meaningful effort, but not successful state repair. In the final hour, Aggressor edged +0.17 points to 49.35, still 0.65 points short of neutral; Depth was essentially flat at 50.15 and preserved its neutral reclaim; Alignment fell 1.53 points to 48.14, leaving a 1.86-point reclaim burden. Cross-sectional confirmation deteriorated at the same time: Bull-aligned breadth fell 1.69 percentage points, Bear-aligned rose 1.36 points, Buy-absorption breadth fell 1.69 points and Sell-absorption rose 1.36 points, producing a bearish breadth deterioration final-bar read. Equal-weight price ended about 0.09% below its open. The counterevidence is time-of-day context: the same-time percentile rose from 31.25 at the open to 77.5 at 14:30 and still closed at 72.5, so the close was weak in absolute state but not historically extreme for that time of day. The next session therefore inherits a partial-repair burden: Aggressor and Alignment need early, persistent 50 reclaims, accompanied by a reversal in aligned/absorption breadth and firmer equal-weight price, rather than another intraday bounce that stops below neutral.
3. Cross-asset conditions: a fresh rate shock without a classic safety flight
Price-of-money pressure is both high and newly accelerating. Raw F is +0.55, equivalent to roughly +55 bp of blended 20-trading-day tightening: about +33 bp from the 2Y component and +22 bp from the approximate 10Y real-rate component. F state is historically elevated, and unlike the prior session the current five-day shock is also strong at +1.52z. The driver is Real10, so the newest impulse is more directly tied to the long-term real discount rate than to a pure front-end policy-path move. That is a material headwind for long-duration equities, but F remains a price-of-money factor rather than a measure of repo or funding-plumbing crisis.
Liquidity quantity is simultaneously positive, which prevents a one-variable macro conclusion. The more important question is transmission. The 20-day R measure still shows a +0.60 move toward equity relative preference, while credit rotation is roughly neutral and duration is weak. Energy and industrial metals are the two positive non-equity relative destinations, and both also have positive own-price pressure. Long Treasuries and credit are not behaving like a classic safety destination. These are relative-price relationships, not observed dollar transfers.
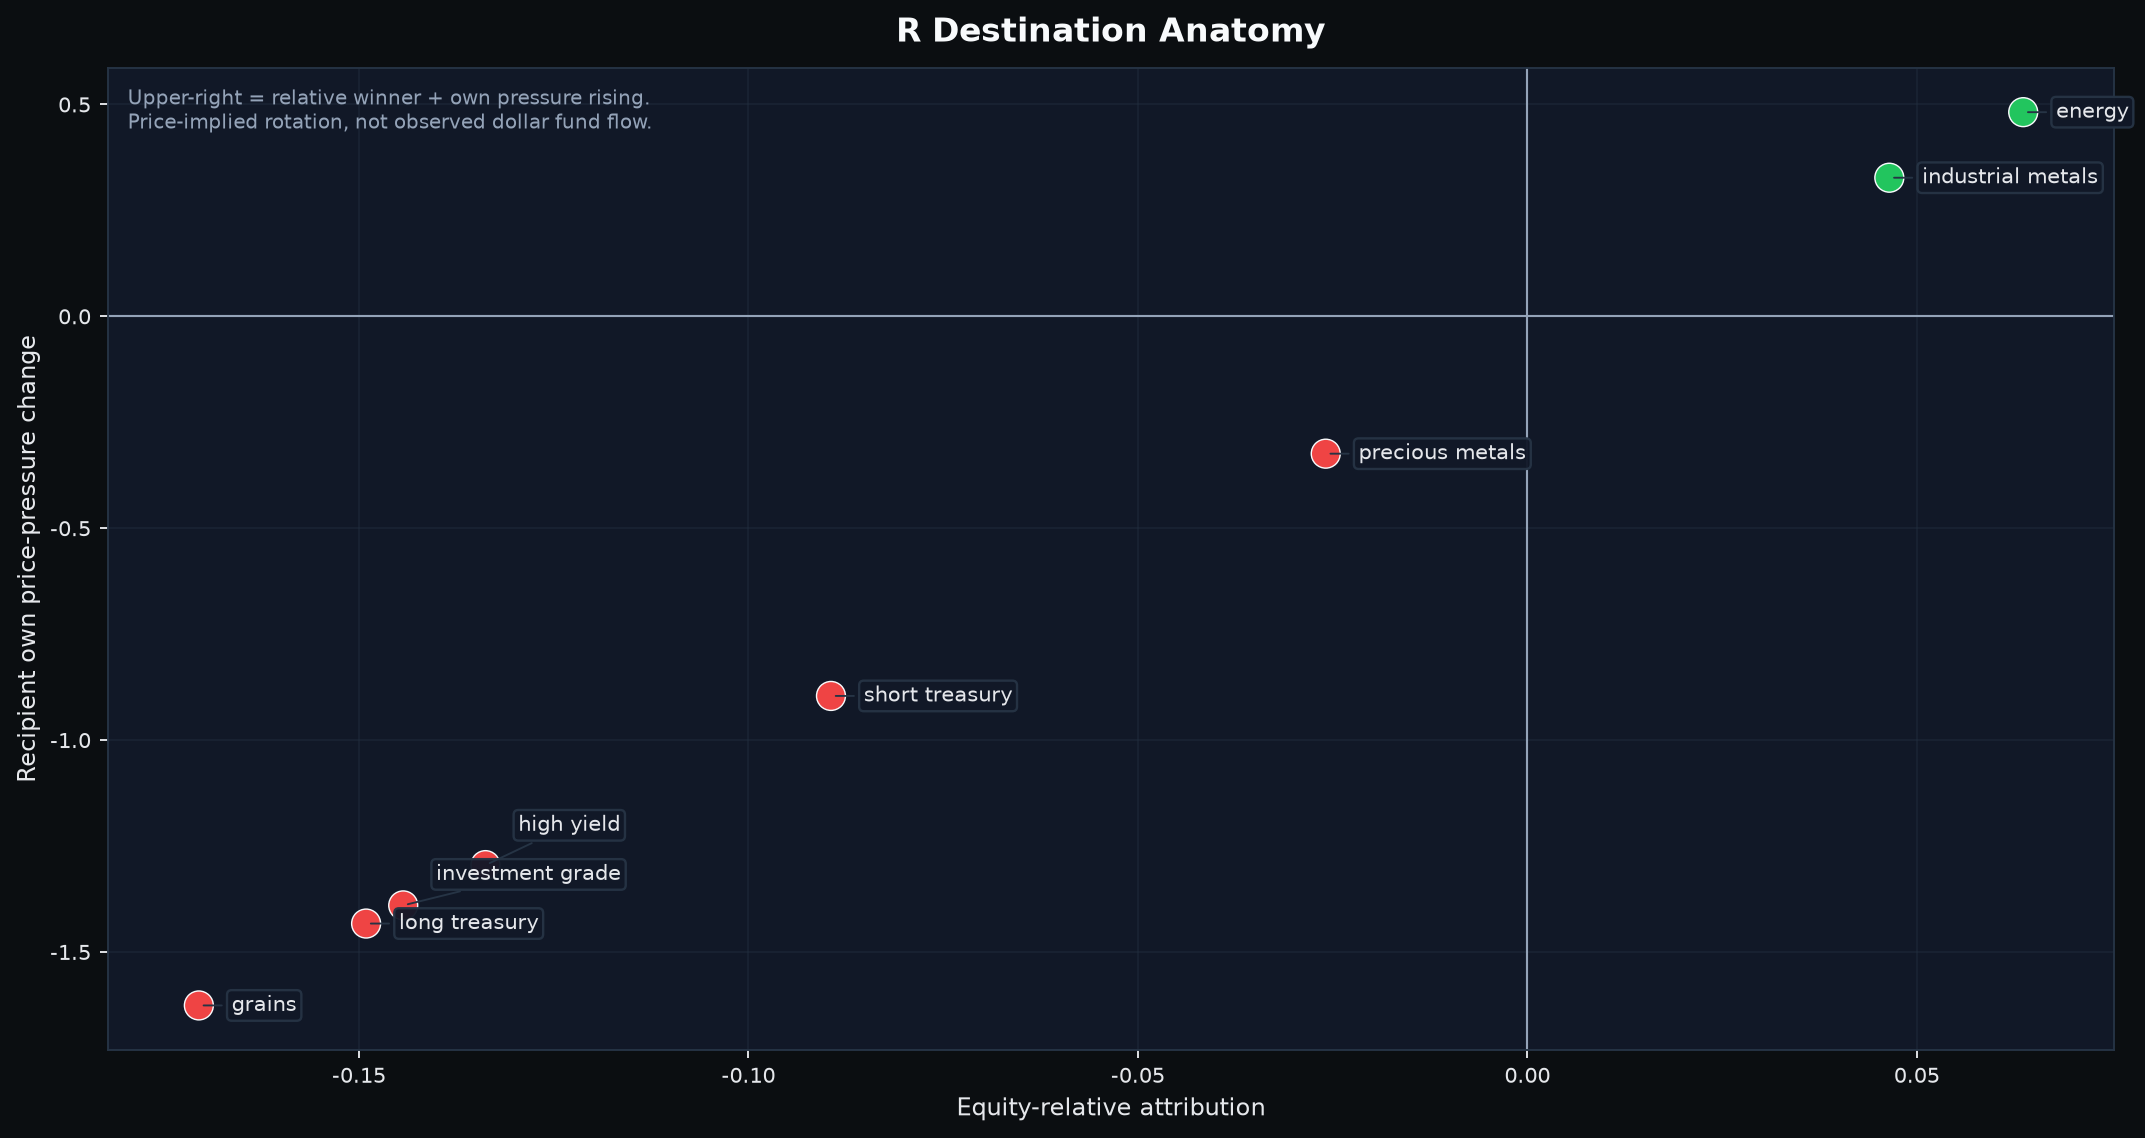
The coupling layer also argues against a simple “high K = risk-off” interpretation. Raw K is about 0.507, so roughly half of standardized cross-asset variation is captured by the leading common mode. Participation spans about 7.1 of 9 sleeves, the eigengap is elevated, and five-day mode stability is 0.995: this is a broad and coherent macro mode. Yet risk-mode alignment is only about +0.13, and equity contributes almost nothing to the 20-day increase in K. Precious metals, industrial metals, energy and long Treasuries account for most of the increase. The common mode is strong; its direction is not a classic equity-led liquidation regime.
CFTC positioning provides useful but lagged counterevidence. The September 15 snapshot is current under the normal weekly COT release schedule, but it predates the September 24 market close by seven trading days. Equity Asset Managers remain roughly +23% net long relative to open interest, yet that ratio fell about 4.76 percentage points over the latest four reports, a -1.36z change. Industrial-metals positioning weakened materially at about -1.59z even though industrial metals are now a positive relative-price destination, while Energy positioning offers only mild positive confirmation. Long-Treasury positioning is only slightly softer, around -0.11z. The latest futures snapshot therefore does not strongly confirm the newer price-implied rotation and should be treated as meaningful but lagged context, not a same-day veto.
4. Sector leadership: broader economic coverage, but technology remains two-sided
| Bull rank | Sector | Bear-risk rank | Balance state | Representative tickers | Public read |
|---|---|---|---|---|---|
| 1 | Enterprise Software & IT Services | 3 | TWO_SIDED_CONFLICT | ADBE, APLD, PATH, PANW, AKAM | Strong Bull leadership, but high Bear-risk keeps the group conflicted. |
| 2 | Autos & Mobility | 8 | BULL_DOMINANT | CVNA, RIVN, GM, F, TSLA | Bull-dominant current leadership, though selected names still need trend repair. |
| 3 | Semiconductors & Tech Hardware | 2 | TWO_SIDED_CONFLICT | STX, WDC, MPWR, SNDK, ALAB | AI/storage/power exposure is strong but sector downside risk is also elevated. |
| 4 | Metals & Mining | 18 | BULL_DOMINANT | B, CDE, FCX, NEM, HL | Cleaner dual-sided balance than technology, but selected price confirmation is mixed. |
| 5 | Internet, Media & Telecom | 4 | TWO_SIDED_CONFLICT | META, APP, TTD, GOOG, DIS | Leadership survives, but current selected-stock confirmation is absent and Bear-risk is high. |
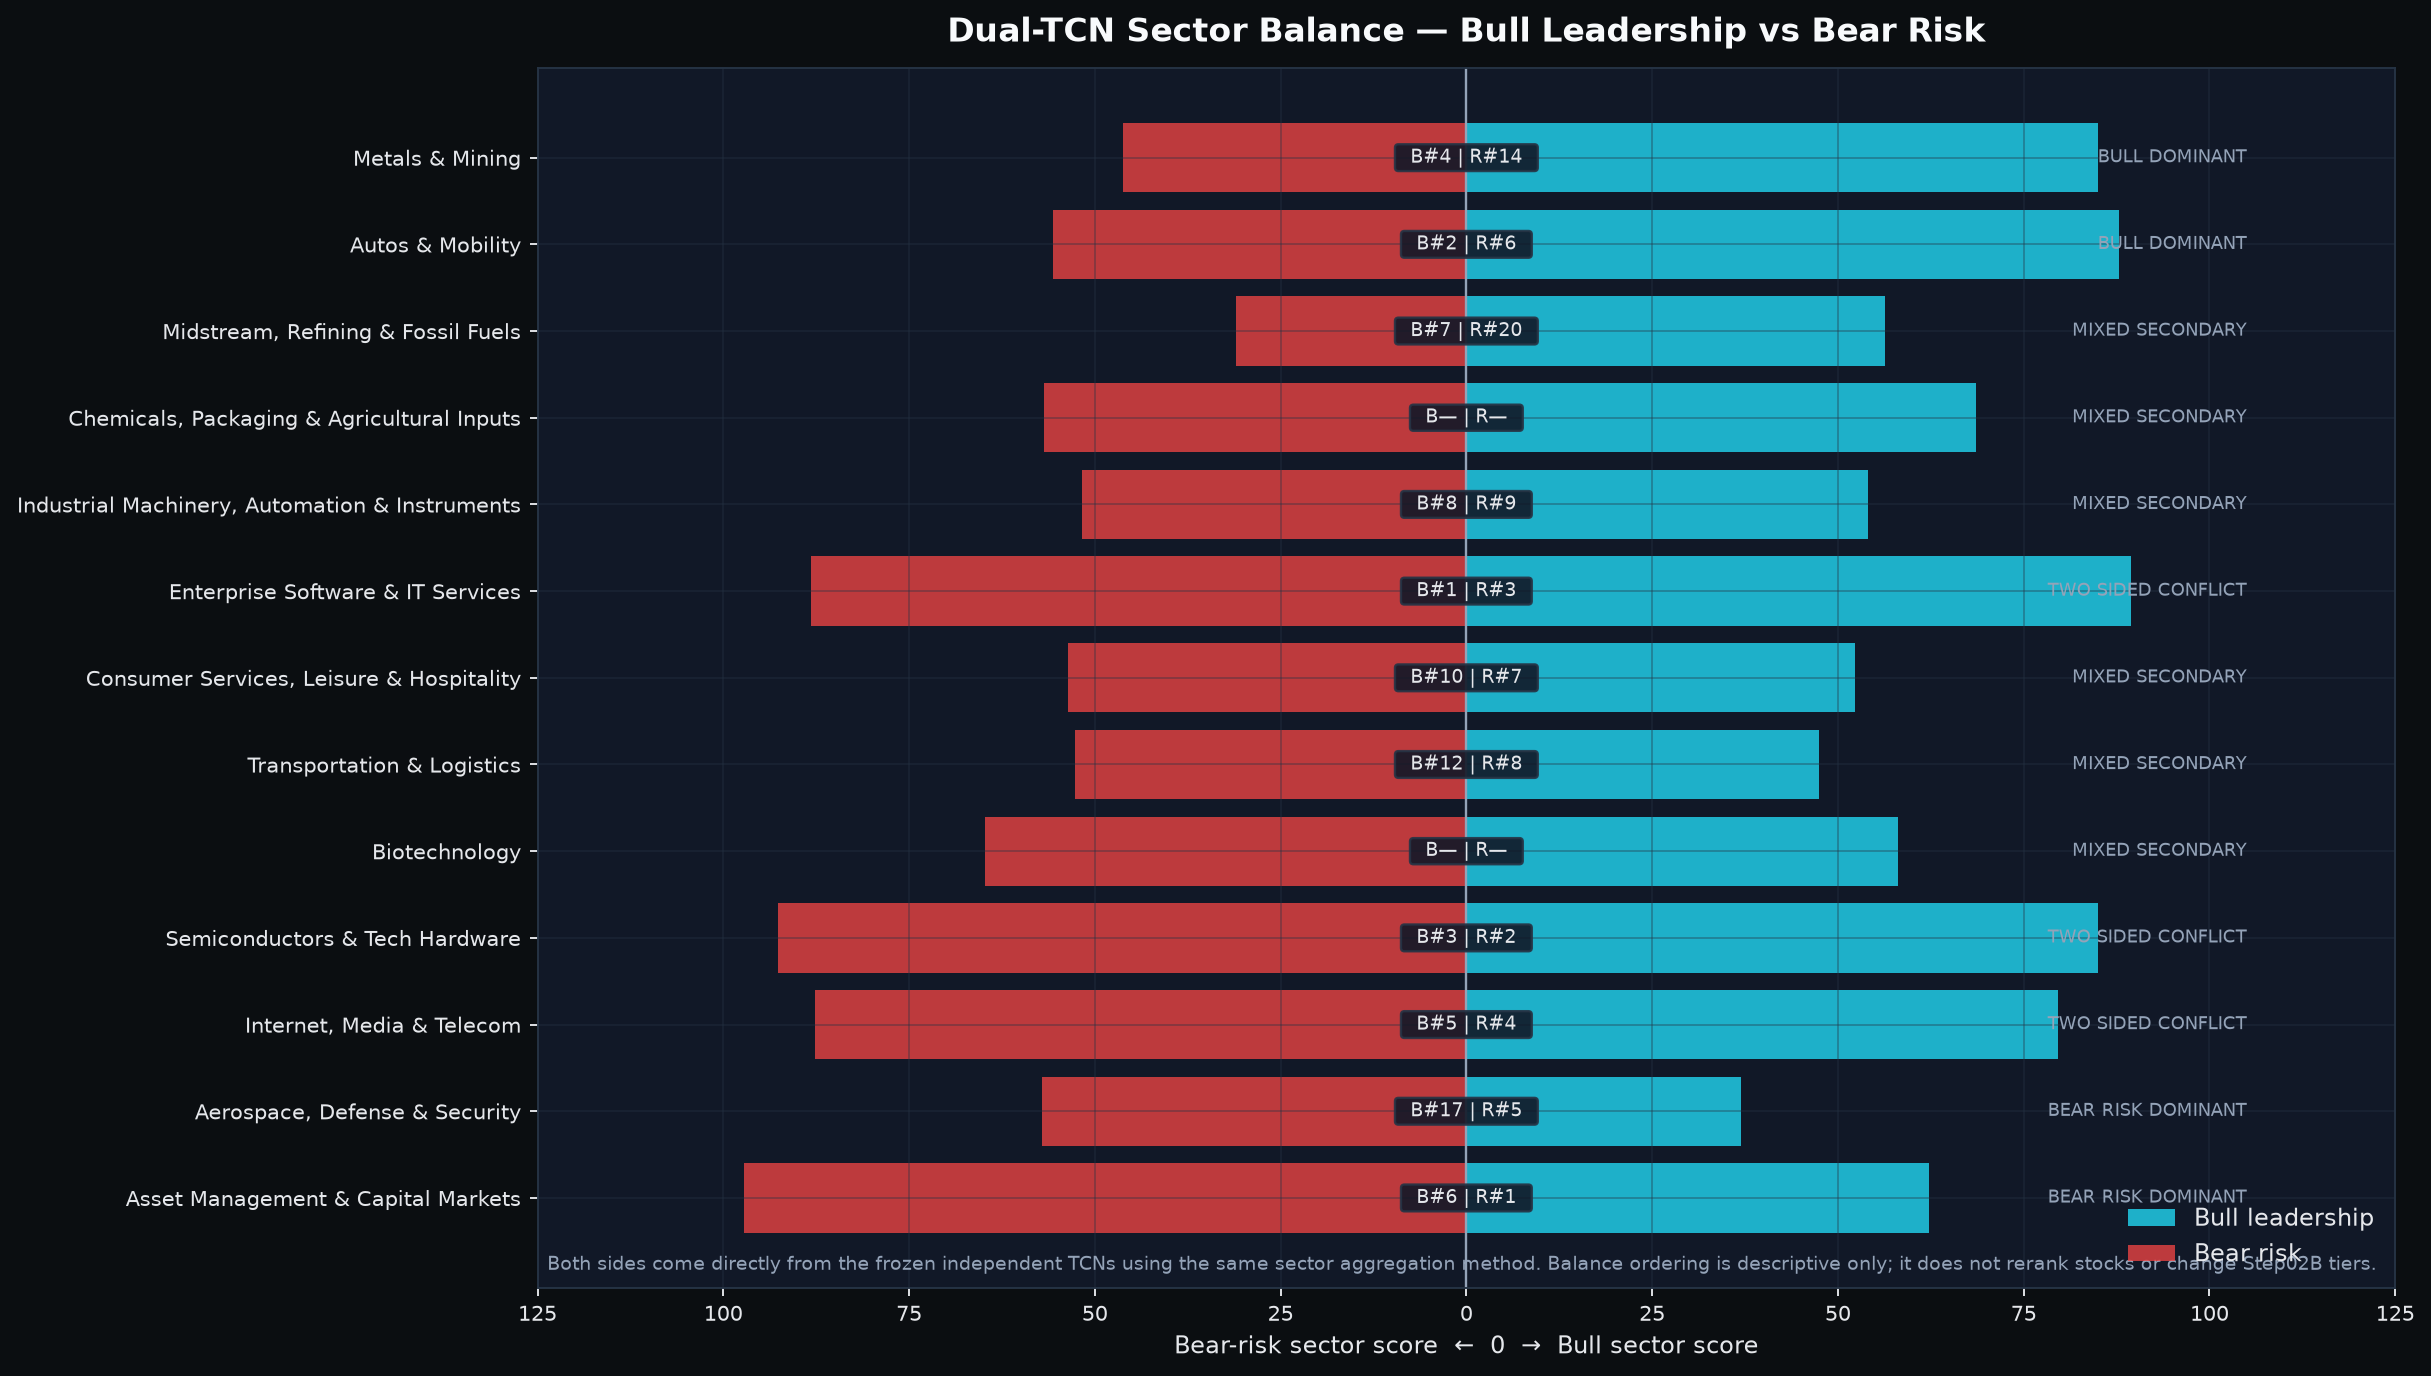
The sector transition is not a simple continuation of the prior session. Enterprise Software rose from #4 to #1, Autos entered at #2, Semiconductors held #3, Metals improved from #5 to #4, and Internet/Media fell from #1 to #5. Consumer Services exited the Top 5. That shift broadens the economic coverage of leadership, but it does not make the market uniformly healthy: Enterprise, Semiconductors and Internet/Media all remain highly ranked on the Bear side as well.
Economic anatomy of the Bull Top 5
| Sector | Current leading subcluster(s) | Key names | Economic linkage | Quant / price-support confirmation | Why now / public mechanism | Strongest counterevidence |
|---|---|---|---|---|---|---|
| Enterprise Software & IT Services | AI software + AI data-center infrastructure | ADBE, APLD | AI monetization and hyperscale compute spend link software demand and physical capacity. | ADBE/APLD both pass recent support; ADBE remains well below MA20 while APLD is modestly above. | Adobe AI-first ARR growth; APLD long-duration hyperscaler leases. | Bear-risk rank #3 and ADBE trend weakness prevent a clean sector-wide confirmation. |
| Autos & Mobility | Digital used-car retail + EV platform | CVNA, RIVN | Consumer mobility demand expressed through scalable digital retail and new EV product cycles. | Both pass fresh support, but CVNA is -8.2% and RIVN -2.6% vs MA20. | Carvana record unit/revenue growth; Rivian began external R2 deliveries. | Price trend has not yet caught up with the fundamental mechanisms. |
| Semiconductors & Tech Hardware | Storage + data-center power | STX, WDC, MPWR | AI workloads expand storage and power-density requirements. | All three are support-PASS; STX/MPWR are clearly above MA20, WDC sits almost exactly on MA20. | Seagate/WDC storage growth and MPS enterprise-data acceleration. | Bear-risk rank #2 makes this a powerful but two-sided leadership group. |
| Metals & Mining | Gold / diversified mining | B | Commodity cash generation and real-asset sensitivity. | B passes fresh support but remains -3.5% vs MA20. | Barrick Q2 cash flow and earnings strength. | Trend repair is incomplete and no comparable Financial rank is available. |
| Internet, Media & Telecom | AI monetization / digital platforms | META and peers; no selected stock | Digital platform AI monetization remains a public catalyst. | Current sector rank is strong, but none of today’s 8 selected names comes from the sector. | Meta AI product momentum helped the broader platform theme. | Bear-risk rank #4 and lack of selected-name support confirmation argue against extrapolating the sector score too broadly. |
The cross-sector synthesis is best described as multiple growth mechanisms operating under a common rate constraint. AI software, storage and power management are supported by company-level demand evidence; autos have separate operating catalysts; metals add a real-asset channel. But the fresh Real10-led shock and high Bear-risk ranks in technology mean leadership is selective rather than a clean market-wide endorsement.
5. Selected stocks: support is present, but trend and slow context disagree
| Stock | Sector | Selection tier / role | Bull rank (of 294) | Bear rank (of 294) | Recent support confirmation | Distance to live S1 | Price trend |
|---|---|---|---|---|---|---|---|
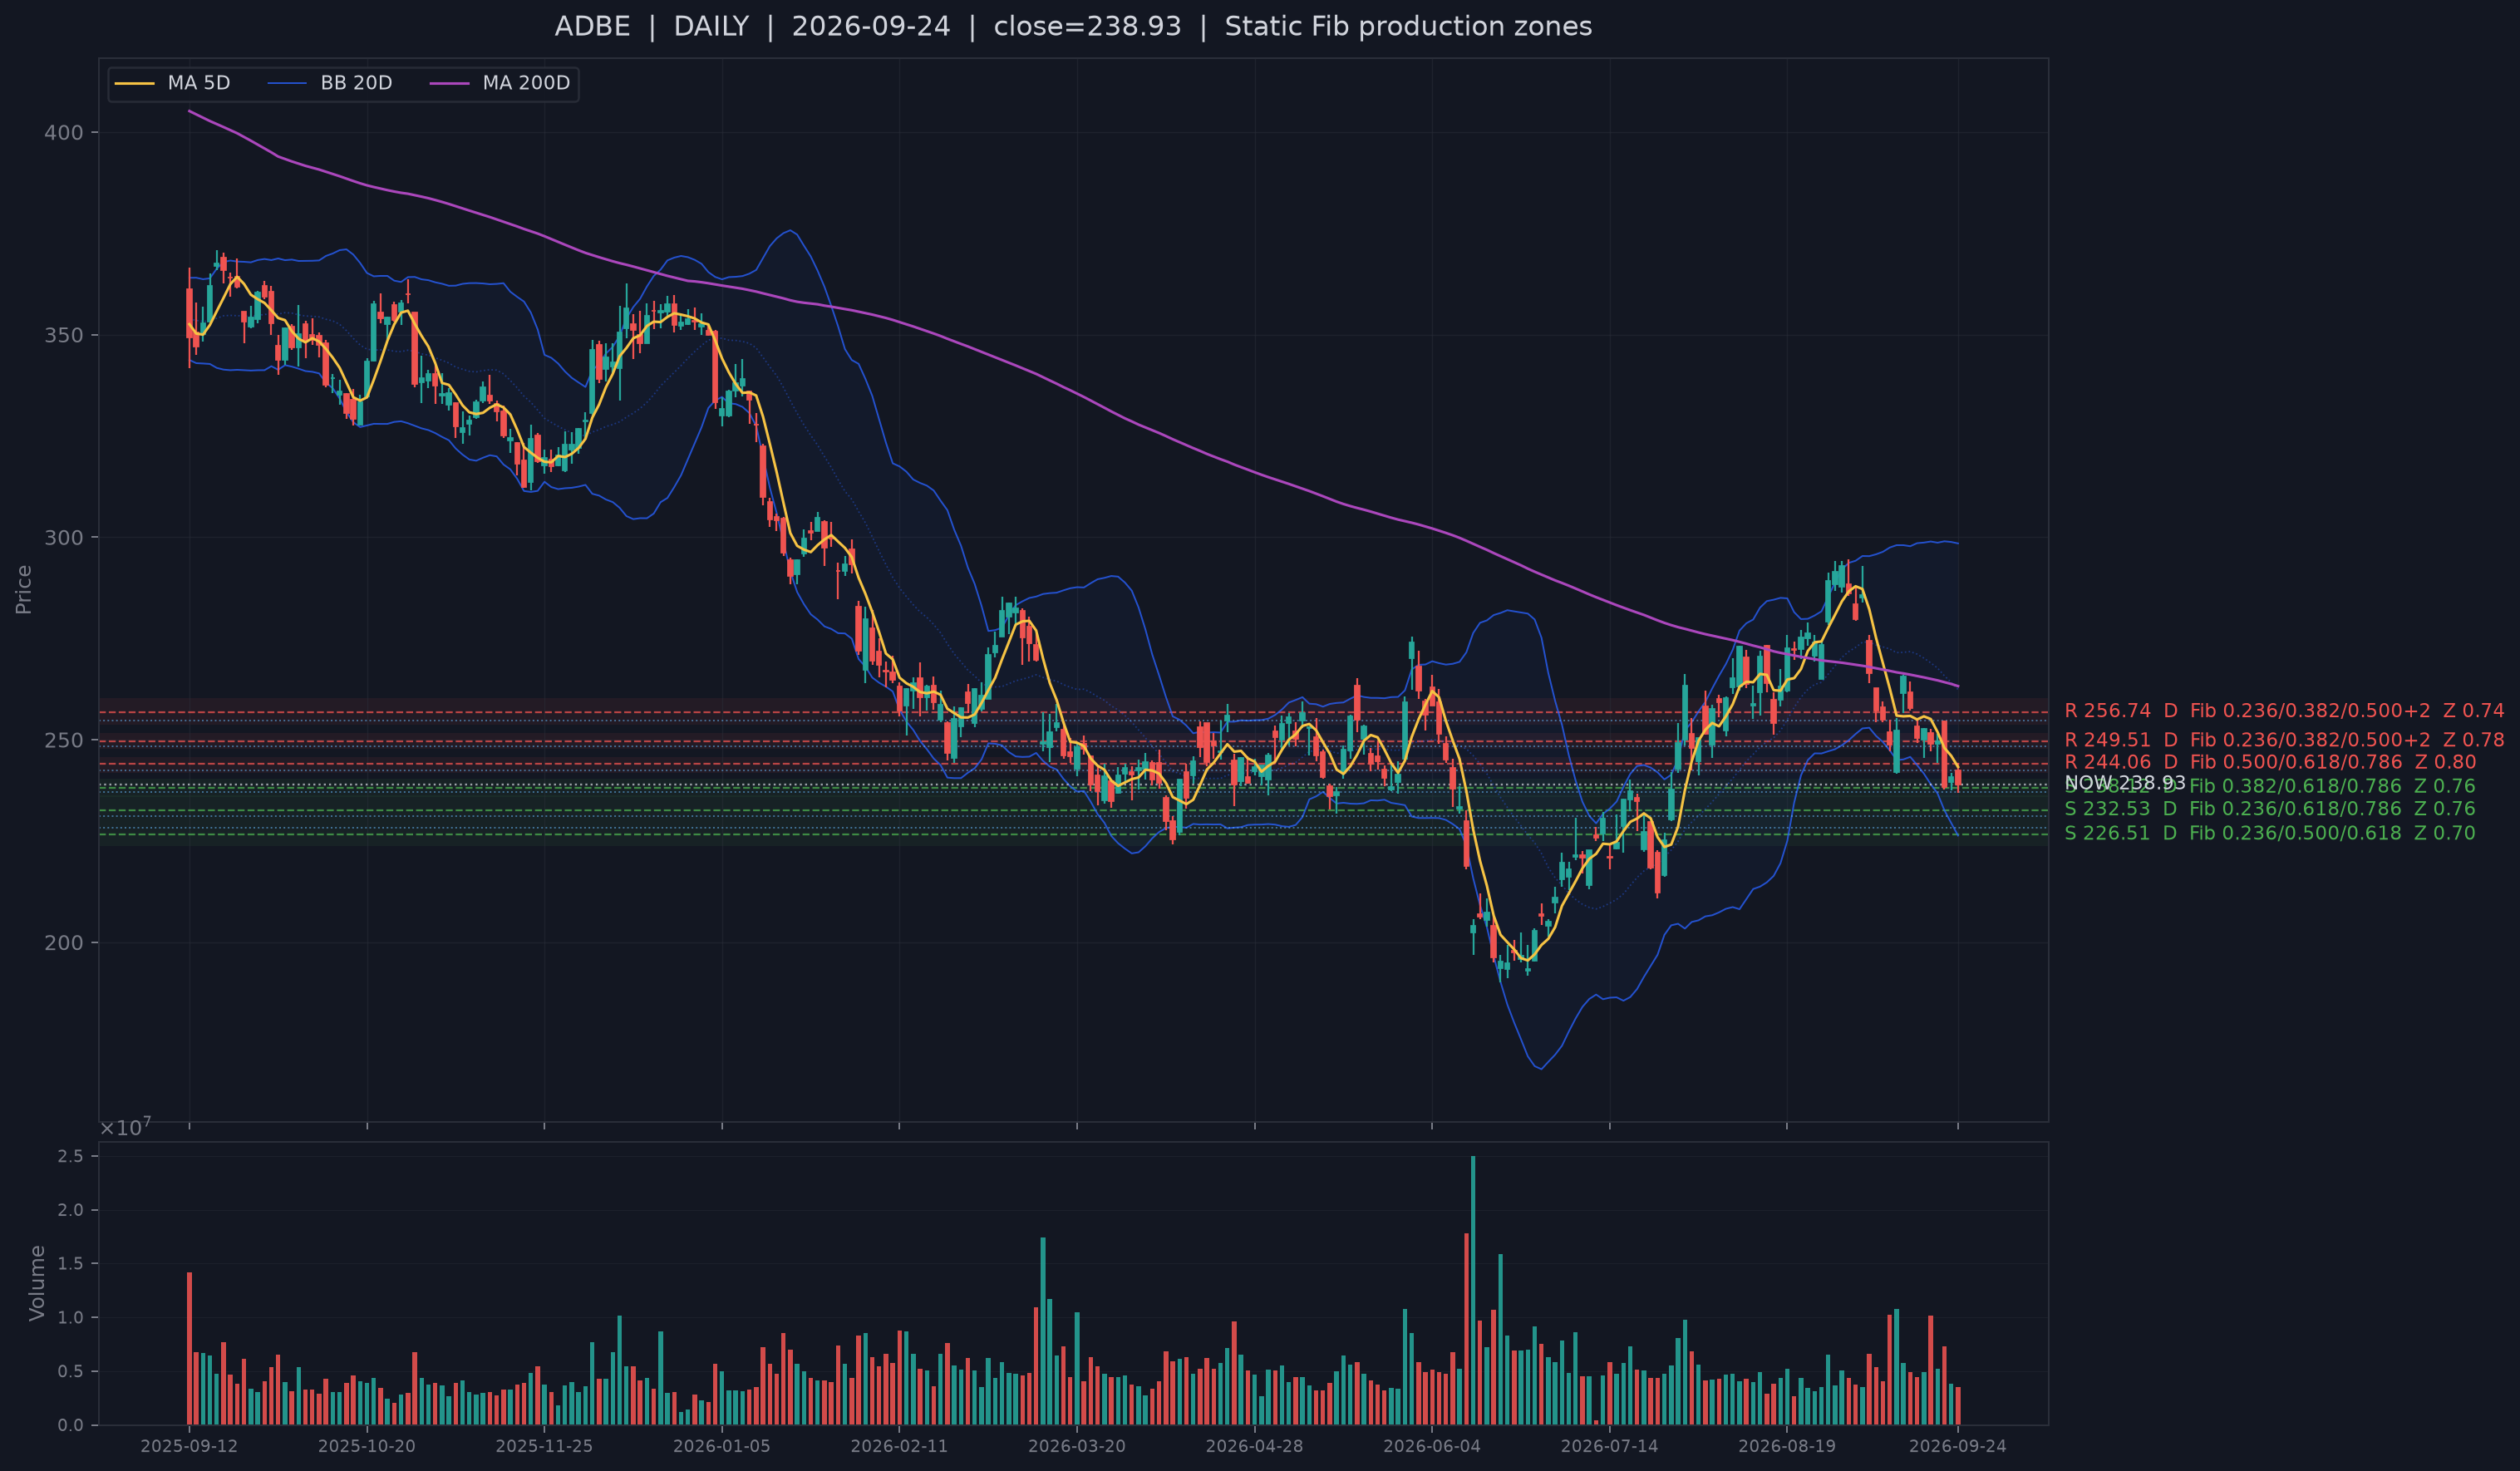
| ADBE | Enterprise Software & IT Services | A Bull screen | #11 of 294 | #193 of 294 | bullish center reclaim, 1 TD ago | 0.34% / 0.08 ATR | MA5 -1.8% / MA20 -8.9% |
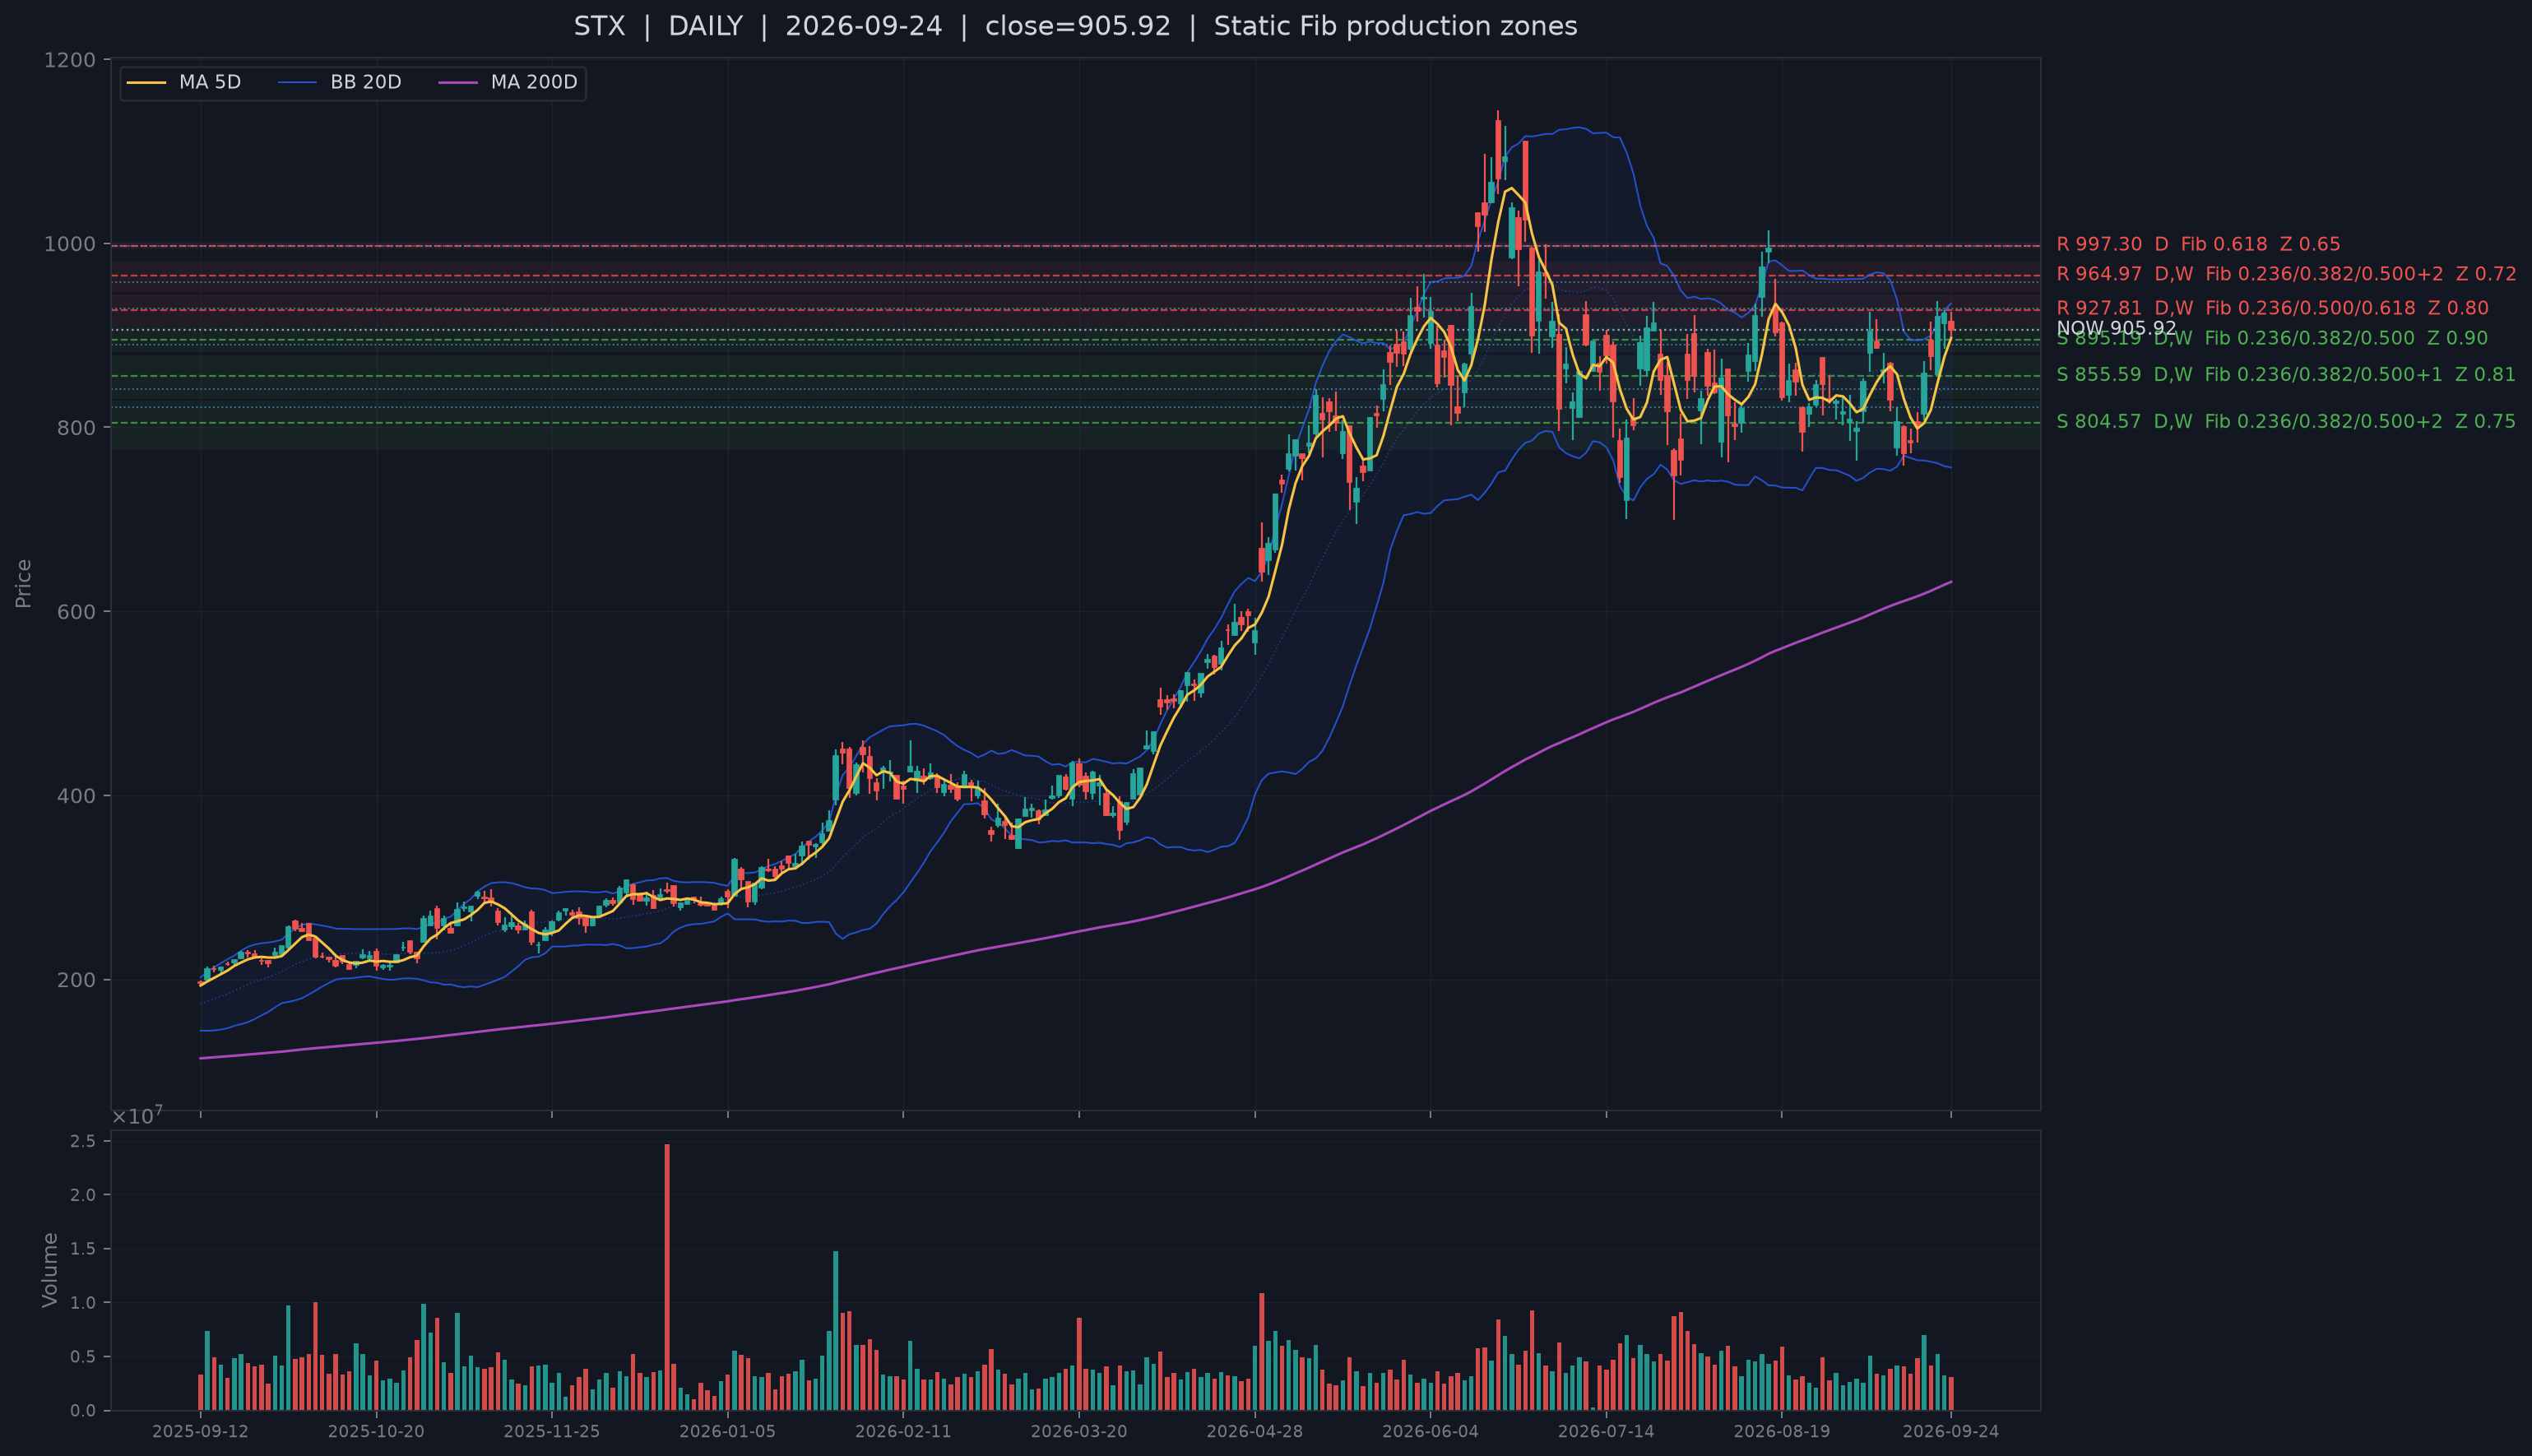
| STX | Semiconductors & Tech Hardware | A+ Bull screen | #9 of 294 | #86 of 294 | bullish center reclaim, 1 TD ago | 1.20% / 0.21 ATR | MA5 +1.0% / MA20 +7.1% |
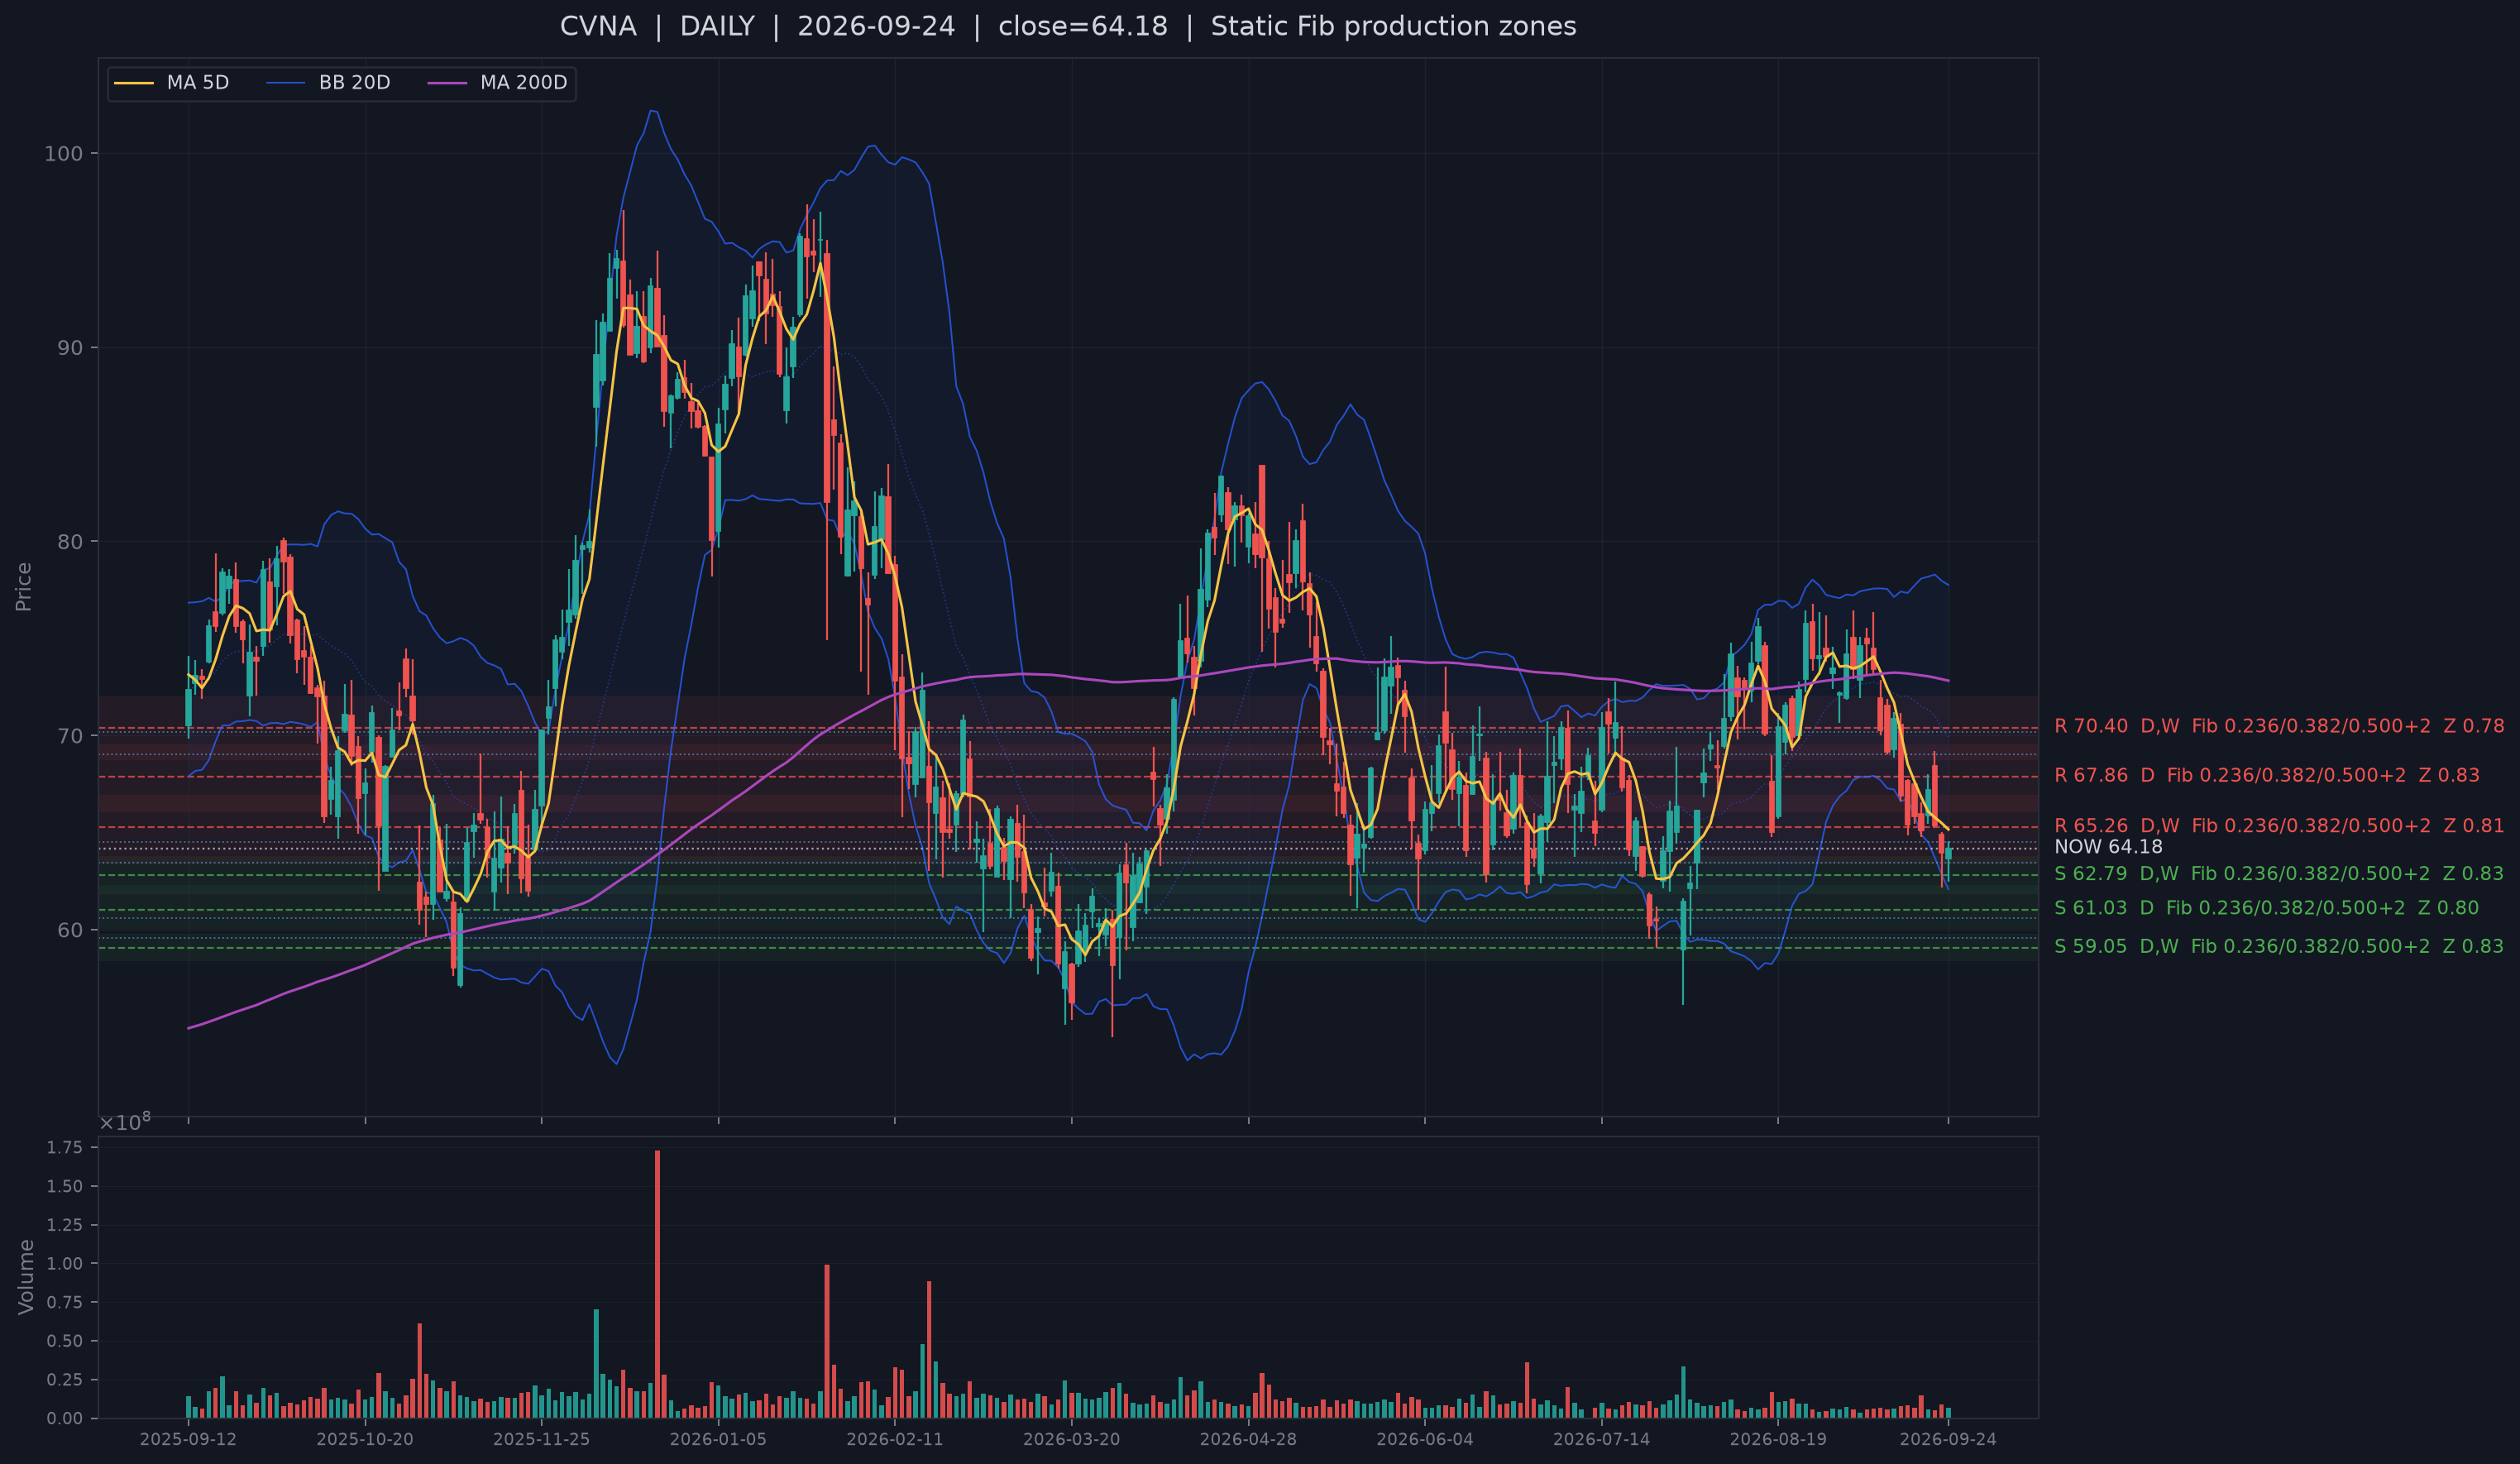
| CVNA | Autos & Mobility | B Bull screen | #20 of 294 | #151 of 294 | bullish center reclaim, same day | 2.21% / 0.44 ATR | MA5 -1.5% / MA20 -8.2% |
| APLD | Enterprise Software & IT Services | B Bull screen | #30 of 294 | #98 of 294 | bullish center reclaim, same day | 3.75% / 0.56 ATR | MA5 -2.8% / MA20 +3.0% |
| B | Metals & Mining | B Bull screen | #22 of 294 | #153 of 294 | bullish center reclaim, same day | 1.99% / 0.58 ATR | MA5 -1.4% / MA20 -3.5% |
| WDC | Semiconductors & Tech Hardware | A+ Bull screen | #6 of 294 | #74 of 294 | next-day wick reclaim, 2 TD ago | 4.71% / 0.71 ATR | MA5 -1.2% / MA20 +0.0% |
| RIVN | Autos & Mobility | B Bull screen | #21 of 294 | #59 of 294 | bullish center reclaim, same day | 3.82% / 0.82 ATR | MA5 +0.9% / MA20 -2.6% |
| MPWR | Semiconductors & Tech Hardware | A+ Bull screen | #8 of 294 | #42 of 294 | bullish center reclaim, 3 TD ago | 4.07% / 0.91 ATR | MA5 +1.7% / MA20 +8.0% |
The ordering above is preserved exactly from the current support-confirmed list. Public facts and slower context can explain the names, but they do not change membership or order.
ADBE is the closest support name and the clearest “support is not trend repair” case. It is only 0.08 ATR from live S1, but the close is 8.9% below MA20. Adobe’s September 10 results provide a credible AI mechanism—AI-first ARR grew more than 150% year over year and monthly active users passed one billion—but the slower quantitative layers disagree sharply: Financial rank is 0.80 while delayed holdings rank is only 0.20. The setup therefore needs price repair, not a narrative rescue.
STX is the cleaner transmission control. It is 0.21 ATR from live support and 7.1% above MA20, while both slower layers are strong. Seagate’s fiscal Q4 revenue of roughly $3.6 billion and structural AI/data-storage demand reinforce the mechanism without overriding the price signal. This is what agreement across support, trend and slower context looks like.
CVNA is the fresh-support but weak-trend control. The same-day reclaim is valid, yet the stock remains 8.2% below MA20 and both slower ranks are weak. Carvana’s record Q2 unit growth, revenue and profitability show that the operating story is not empty, but a strong company print does not complete the market repair. RIVN sits in the same broader Autos leadership group with a less severe MA20 gap; its external R2 deliveries and improving gross profit create a different company mechanism, but price confirmation still matters.
Within AI infrastructure, APLD, WDC and MPWR offer three different confirmation patterns. APLD is modestly above MA20 and supported by long-duration hyperscaler leases, but its Financial rank is weak. WDC is almost exactly on MA20 while both slow layers are strong; its revenue and free-cash-flow acceleration make it a useful storage confirmation case. MPWR is the strongest clean-trend example, 8.0% above MA20 with both slower ranks above median, while enterprise-data revenue grew sharply as AI power density became a larger end market.
Barrick is the real-asset counterexample. B is close to support but still 3.5% below MA20. Q2 operating cash flow and earnings improved strongly, yet comparable current Financial ranking is unavailable. The correct conclusion is not to fill the missing rank with a story; it is to keep the operating evidence as slower context while requiring the support hold to translate into price.
Slower context is confirmation or counterevidence, not a ranking override
| Stock | Financial context | Delayed institutional-holdings context |
|---|---|---|
| ADBE | Financial rank 0.80; price divergence -0.15 | Delayed 13F rank 0.20; price divergence -0.47 |
| STX | Financial rank 1.00; positive | Delayed 13F rank 0.81; positive |
| CVNA | Financial rank 0.22; price divergence -0.02 | Delayed 13F rank 0.05; price divergence -0.21 |
| APLD | Financial rank 0.19; price divergence +0.37 | Delayed 13F rank 0.44; price divergence +0.43 |
| B | Financial context not available from comparable current sources | Delayed 13F rank 0.61; price divergence -0.14 |
| WDC | Financial rank 0.98; price divergence +0.57 | Delayed 13F rank 0.73; price divergence +0.53 |
| RIVN | Financial rank 0.12; price divergence -0.02 | Delayed 13F rank 0.25; price divergence -0.04 |
| MPWR | Financial rank 0.68; price divergence +0.44 | Delayed 13F rank 0.78; price divergence +0.62 |
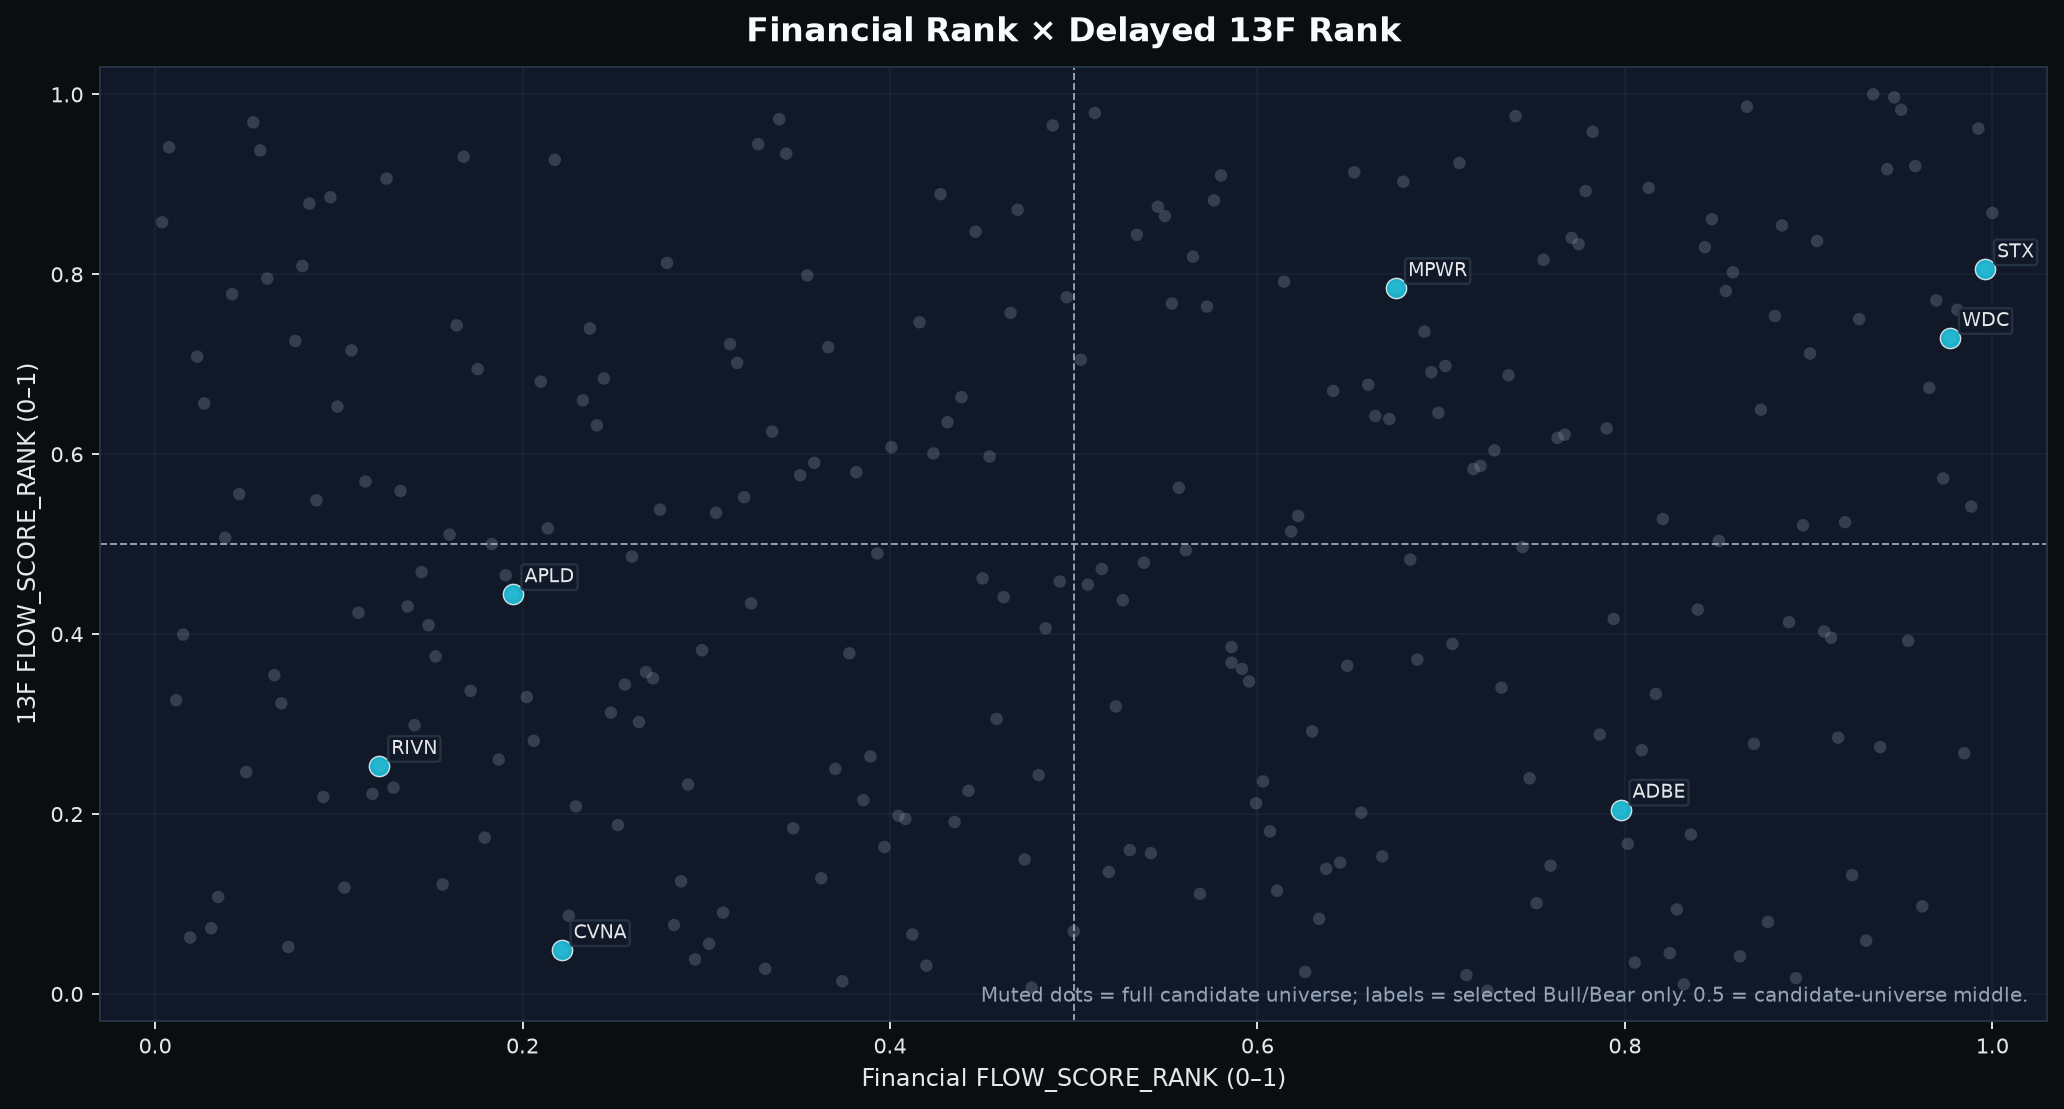
Most comparable institutional-holdings snapshots became available in May or early June 2026, so they are multi-month context rather than a current-flow measure. The clearest disagreements are ADBE, where Financial context is strong but delayed holdings are weak, and APLD, where price divergence is positive even though the absolute Financial rank is low. STX, WDC and MPWR offer stronger agreement. The current bundle has no selected-name price-path and risk-context overlap, so that secondary layer is unavailable/neutral rather than silently inferred from historical variables.
6. Base case, confidence and falsification
Base case (3-10 trading days): selective upside can persist, but the market now carries a high confirmation burden. Confidence is moderate. Indexes remain above MA20 and several selected names show constructive support-to-trend transmission. But breadth remains weak, the 252-day new-low tail is severe, technology leadership is two-sided, and the newest macro impulse is a fresh Real10-led tightening shock.
What strengthens the thesis: Aggressor and Alignment reclaim 50 early and hold it; breadth moves back toward balance; 252-day new-low pressure stabilizes without a rise in down-3% breadth or dispersion; and weak-trend support names such as ADBE, CVNA, B and RIVN begin repairing toward MA20.
What invalidates it: another close with Aggressor and Alignment below neutral combined with a broader rise in new lows, large-decline breadth or dispersion, plus multiple live-S1 failures among the selected names. That would turn today’s weak-tail deterioration into a more convincing propagation signal.
Sources
- Reuters via Fidelity (2026-09-24) - S&P 500 near-flat close; Middle East uncertainty lifted oil and Treasury yields; Meta rose after an AI-device launch; New York Fed President John Williams said another rate hike this year was reasonable.
- Adobe / SEC (2026-09-10) - Adobe reported record Q3 results, AI-first ARR growth above 150% year over year and more than one billion monthly active users.
- Seagate / SEC (2026-07-28) - Seagate reported fiscal Q4 revenue of about $3.6B and described AI-driven data creation as a structural storage-demand support.
- Carvana (2026-07-29) - Carvana sold 197,325 retail units, up 38% year over year, on $7.376B of revenue, up 52%, with record quarterly profitability.
- Applied Digital (2026-06-08) - Applied Digital signed a 210 MW, 15-year take-or-pay lease at Delta Forge 2, bringing base-term contracted portfolio revenue to about $36B.
- Barrick Mining (2026-08-10) - Barrick reported Q2 operating cash flow of $1.70B, up 28% year over year, net earnings up 50%, and gold production of 796,000 ounces.
- Western Digital (2026-08-05) - Western Digital reported Q4 revenue of $3.75B, up 44% year over year, and $1.28B of free cash flow, with continued cloud-storage demand.
- Rivian / SEC (2026-07-30) - Rivian began external R2 deliveries and reported $1.658B of revenue, up 27%, with $179M of gross profit.
- Monolithic Power Systems / SEC (2026-07-30) - MPS reported $980.6M of Q2 revenue, up 47.6% year over year; Enterprise Data revenue grew 164.3% year over year.
- CFTC (2026-09-15) - Weekly Commitments of Traders positioning used only as lagged positioning context; the September 15 snapshot is current under the normal release schedule but seven trading days behind the September 24 close.
Methodology / horizon note
This note uses private quantitative evidence to define the research question first, then public facts to test mechanisms and counterevidence. Sector and stock ranks are not changed by news. Relative cross-asset destinations are price-implied, not observed fund flows. Delayed holdings and CFTC positioning are slower context. The 3-10 trading-day horizon is intentional; the conclusions may not transfer to intraday trading or longer-horizon investing.