Price Trend Held, but Breadth and Late Order Flow Fractured Again
Major indexes remain above MA5/MA20, but breadth weakened, new-low damage rose and all three market-wide order-flow axes closed below neutral. Leadership remains selective and technology is two-sided.
Horizon: 3-10 trading days.
This research is designed for 3-10 trading-day swing setups. The signals and conclusions may not transfer to intraday trading or longer-horizon investing.
Price Held Above Trend, but Breadth and Late Order Flow Fractured Again
The index trend is still constructive, but the internal burden rose sharply. The S&P 500 and Nasdaq remain above both MA5 and MA20, yet breadth slipped to 0.425 while 20-day and 252-day new-low pressure rose to +1.12z and +1.95z. That is not broad liquidation: the share of stocks down 3% is only +0.47z and cross-sectional volatility is actually subdued at -1.14z. But the combination says the surface trend is stronger than the underlying participation.
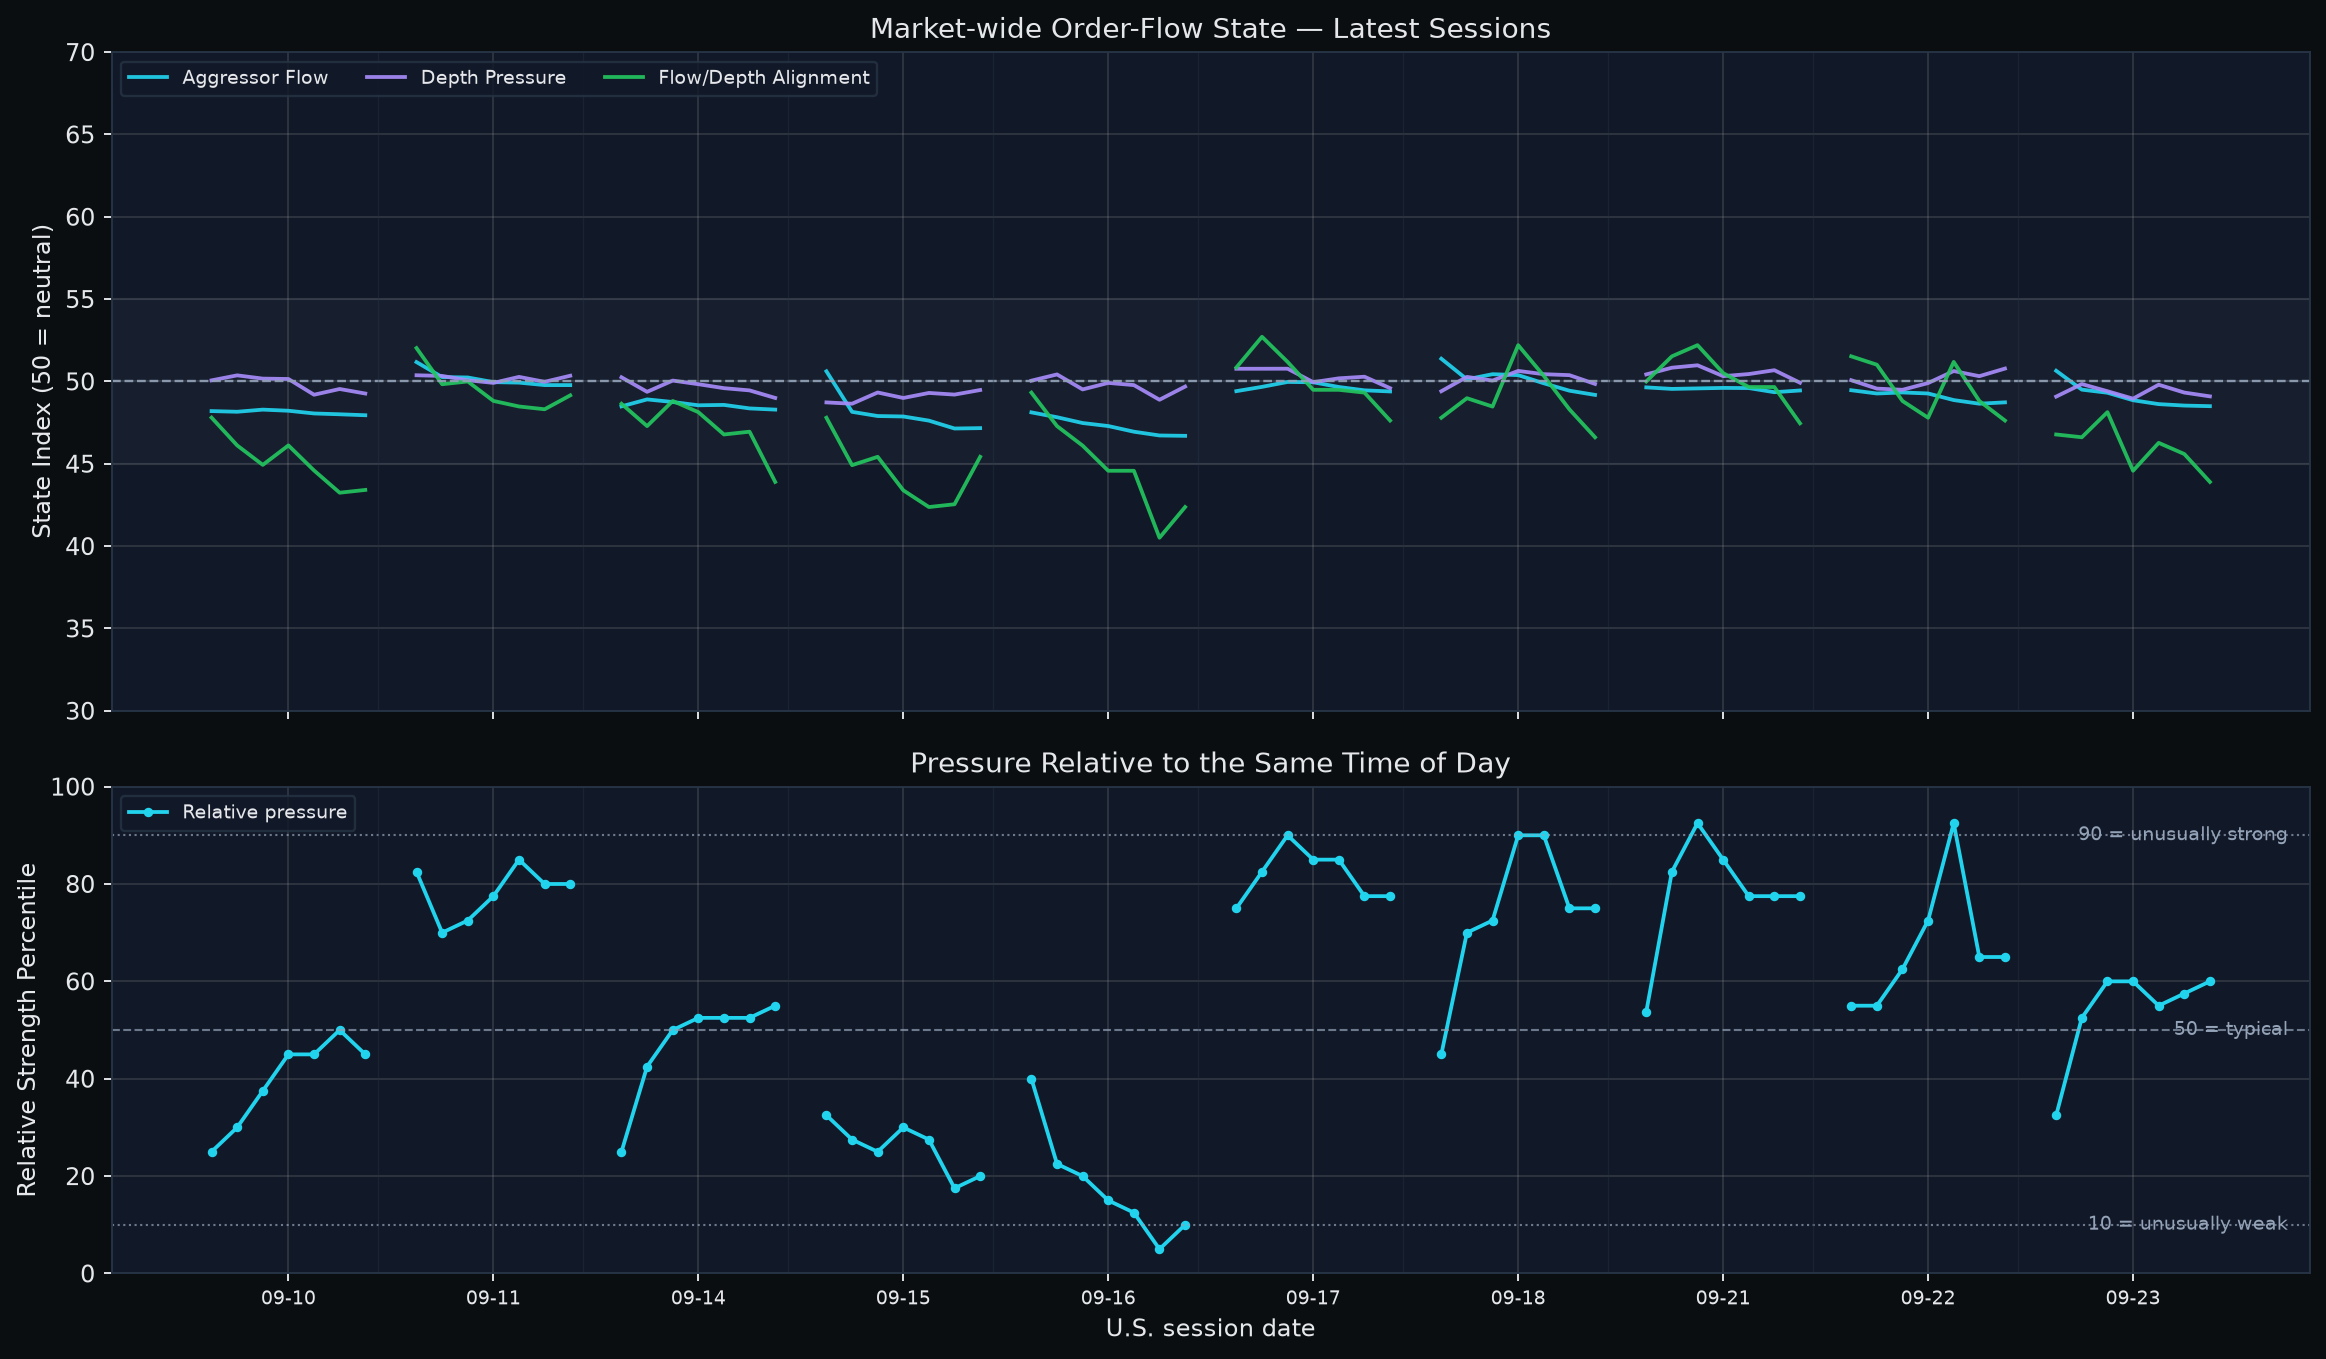
The market-wide order-flow path makes the same point from a different angle. Aggressor Flow opened slightly above 50 at 50.65, then fell below neutral at 10:30 and never recovered. Depth Pressure never reached 50 at any checkpoint. Alignment improved only to 48.14 at 11:30 before breaking down; the final three bars deteriorated across all three axes and the close printed 48.50 / 49.09 / 43.90. Equal-weight price also lost 0.18% from open to close. This is late deterioration below neutral, not a failed-but-constructive repair attempt.
My base case is therefore selective leadership inside a weakening internal tape, not a completed market breakdown. The new-low tail is real, price-of-money conditions remain tight, and technology leadership is two-sided. The counterweight is that the indexes have not lost trend and the more severe damage legs have not synchronized. The next session has a high repair burden: a constructive reset needs an early, sustained reclaim of Aggressor, Depth and especially Alignment, with breadth and equal-weight price confirming rather than diverging.
How to read today's indicators
| Indicator | Reader scale | Interpretation |
|---|---|---|
| Market-wide order-flow state | Three component indices; 50 = neutral | Aggressor Flow, Depth Pressure and Flow/Depth Alignment answer different questions. Read confirmation/divergence across the three; they are not probabilities. |
| Same-time order-flow percentile | 0-100; 50 = same-time historical median | 90 is unusually strong and 10 unusually weak for that intraday slot. This is historical context, not event probability. |
| Flow × depth state breadth | Cross-sectional percentages | Bull/Bear aligned show joint direction; absorption states describe compatible divergence only, not proven actor intent. |
| Market breadth | 0-1; practical balance ~0.50 | Above 0.50 means broader participation. Direction and slope show whether participation is improving or fading. |
| z-score | 0 = historical mean | |z| ~1 is notable and |z| ~2 is unusual. It is standardized distance, not probability. |
| Historical percentile | 0-100; 50 = median | 90+ is historically elevated. A percentile is not an event probability. |
| FLOW_SCORE_RANK | 0-1; 0.50 = median | 0.80+ is relatively strong slow context. It is confirmation/context, not a standalone entry signal. |
| Financial / 13F price divergence | Approx. -1 to +1; 0 = little gap | Positive means slow context is ahead of price; negative means price is ahead. ±0.20 / ±0.50 are reader bands only, not learned thresholds. |
| Expected next-session range | Non-directional high-low amplitude | Always pair the raw estimate with its same-day cross-sectional percentile. It is not an upside target. |
1. Price, breadth and damage: trend survives, participation does not fully confirm
| Layer | Current reading | Interpretation |
|---|---|---|
| S&P 500 | +0.02% vs MA5; +0.46% vs MA20 | Close in lower 17% of daily range |
| Nasdaq Composite | +0.33% vs MA5; +1.97% vs MA20 | Close in lower 18% of daily range |
| Breadth | 0.425; 5TD change +0.164 | 20TD slope z -0.14 |
| Downside damage | 20D new-low z +1.12; 252D new-low z +1.95 | Down-3% z +0.47; dispersion z -1.14 |
| Cross-asset state | Price-of-money warning feature +2.67z; coupling +0.96z | R +1.38z; credit -0.67z; duration +0.38z; liquidity +0.57z |
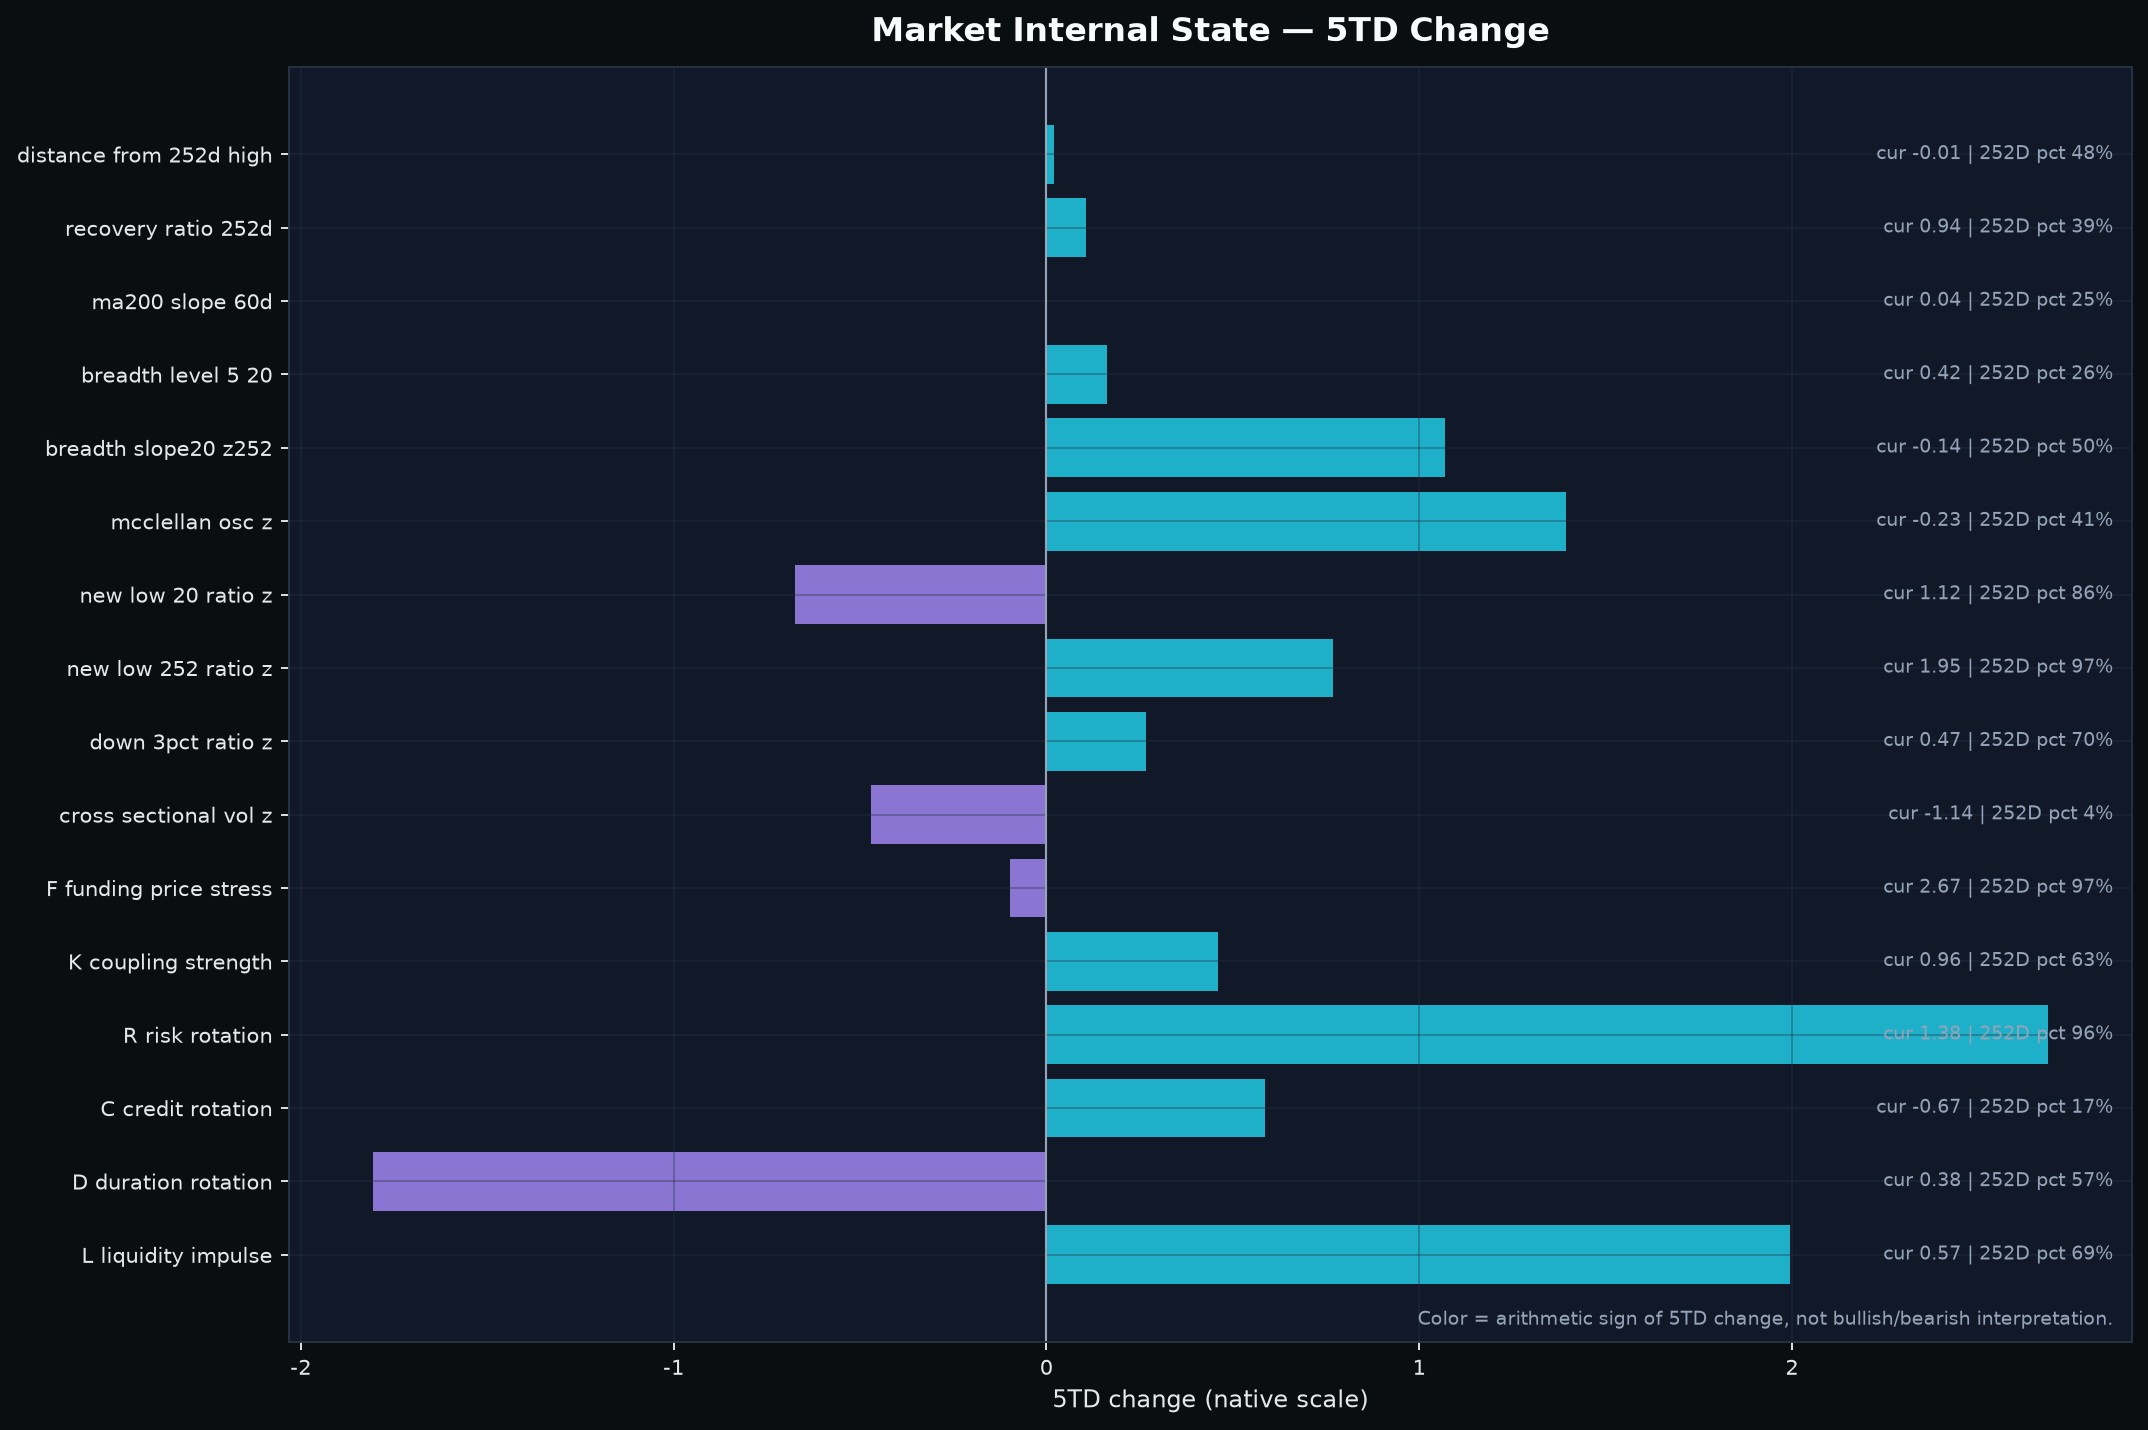
The price/breadth split is more important than either number alone. Both indexes remain above MA20, so this is not yet a trend failure. Breadth at 0.425, however, is below balance and the new-low measures are now visibly elevated. The 252-day new-low z-score at +1.95 is near a historically unusual zone even as down-3% breadth and cross-sectional volatility remain much calmer. The cleanest reading is localized deterioration at the weak end of the market before broad liquidation has appeared.
Price-of-money pressure remains historically elevated, but this is not a fresh tightening shock. Raw F is +0.415, equivalent to about +41.5 bp of 20-trading-day tightening in the blended measure; its weighted contributions are +27 bp from the 2Y component and +14.5 bp from the approximate 10Y real-rate component. The current five-day F shock is near neutral at -0.14z. The last extreme tightening impulse occurred on September 16, five trading days ago, at +2.77z and was 2Y-led, so the market is still inside that earlier transmission window rather than experiencing a newly accelerating rate shock. Liquidity impulse is positive, but credit rotation remains weak; persistent discount-rate pressure therefore raises the hurdle for breadth to broaden without independently invalidating the still-positive index trend.
2. Order flow: the opening bid failed, and the close inherited a high repair burden
| Time | Aggressor | Depth | Alignment | Same-time pct | Bull aligned | Bear aligned | Buy absorption | Sell absorption | EW bar return |
|---|---|---|---|---|---|---|---|---|---|
| 09:30 | 50.65 | 49.08 | 46.78 | 32.5 | 12.2% | 18.6% | 13.2% | 19.7% | -0.005% |
| 10:30 | 49.50 | 49.84 | 46.61 | 52.5 | 10.8% | 17.6% | 15.3% | 20.0% | +0.003% |
| 11:30 | 49.31 | 49.41 | 48.14 | 60.0 | 14.6% | 18.3% | 18.3% | 16.9% | -0.001% |
| 12:30 | 48.86 | 48.95 | 44.58 | 60.0 | 10.8% | 21.7% | 14.6% | 15.3% | -0.002% |
| 13:30 | 48.62 | 49.80 | 46.27 | 55.0 | 12.5% | 20.0% | 15.9% | 10.2% | +0.000% |
| 14:30 | 48.54 | 49.33 | 45.59 | 57.5 | 10.5% | 19.3% | 18.0% | 11.5% | -0.001% |
| 15:30 | 48.50 | 49.09 | 43.90 | 60.0 | 9.8% | 22.0% | 16.3% | 10.5% | -0.001% |
The path matters. At the open, Aggressor Flow was 50.65 while Depth and Alignment were already below neutral. By 10:30 Aggressor had lost 50. The 11:30 bar produced the best Alignment reading of the day at 48.14, still below neutral. From 13:30 through the close, Aggressor slipped, Depth gave back its modest improvement, and Alignment fell from 46.27 to 43.90. Bull-aligned breadth contracted to 9.8% while Bear-aligned breadth rose to 22.0%.
The same-time percentile rose from 32.5 at the open to 60 at the close, which is useful counterevidence: the close was weak in absolute state but not historically extreme for that time of day. That distinction prevents a regime call from a single path. Still, all three state axes closed below 50 and the final-hour breadth confirmation was bearish. The burden for September 24 is therefore not simply “green futures”; it is a sustained neutral reclaim that survives beyond the opening impulse.
3. Cross-asset: equity relative preference improved, but energy was the only non-equity positive destination
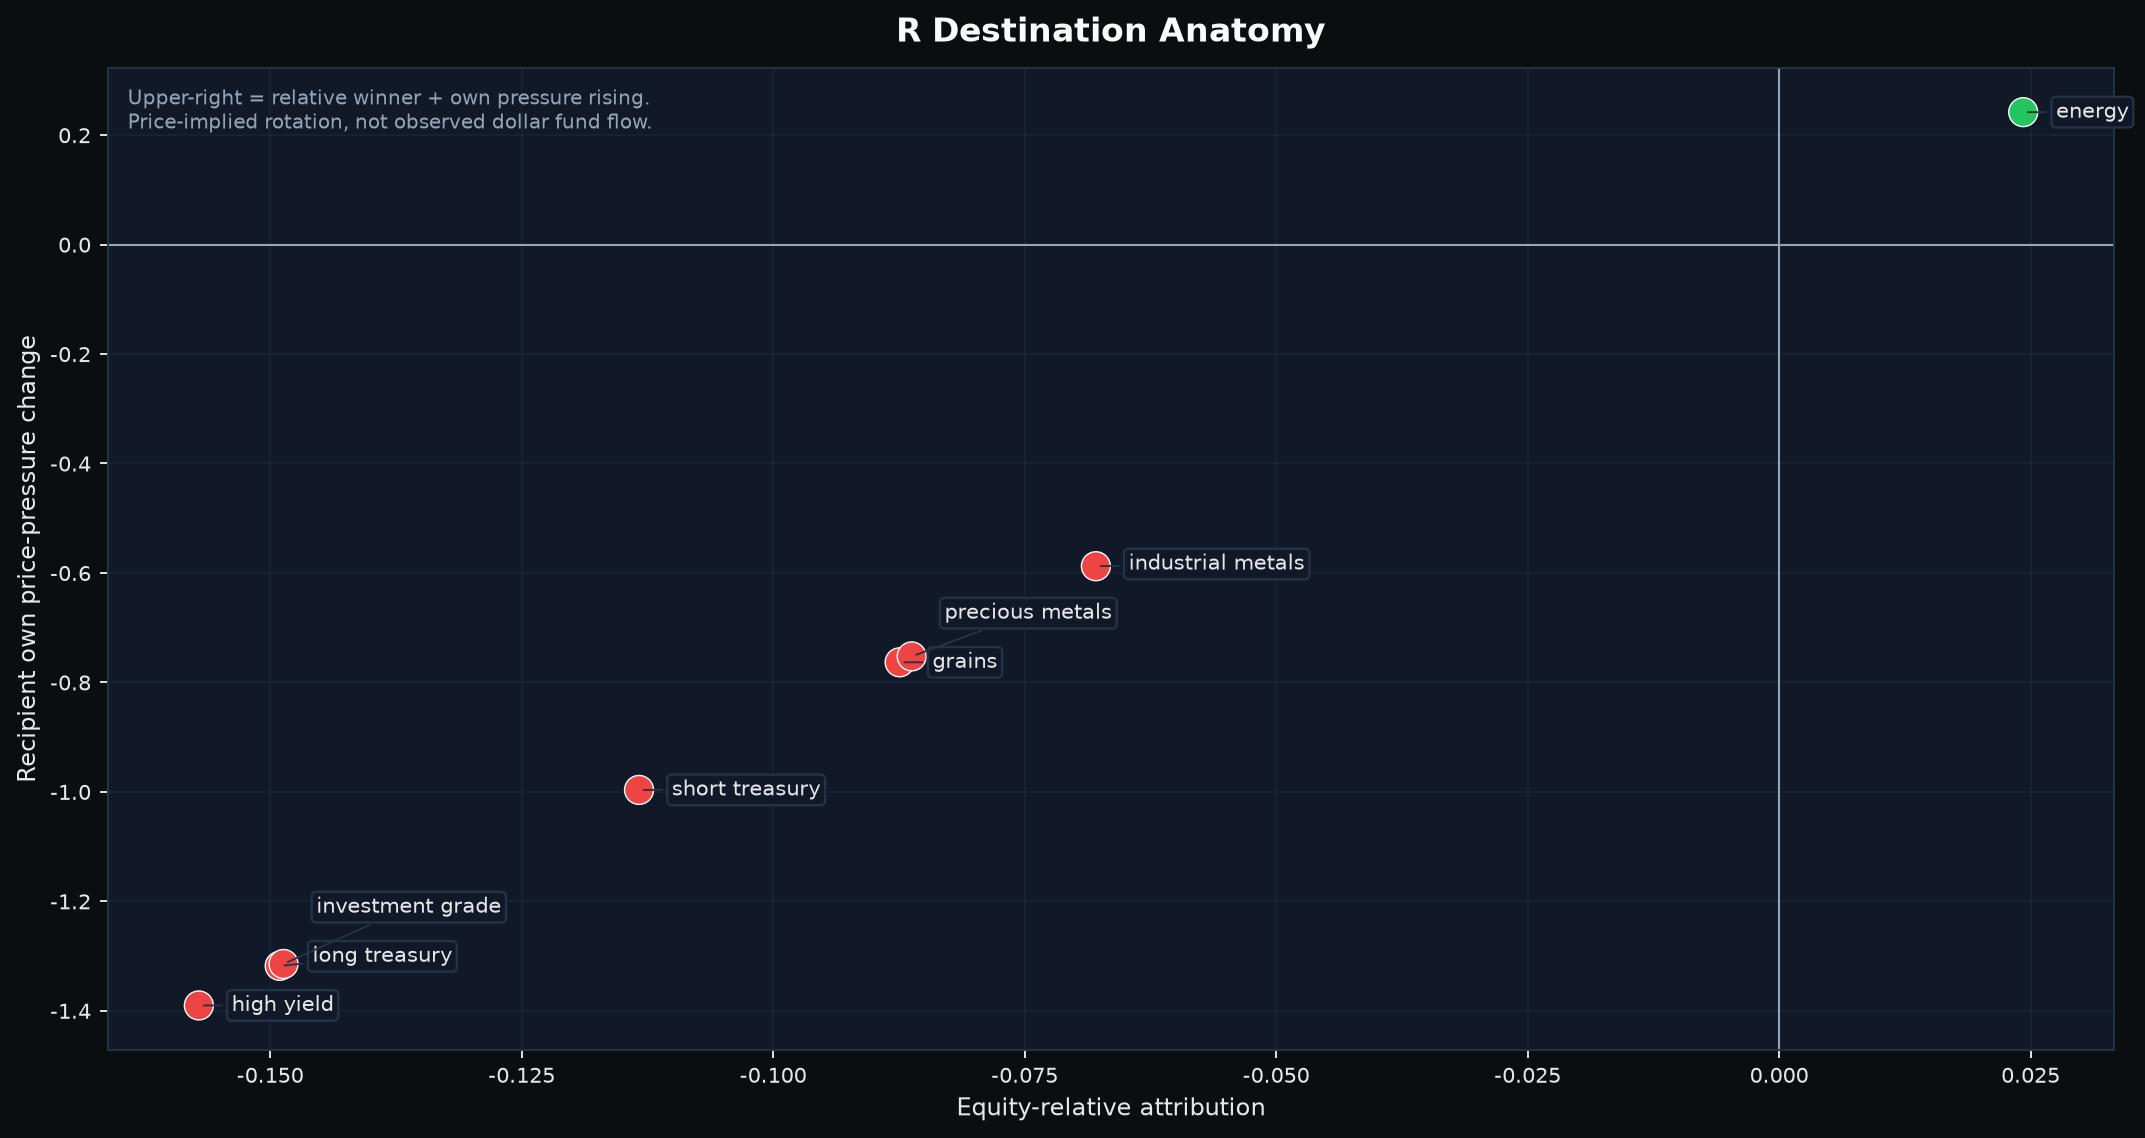
Over 20 trading days, the relative-preference measure moved +0.79 in the equity-favoring direction. Energy was the only positive non-equity destination in the attribution table, with +0.024 R-gap attribution and positive own pressure. Long Treasuries, investment grade and high yield all showed negative attribution and negative own pressure. This does not resemble a classic Treasury-led flight to safety. It is a selective repricing structure, and the destination measure is price-implied relative pressure rather than observed dollar flow.
Cross-asset coupling rose by about 0.062 over 20 days, but its node anatomy is also non-classical: industrial metals and precious metals contributed the most, followed by energy and long Treasuries, while the equity node contribution was essentially flat. Raw K is about 0.505, so the first common mode explains roughly half of standardized cross-asset variation; a participation ratio of 7.12 out of 9 and an eigengap around +1.07z indicate a broad, reasonably well-defined mode, while five-day mode stability remains very high at 0.997. Yet risk-mode alignment is only about +0.13 and equity contributed almost nothing to the 20-day rise. Higher coupling therefore does not mean equity-led synchronized risk-off. The more immediate macro problem is the coexistence of persistent price-of-money pressure with weaker breadth and a still-fragile credit backdrop.
The latest CFTC snapshot is dated September 15 and is current under the normal weekly COT release schedule, but it still predates the September 23 market close by six trading days. It is therefore meaningful but lagged counterevidence rather than a same-day veto. Equity Asset Managers remain net long at roughly +23.0% of open interest, but that net-long ratio fell by 4.76 percentage points over the last four COT reports; the change is about -1.36z versus its own history. That does not confirm the newer +0.79 price-implied move toward equity preference. Industrial-metals positioning weakened materially (-1.59z), while long-Treasury positioning was only slightly softer (-0.11z); energy remained mixed/neutral. The key divergence is therefore that prices have shifted toward equities faster than the latest available weekly futures-positioning snapshot has confirmed.
4. Sector leadership: internet/media moved to #1, but technology leadership remains two-sided
| Bull rank | Sector | Bear-risk rank | Balance state | Representative tickers | Public read |
|---|---|---|---|---|---|
| 1 | Internet, Media & Telecom | 4 | TWO_SIDED_CONFLICT | APP, TTD, META, NBIS, GOOG, NFLX, TTWO | Leadership is clean enough to watch, but conflict rises when Bear-risk rank is also high. |
| 2 | Consumer Services, Leisure & Hospitality | 22 | BULL_DOMINANT | DKNG, EXPE, BKNG, CCL, ABNB, MAR, SBUX | Bull leadership with materially lower simultaneous Bear-risk. |
| 3 | Semiconductors & Tech Hardware | 2 | TWO_SIDED_CONFLICT | ASTS, IONQ, SNDK, ONDS, SMCI, ALAB, MPWR | Leadership is clean enough to watch, but conflict rises when Bear-risk rank is also high. |
| 4 | Enterprise Software & IT Services | 3 | TWO_SIDED_CONFLICT | INTU, CRWV, PATH, AKAM, APLD, SHOP, MDB | Leadership is clean enough to watch, but conflict rises when Bear-risk rank is also high. |
| 5 | Metals & Mining | 12 | BULL_DOMINANT | CDE, HL, VALE, FCX, NEM | Bull leadership with materially lower simultaneous Bear-risk. |
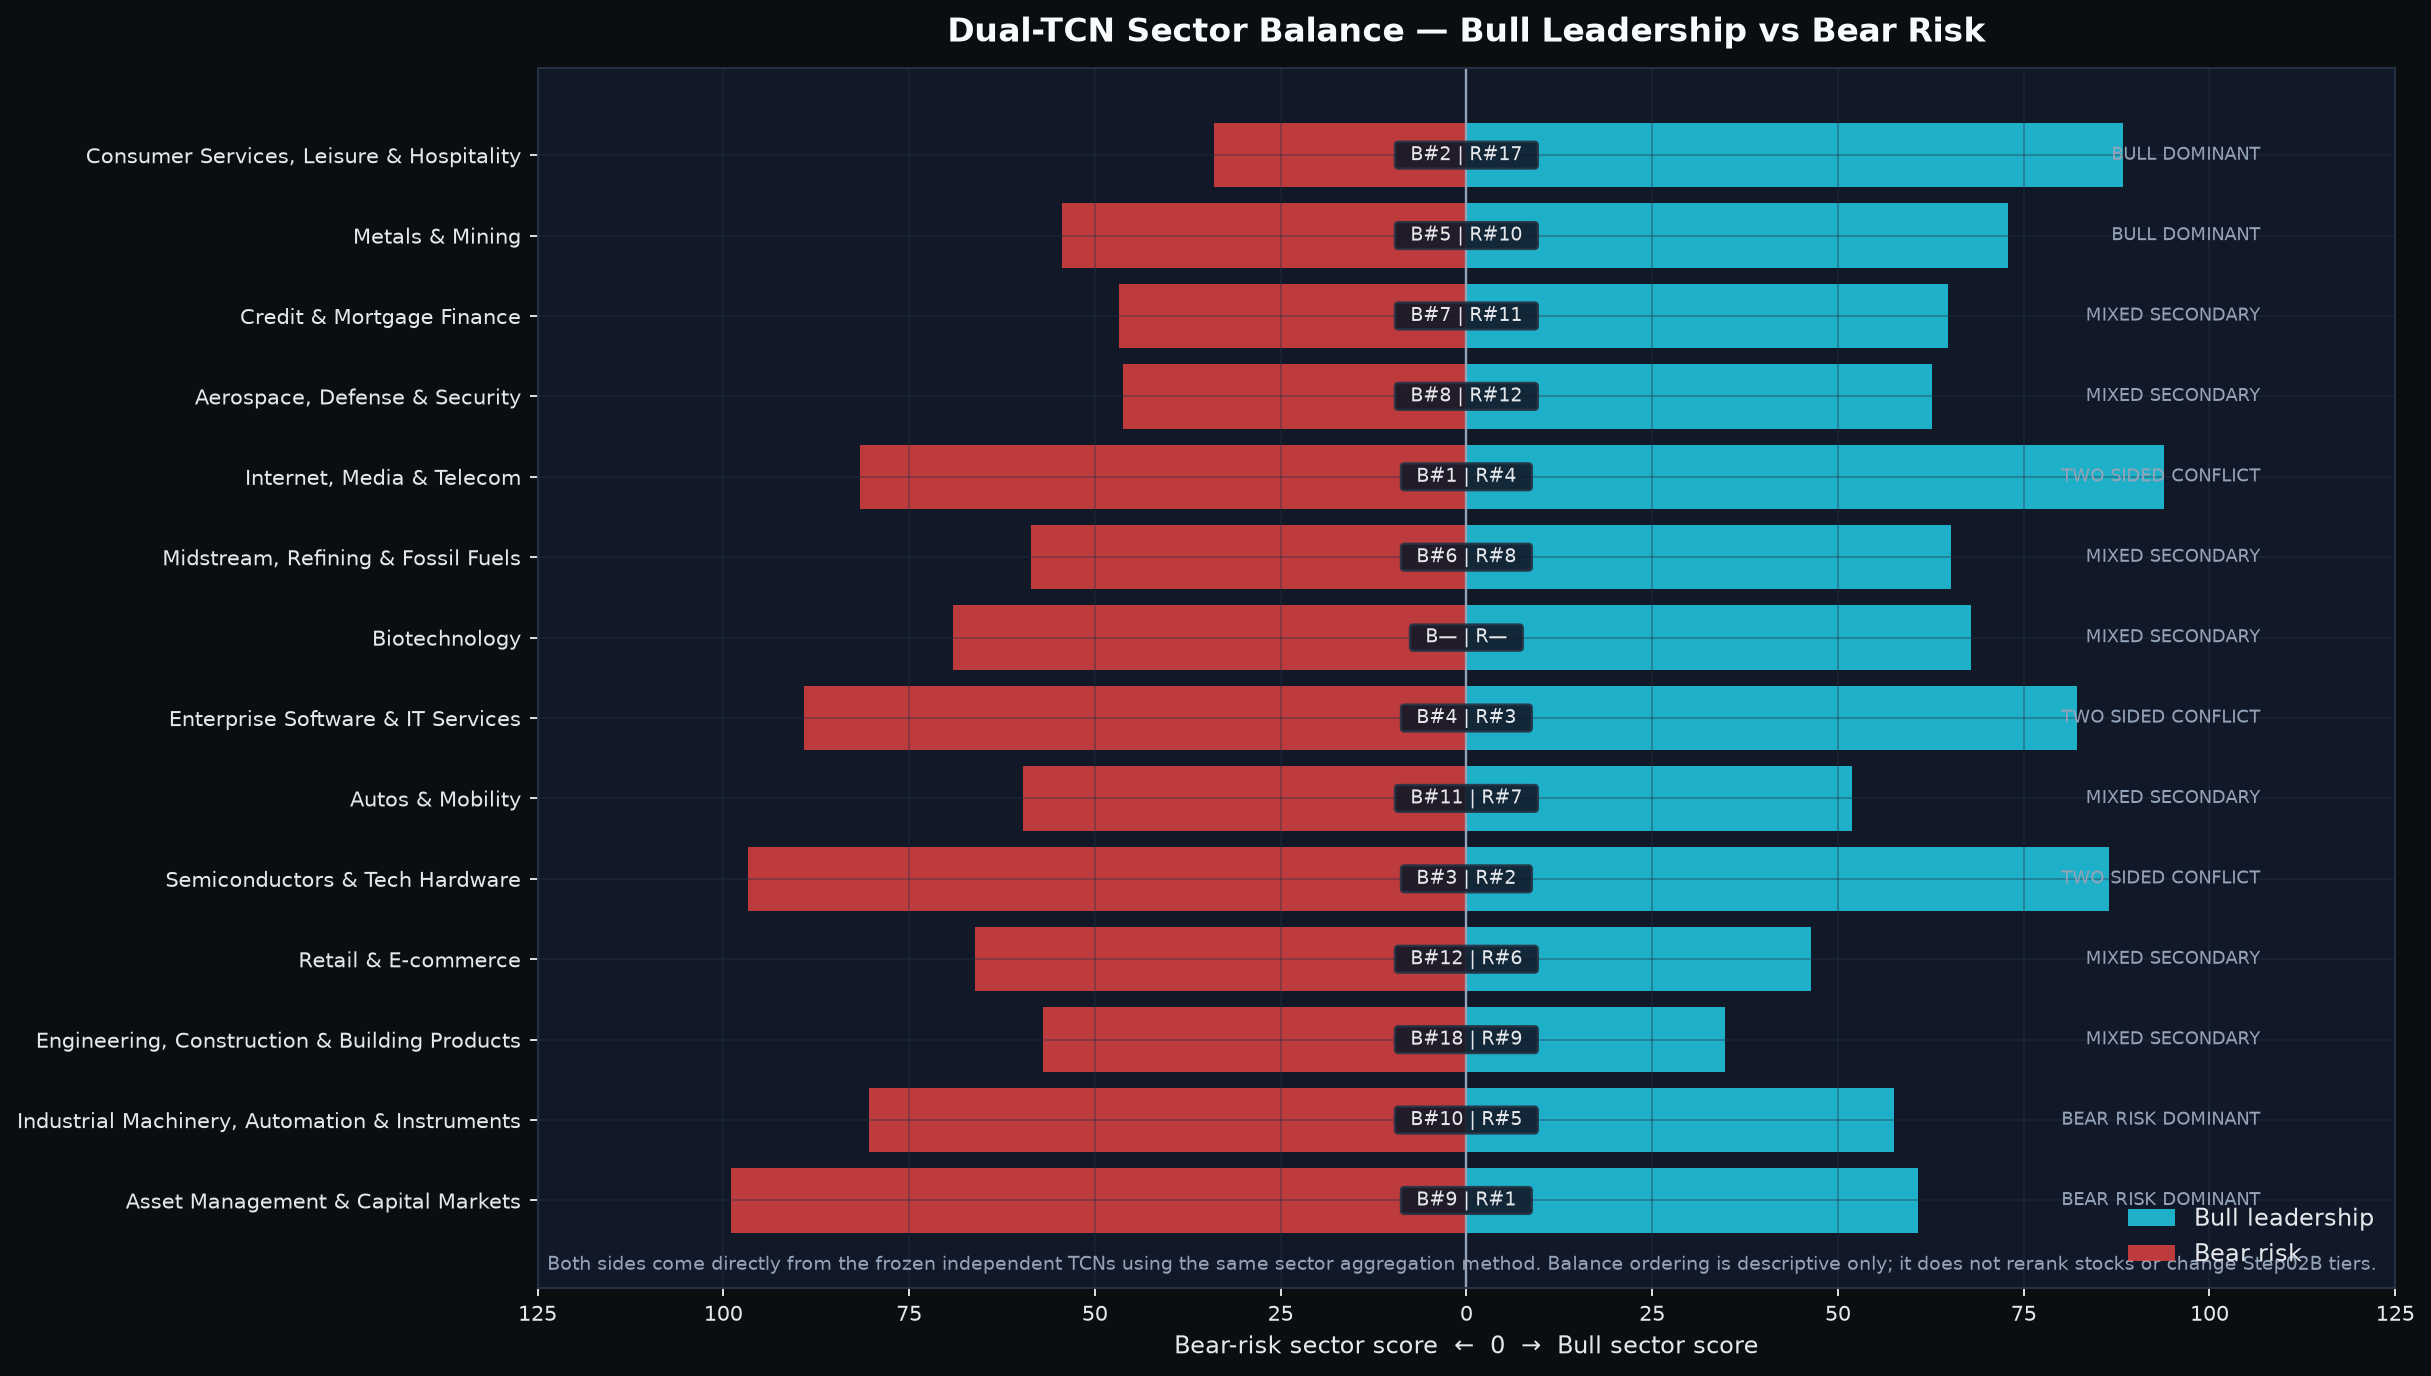
The transition from September 22 is substantial but not a wholesale theme change. Internet/Media rose from #3 to #1, Consumer Services held #2, Semiconductors improved from #4 to #3, Enterprise Software slipped from #1 to #4, and Metals & Mining entered at #5 while Aerospace dropped out. The growth complex is still visible, but its internal ordering changed and Metals now adds a real-asset leg.
| Sector | Leading subcluster(s) | Key names | Economic linkage | Quant/price confirmation | Why now / public mechanism | Strongest counterevidence |
|---|---|---|---|---|---|---|
| Internet, Media & Telecom | Consumer AI / ad-tech / platform monetization | APP, TTD, META | AI engagement and monetization can lift platform economics | Bull #1 but Bear-risk #4: strong, not clean | Meta AI-agent enthusiasm supplied a current public read-through | NBIS appears on the Bear side; leadership is not sector-wide |
| Consumer Services, Leisure & Hospitality | Online betting / travel platforms | DKNG, EXPE, BKNG | Consumer discretionary activity and travel demand | Bull #2 / Bear-risk #22 | No single public catalyst was necessary to explain the quant ranking | High rates/oil can still pressure discretionary demand |
| Semiconductors & Tech Hardware | AI servers, power semis, space/communications hardware | SMCI, MPWR, ASTS, ONDS | AI compute, power density, connectivity and defense hardware | Bull #3 / Bear-risk #2: pronounced two-sided conflict | SMCI Vera Rubin shipments and MPWR manufacturing scaling support the demand mechanism | Numerous semiconductor names also sit high in Bear ranks |
| Enterprise Software & IT Services | Distributed cloud / AI cloud | AKAM, CRWV | Cloud infrastructure and AI compute demand | Bull #4 / Bear-risk #3: two-sided conflict | Akamai cloud/security growth and CoreWeave new capacity contracts support demand | CoreWeave financing intensity and weak Financial-vs-holdings consistency are material counterevidence |
| Metals & Mining | Precious/base-metals production | CDE, HL, VALE, FCX, NEM | Commodity-price sensitivity and operating leverage | Bull #5 / Bear-risk #12 | CDE reported record Q2 revenue and operating cash flow | CDE price remains below MA20 despite confirmed support |
Three observations matter. First, the strongest current sector, Internet/Media, is itself two-sided because Bear-risk is #4. Second, Semiconductors are simultaneously Bull #3 and Bear-risk #2, making stock selection inside the group more important than the sector label. Third, Metals & Mining is cleaner on the Bear side but its selected representative, CDE, still trades below MA20. Broad leadership has not become broad confirmation.
5. Selected stocks: support is close, but trend quality and slower evidence diverge
| Stock | Sector | Selection tier/role | Bull rank (of 293) | Bear rank (of 293) | Recent support | Distance to live S1 | Price trend |
|---|---|---|---|---|---|---|---|
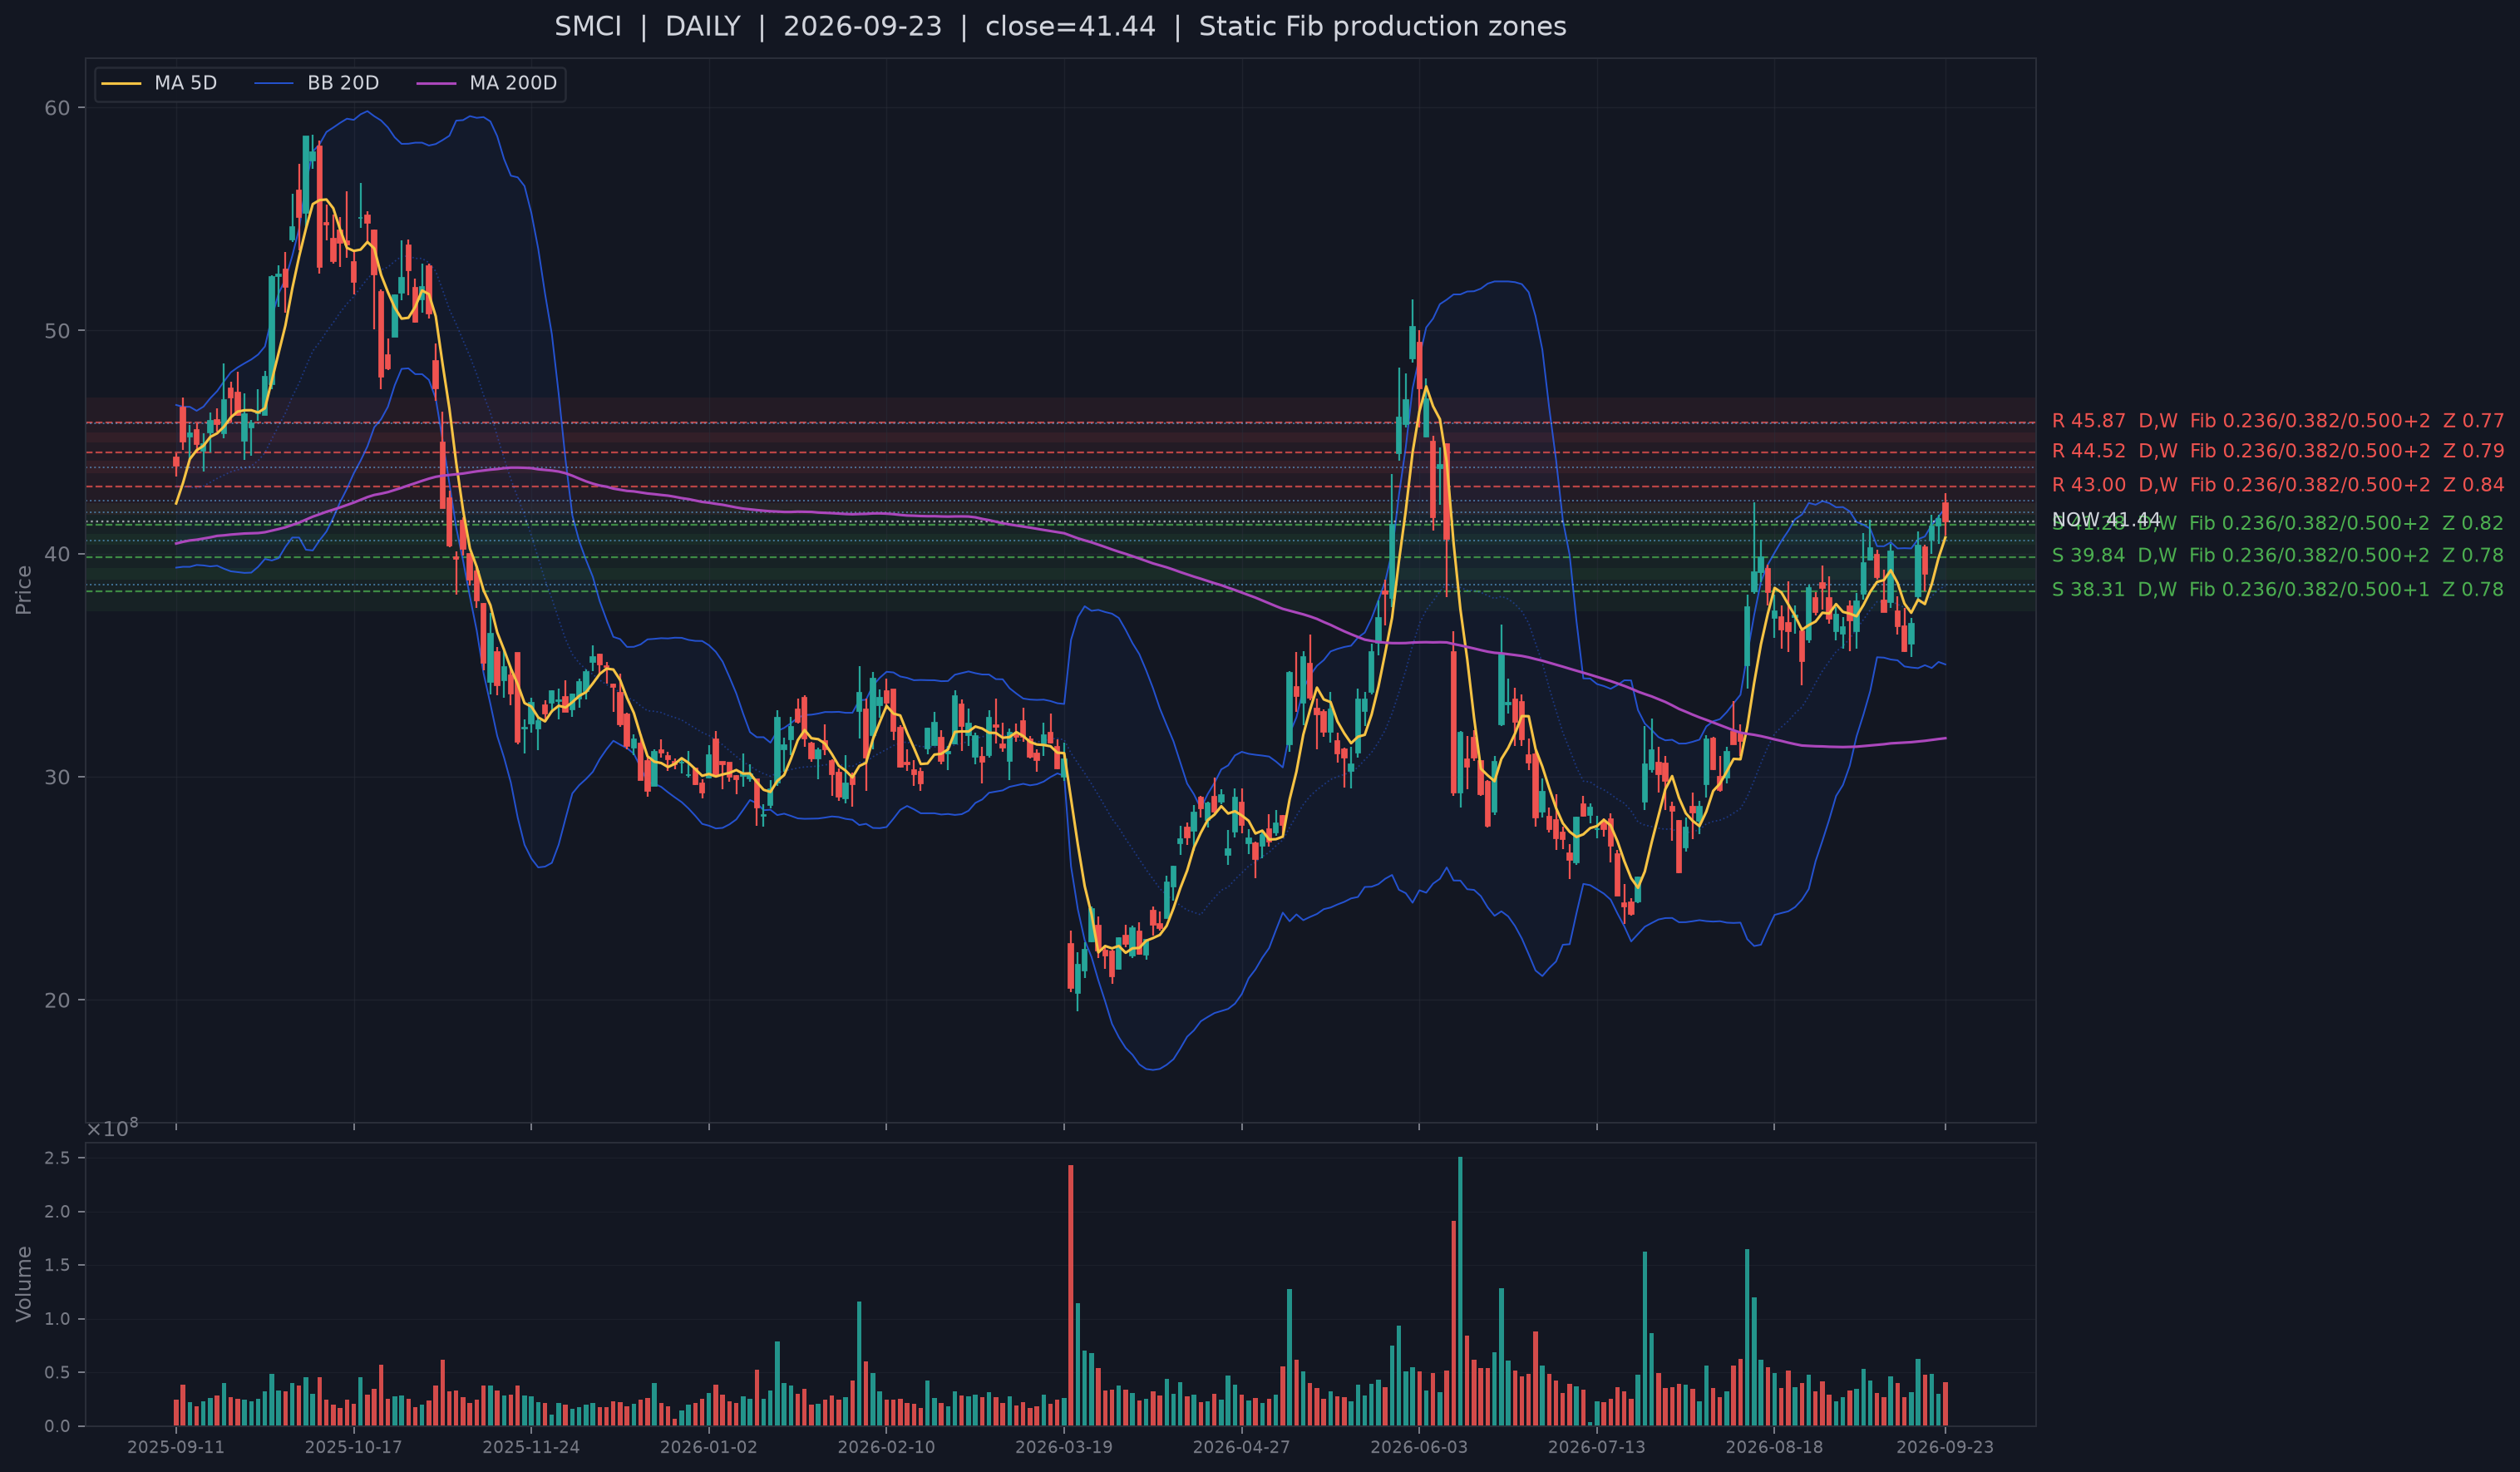
| SMCI | Semiconductors & Tech Hardware | A Bull screen | #12 of 293 | #35 of 293 | same-day bullish reclaim, 1 TD ago | 0.38% / 0.07 ATR | MA5 +1.8% / MA20 +7.5% |
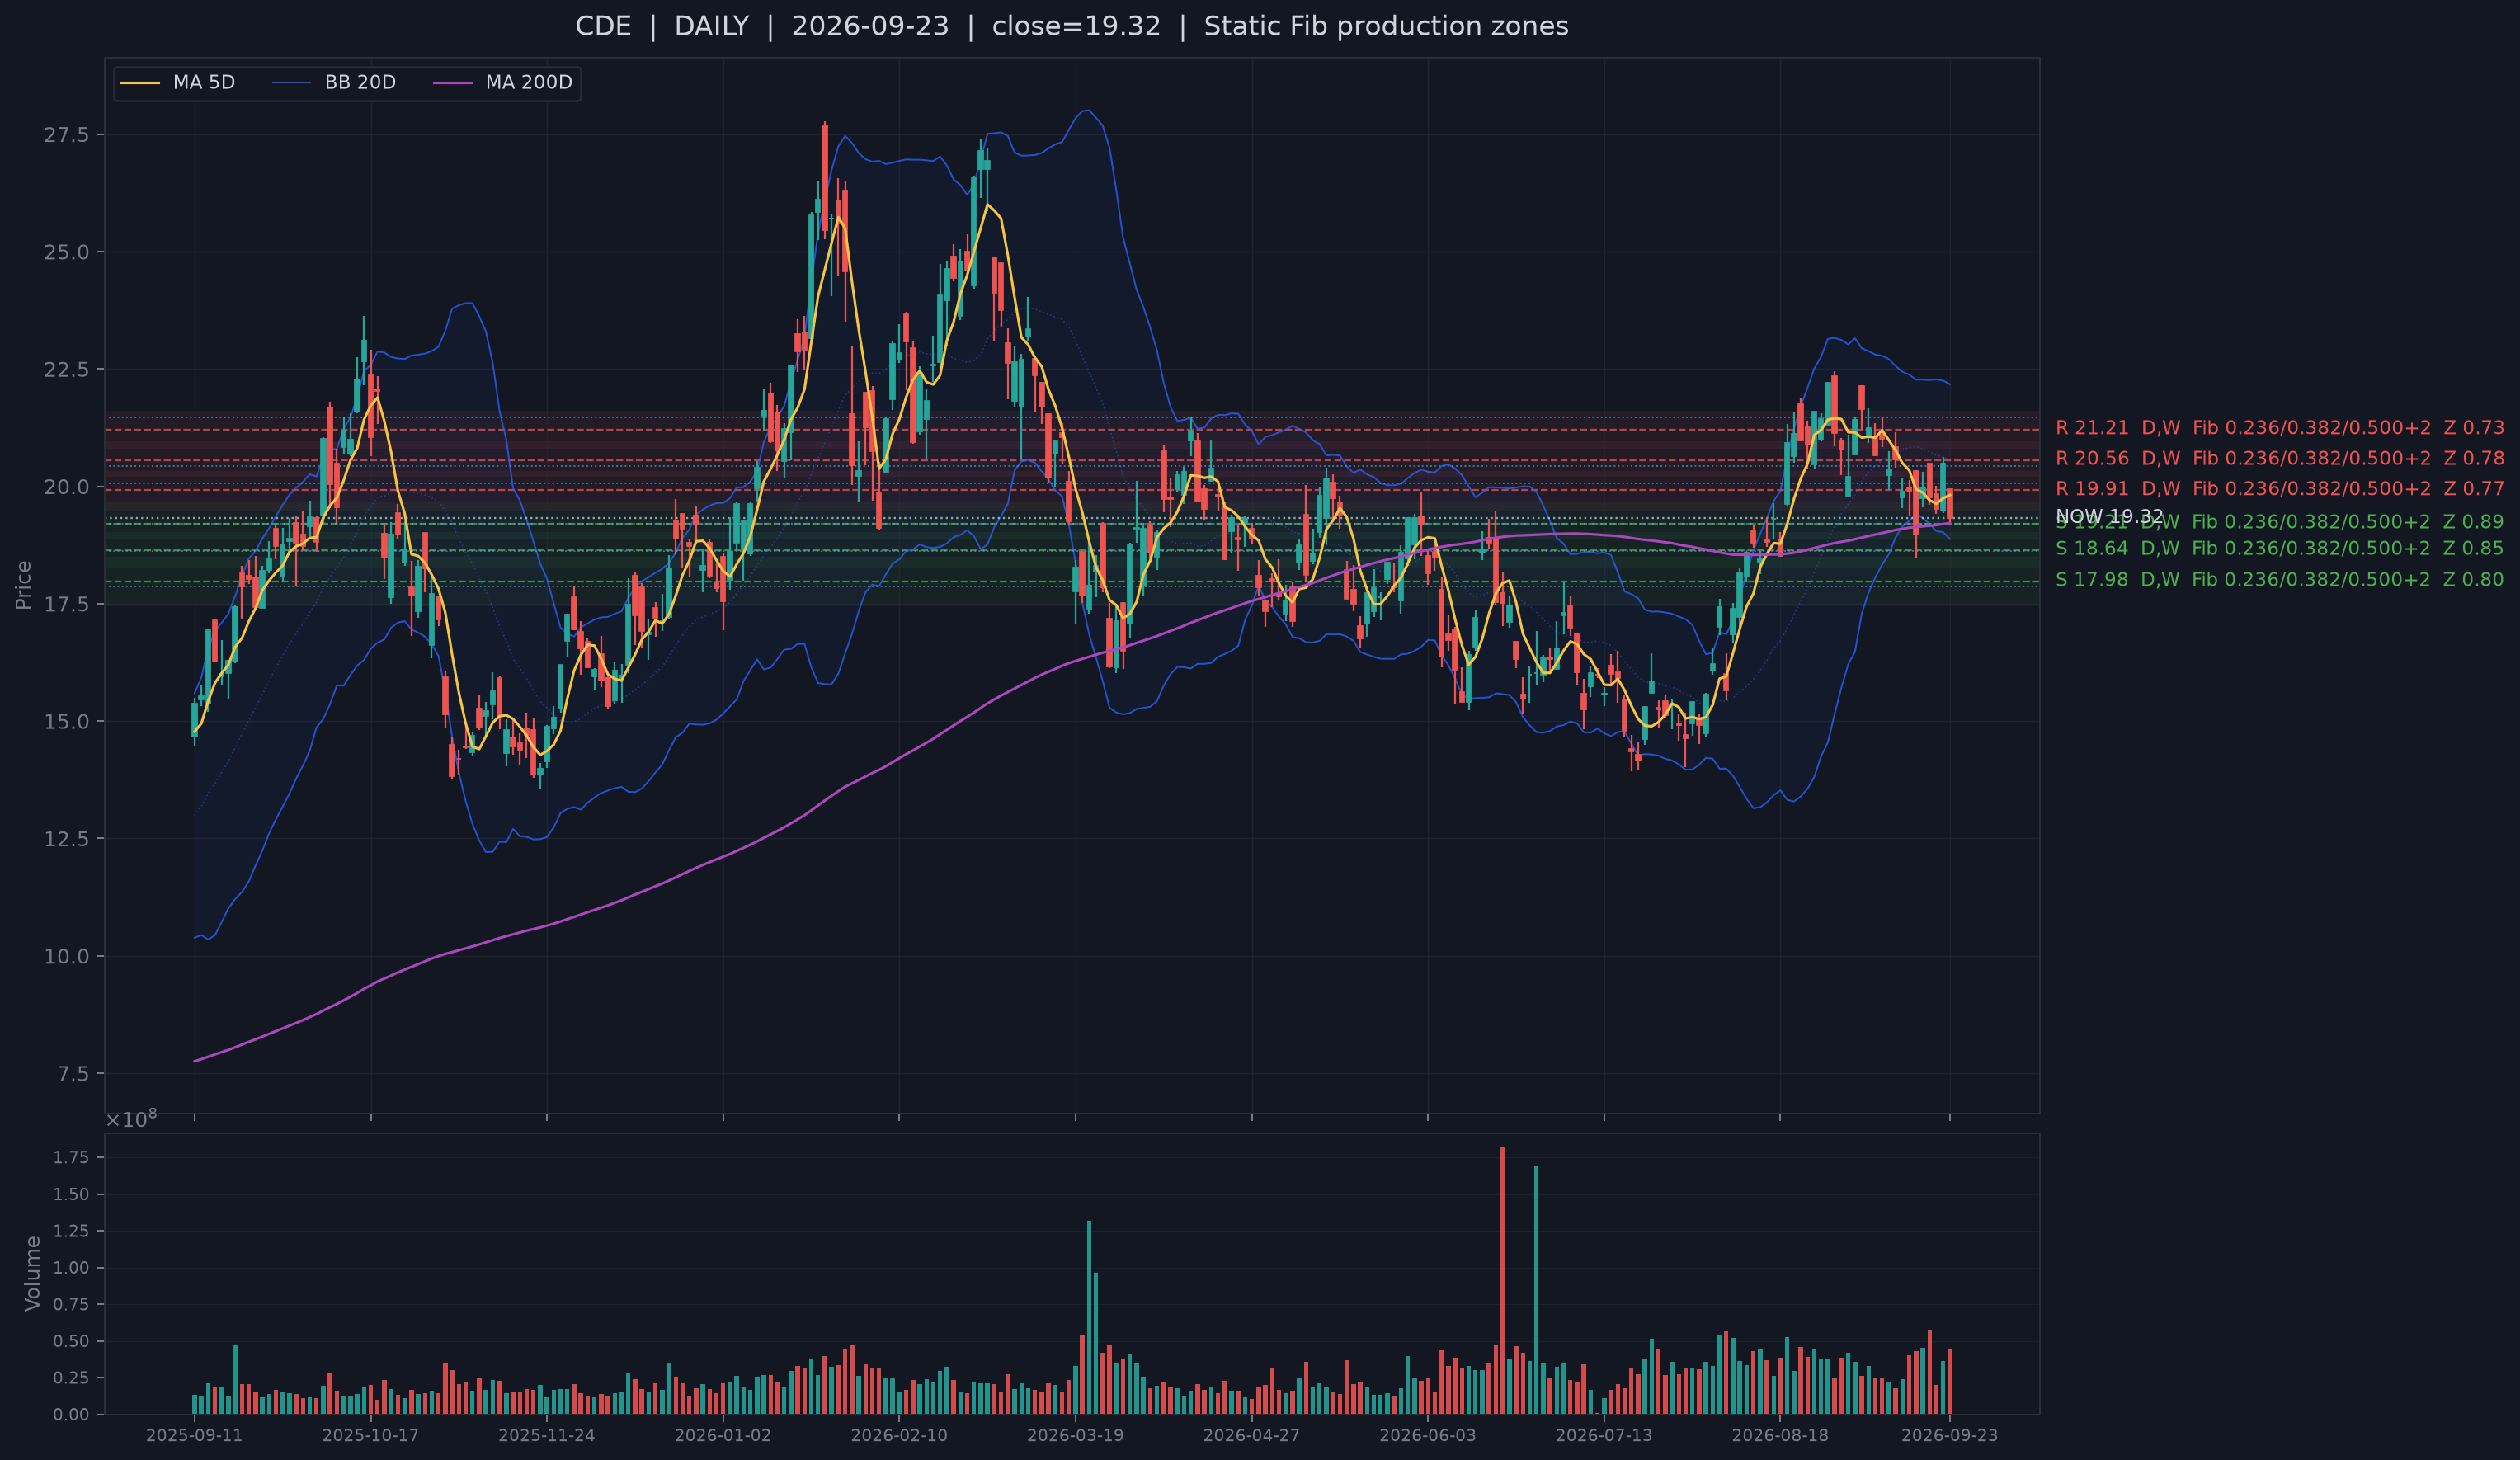
| CDE | Metals & Mining | B Bull screen | #20 of 293 | #92 of 293 | same-day bullish reclaim, 4 TD ago | 0.59% / 0.11 ATR | MA5 -2.5% / MA20 -5.9% |
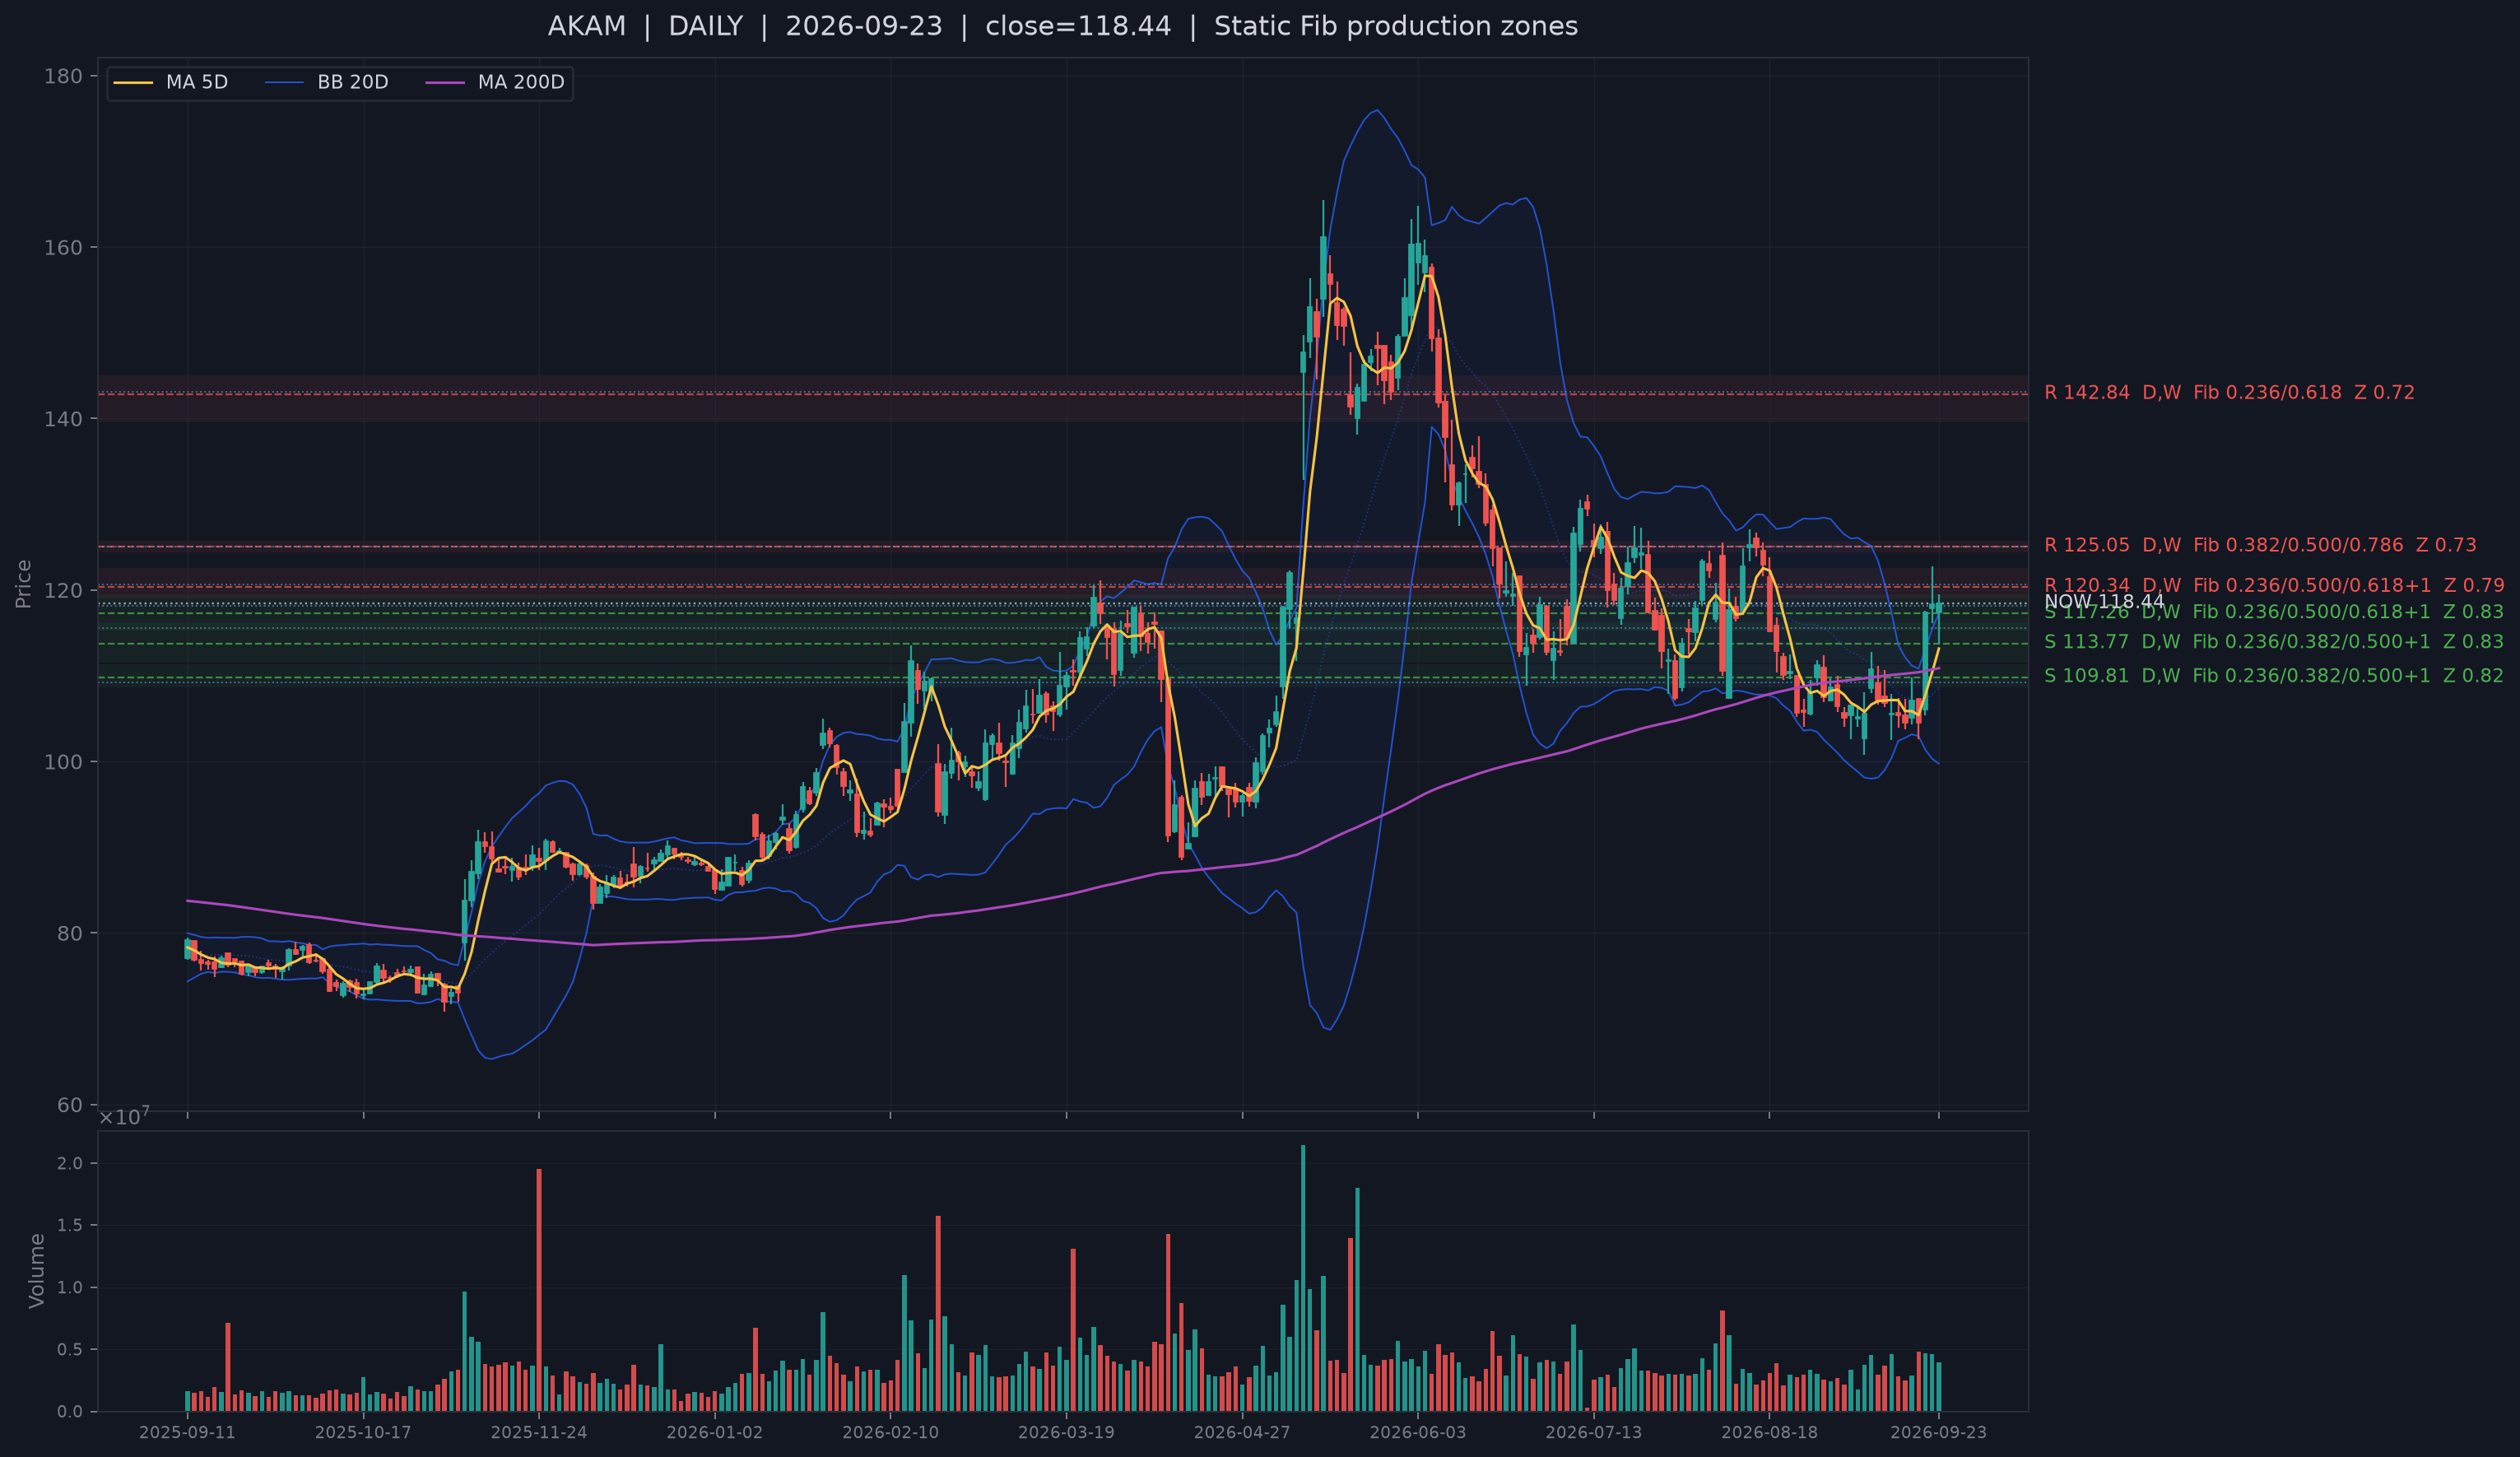
| AKAM | Enterprise Software & IT Services | B Bull screen | #28 of 293 | #60 of 293 | next-day wick reclaim, 2 TD ago | 1.01% / 0.21 ATR | MA5 +4.7% / MA20 +9.2% |
| MPWR | Semiconductors & Tech Hardware | B Bull screen | #17 of 293 | #49 of 293 | same-day bullish reclaim, 2 TD ago | 1.53% / 0.35 ATR | MA5 +5.9% / MA20 +9.8% |
| ASTS | Semiconductors & Tech Hardware | A+ Bull screen | #3 of 293 | #102 of 293 | same-day bullish reclaim, 2 TD ago | 3.02% / 0.42 ATR | MA5 -2.2% / MA20 -1.2% |
| ONDS | Semiconductors & Tech Hardware | A+ Bull screen | #9 of 293 | #141 of 293 | same-day bullish reclaim, 1 TD ago | 3.03% / 0.49 ATR | MA5 -0.8% / MA20 -1.8% |
| CRWV | Enterprise Software & IT Services | B Bull screen | #18 of 293 | #51 of 293 | same-day bullish reclaim, 1 TD ago | 3.47% / 0.52 ATR | MA5 +3.4% / MA20 +1.0% |
The ordering is mechanical and preserved exactly from the support-confirmed upstream list. SMCI is the cleanest near-support example: only 0.07 ATR from live S1 and still 7.5% above MA20. The September 23 announcement that Supermicro is shipping NVIDIA Vera Rubin NVL72 racks gives a current public mechanism for the AI-server/liquid-cooling demand story, but its Financial rank is only 0.05, so the slower operating layer does not independently confirm the strength of price.
CDE is the opposite control. It is only 0.11 ATR from current support and has solid slower context, including record Q2 revenue and operating cash flow, yet price sits 5.9% below MA20. Support confirmation is not trend confirmation. A constructive CDE setup requires the support hold to translate into medium-term price repair rather than relying on the fundamental story to rescue weak geometry.
AKAM shows one of the sharpest slow-layer disagreements. Price is 9.2% above MA20 and only 0.21 ATR from current support, while the Financial rank is 0.01 and delayed-holdings rank is 0.94. Akamai’s 39% year-over-year cloud-infrastructure growth and 10% security growth provide a real operating mechanism, but the extreme disagreement between the two slower quantitative layers argues against treating one confirmation channel as decisive.
MPWR has the strongest clean trend among the remaining semiconductor names: +9.8% versus MA20 and 0.35 ATR from support, with both slower ranks above the middle of their distributions. Its recent manufacturing partnership is consistent with a power-density scaling thesis. ASTS and ONDS are different: both remain close enough to support, but both are below MA20 and therefore need price repair. ONDS has a defense/autonomy growth mechanism, while ASTS remains a space-based cellular broadband setup whose operating evidence is still slower and development-dependent.
CRWV is the most explicit capital-intensity trade-off. It is above MA20 and near support, and CoreWeave continues to sign new AI-compute capacity at higher prices. The official-filing fallback shows revenue growth of 112.5% and a 91.1% CFO margin, but FCF margin is -179.9%. The company also priced a $3.7 billion convertible-note offering. That combination supports demand while simultaneously emphasizing financing intensity. Its 76.7% institutional-ownership snapshot is a non-comparable fallback, not a delayed 13F flow rank.
Slower context is confirmation/counterevidence, not a ranking override
| Stock | Financial context | Delayed institutional-holdings context |
|---|---|---|
| SMCI | Financial rank 0.05; price divergence +0.10 | Delayed 13F rank 0.23; price divergence +0.13 |
| CDE | Financial rank 0.47; price divergence -0.10 | Delayed 13F rank 0.75; price divergence +0.14 |
| AKAM | Financial rank 0.01; price divergence +0.11 | Delayed 13F rank 0.94; price divergence +0.78 |
| MPWR | Financial rank 0.68; price divergence +0.44 | Delayed 13F rank 0.78; price divergence +0.62 |
| ASTS | Financial rank 0.03; price divergence +0.23 | Delayed 13F rank 0.64; price divergence +0.64 |
| ONDS | Financial rank 0.11; price divergence +0.31 | Delayed 13F rank 0.56; price divergence +0.53 |
| CRWV | Official-filing fallback: revenue YoY +112.5%, CFO margin +91.1%, FCF margin -179.9% | Institutional ownership snapshot 76.7% (fallback; not a 13F flow rank) |
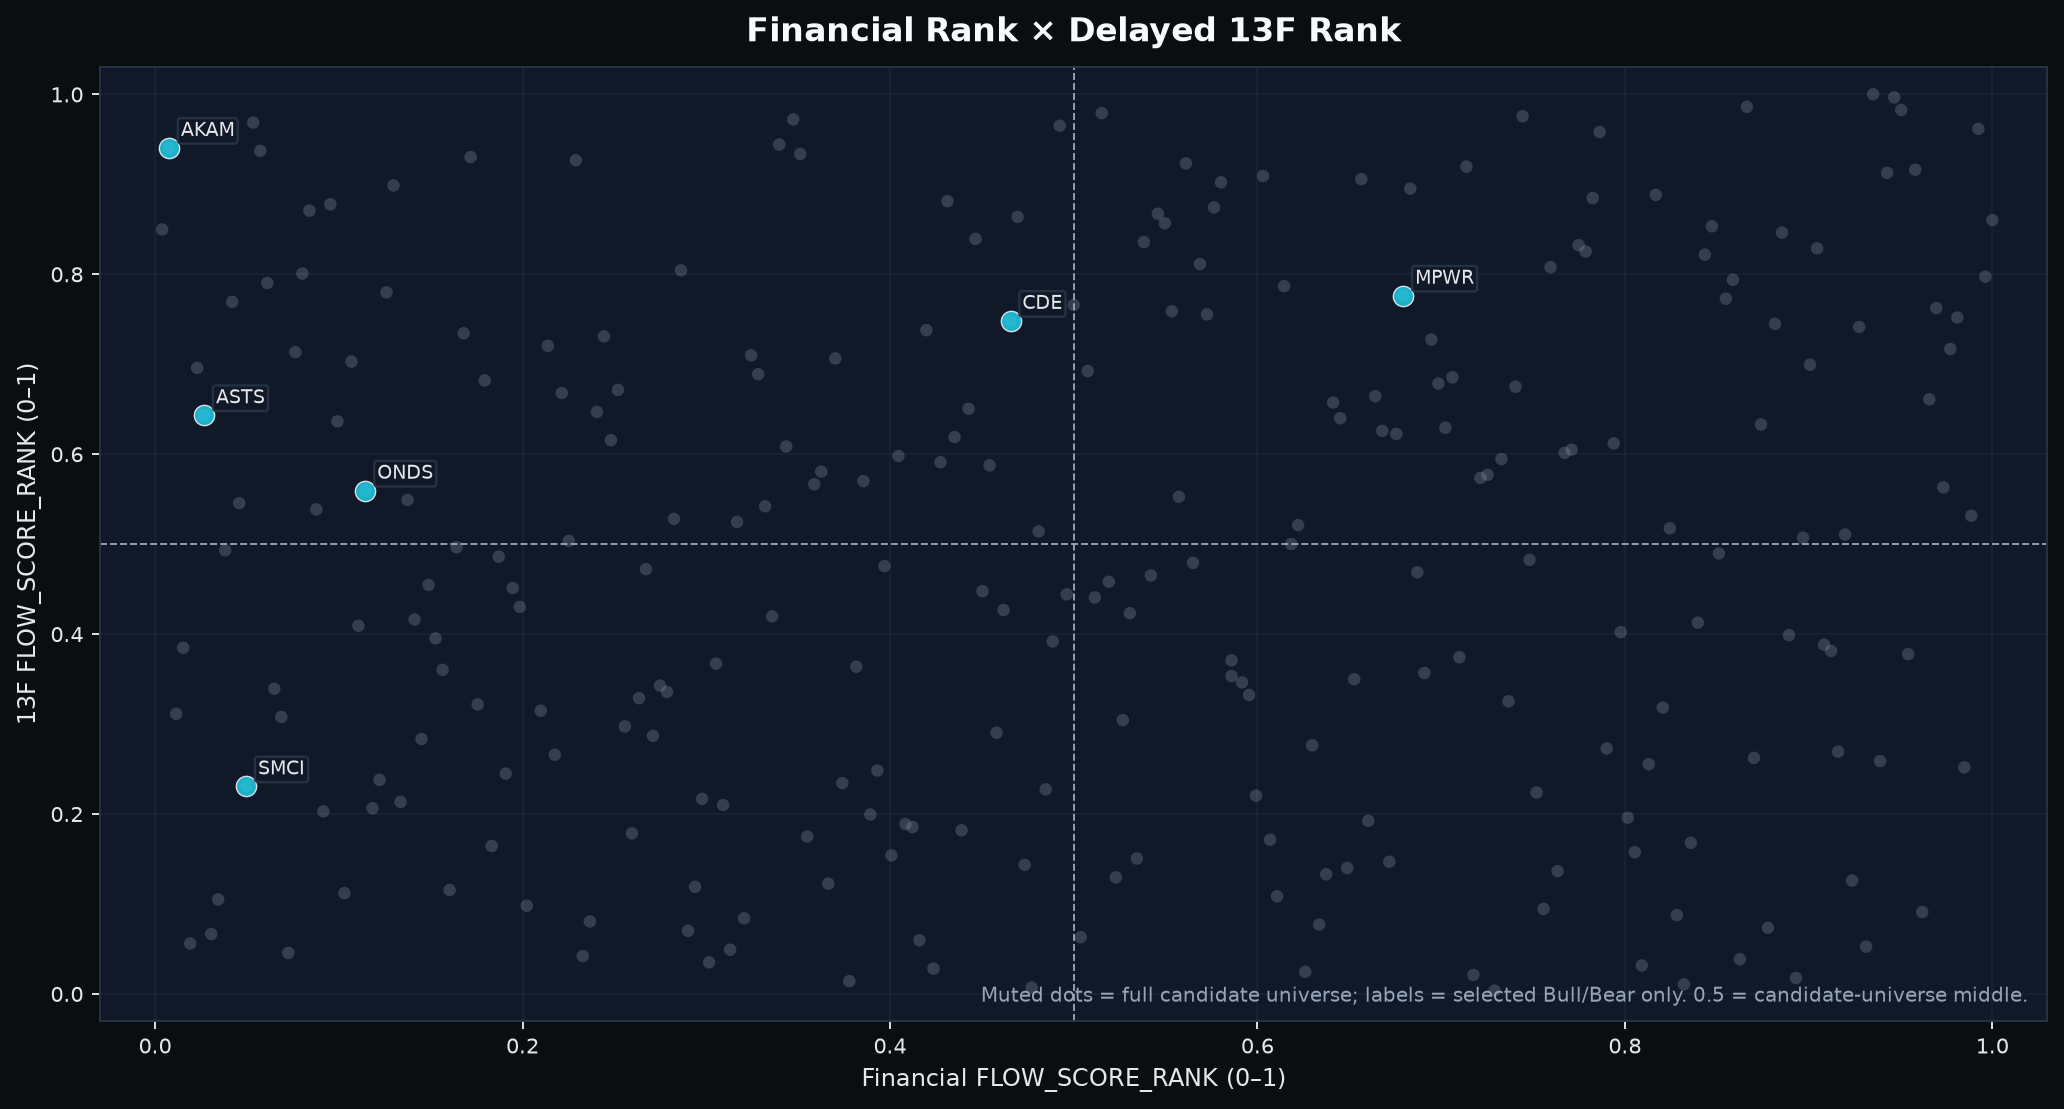
Most comparable institutional-holdings snapshots here became available in late May or early June 2026, so they are multi-month context, not a current-flow measure. The current bundle has no selected-name price-path and risk context overlap; this secondary layer is therefore unavailable/neutral rather than silently inferred from historical research variables.
6. Base case, confidence and falsification
Base case (3-10 trading days): selective upside remains possible, but the market has shifted from “trend with improving breadth” to “trend with weak participation and failed execution confirmation.” Confidence is moderate. The strongest support is that both major indexes remain above MA20 and selected names are mechanically close to recently confirmed support. The strongest counterevidence is the combination of new-low damage, persistently tight price-of-money conditions, all three order-flow axes below neutral at the close, and two-sided technology sector ranks.
What strengthens the thesis: an early and persistent reclaim above 50 in Aggressor, Depth and Alignment; breadth back toward or above balance; no expansion in down-3% breadth or dispersion; and support leaders holding live S1 while weak-trend controls such as CDE, ASTS and ONDS repair toward MA20.
What invalidates it: another below-neutral close across all three order-flow axes accompanied by expanding new lows, large-decline breadth or dispersion, plus broad live-support failures among the selected names. That combination would turn today’s selective deterioration into a more convincing propagation signal.
Sources
- Reuters (2026-09-22) - Market context: technology strength, oil near $100 and elevated Treasury yields before the 9/23 session.
- Supermicro (2026-09-23) - SMCI began shipping NVIDIA Vera Rubin NVL72 racks with its liquid-cooling/data-center stack.
- Akamai (2026-08-06) - Cloud Infrastructure Services +39% YoY, security +10% YoY, and multi-year cloud commitments.
- Coeur Mining (2026-08-05) - Record Q2 revenue and operating cash flow provide slower fundamental context for CDE.
- Monolithic Power Systems (2026-09-09) - GlobalFoundries manufacturing partnership supports scaling high-performance power solutions.
- Ondas (2026-09-14) - Recent defense-tech acquisition activity and autonomous-systems expansion.
- CoreWeave (2026-09-17) - New AI compute capacity contracted at higher prices and customer commitments expanded.
- CoreWeave (2026-09-18) - The $3.7B convertible-note financing highlights the capital intensity of AI-cloud expansion.
- AST SpaceMobile (2026-Q2) - Official Q2 materials for space-based cellular broadband business context.
- CFTC (2026-09-15) - Weekly Commitments of Traders positioning context; six trading days behind the market close.
Methodology / horizon note
This note uses private quantitative evidence to define the research question first, then public facts to test mechanisms and counterevidence. Sector and stock ranks are not changed by news. Relative cross-asset destinations are price-implied, not observed fund flows. Delayed holdings and CFTC positioning are slower context. The 3-10 trading-day horizon is intentional; the conclusions may not transfer to intraday trading or longer-horizon investing.