Growth Leadership Returned, but Aggressor Flow Never Confirmed It
Price, breadth and downside damage are constructive and leadership rotated toward software, consumer, media and space, but Aggressor Flow stayed below neutral all day and technology leadership remains two-sided.
This research is designed for 3-10 trading-day swing setups. The signals and conclusions may not transfer to intraday trading or longer-horizon investing.
Key takeaway
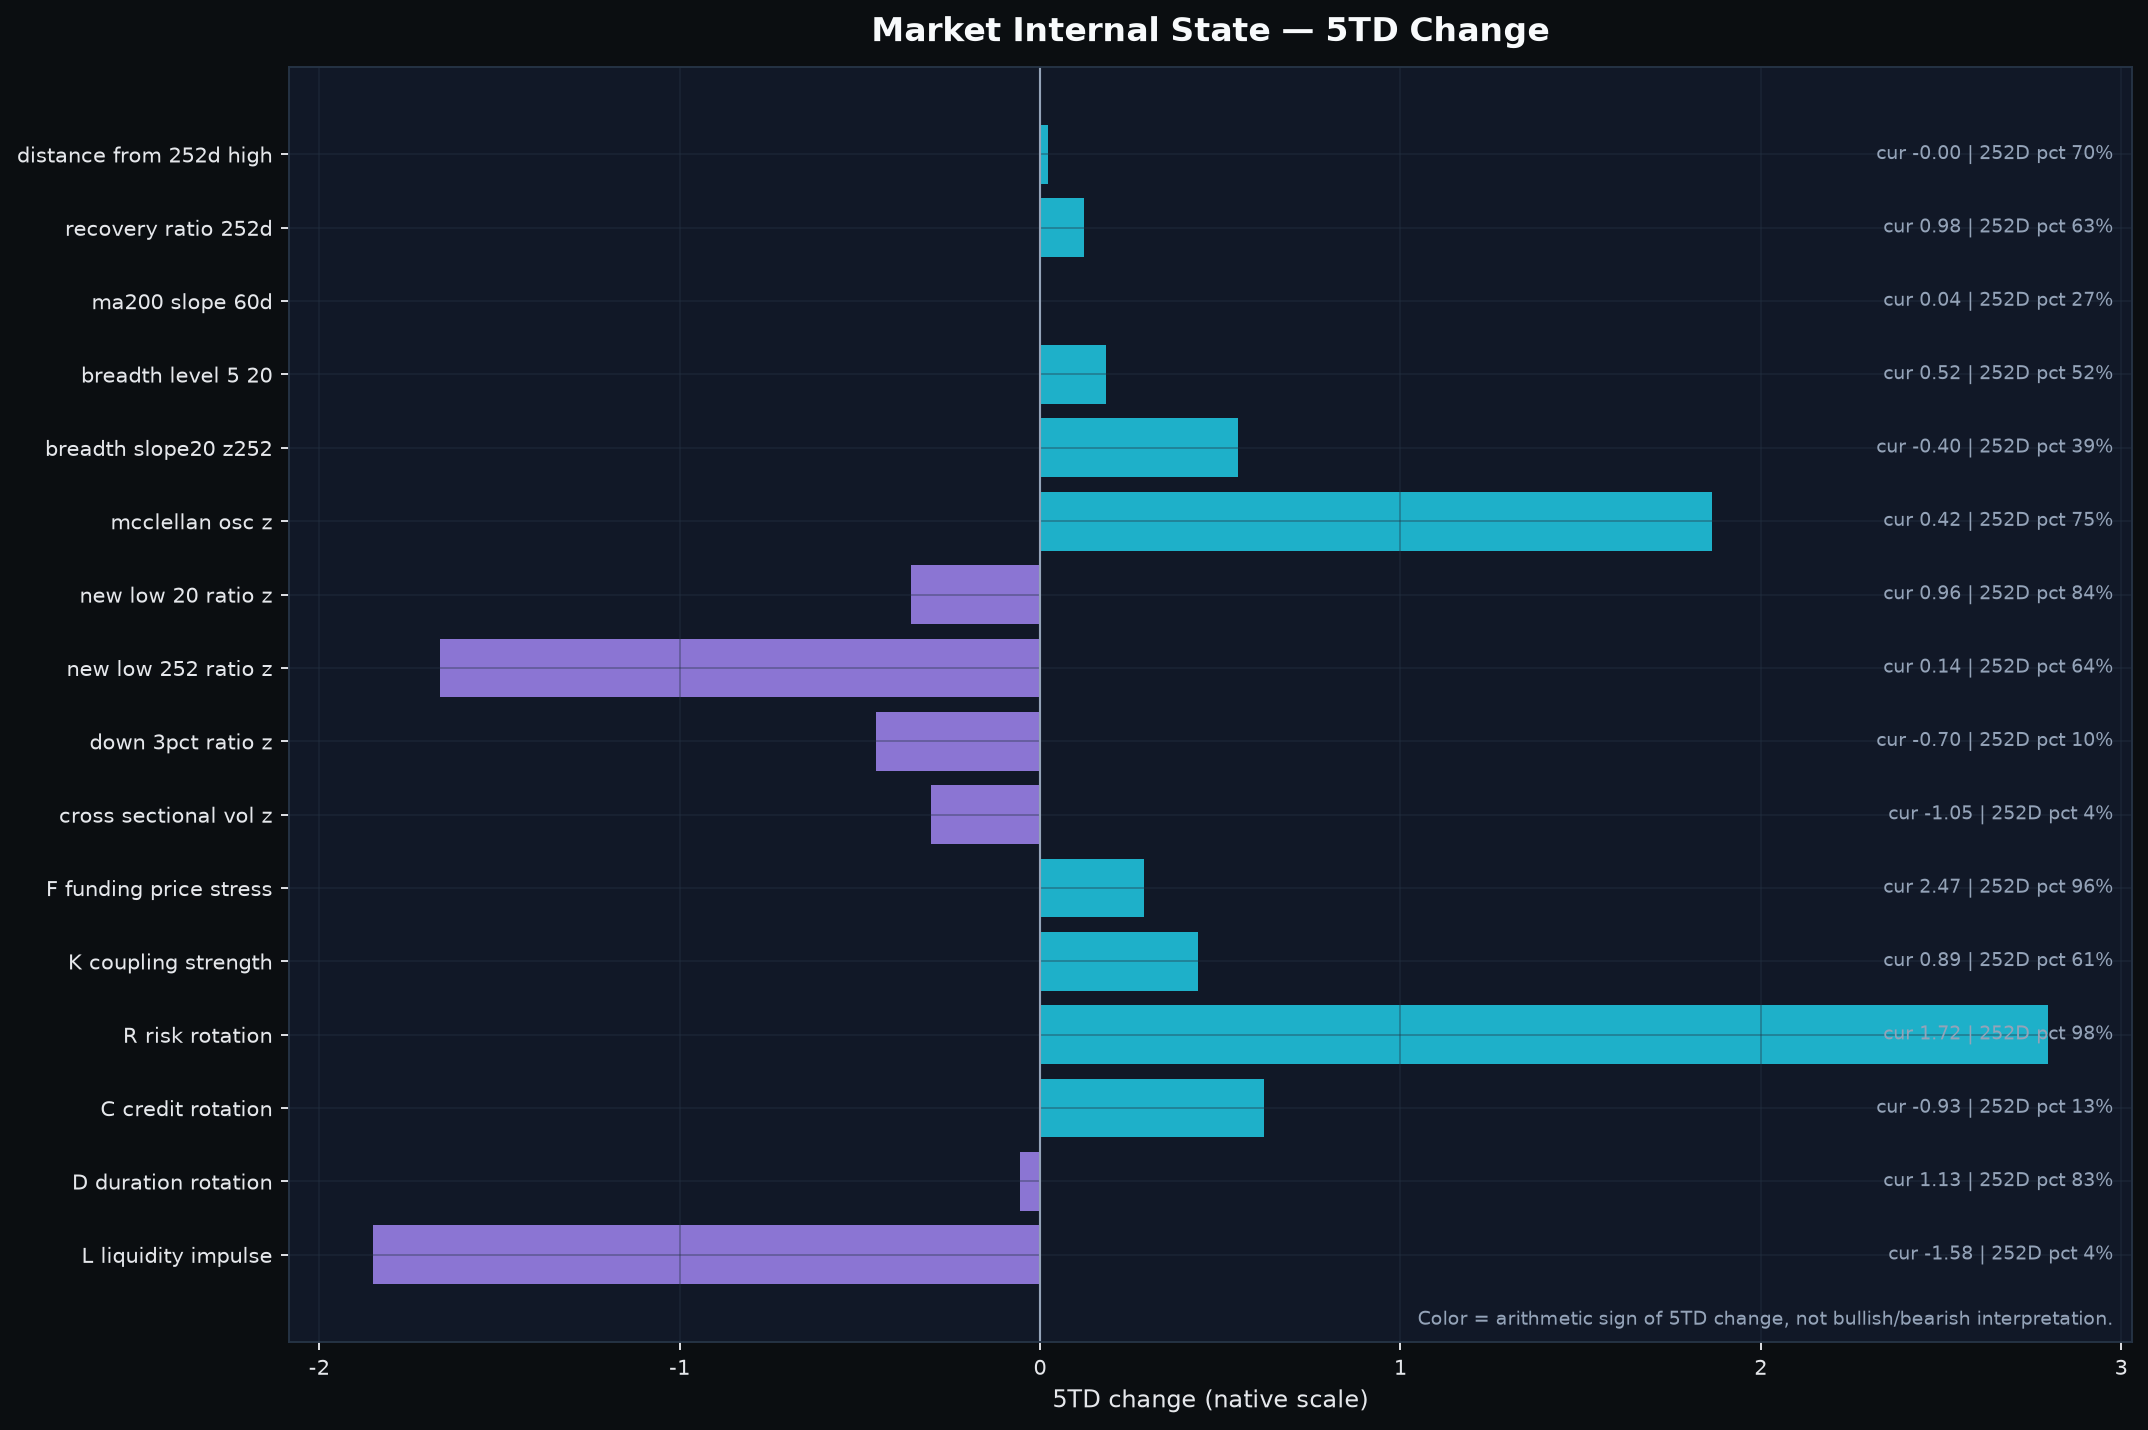
Price, breadth and downside damage look healthier than the execution layer underneath them. The S&P 500 closed 1.18% above its 5-day average and 1.25% above its 20-day average; the Nasdaq Composite was 2.20% above MA5 and 3.29% above MA20. Breadth is back slightly above balance at 0.520, the 20-day new-low ratio is near but still below +1 z at +0.96 z, the 252-day new-low ratio is only +0.14 z, the share of stocks falling 3% or more is -0.70 z, and cross-sectional volatility is unusually subdued at -1.05 z. The fast market surface therefore does not look like broad liquidation.
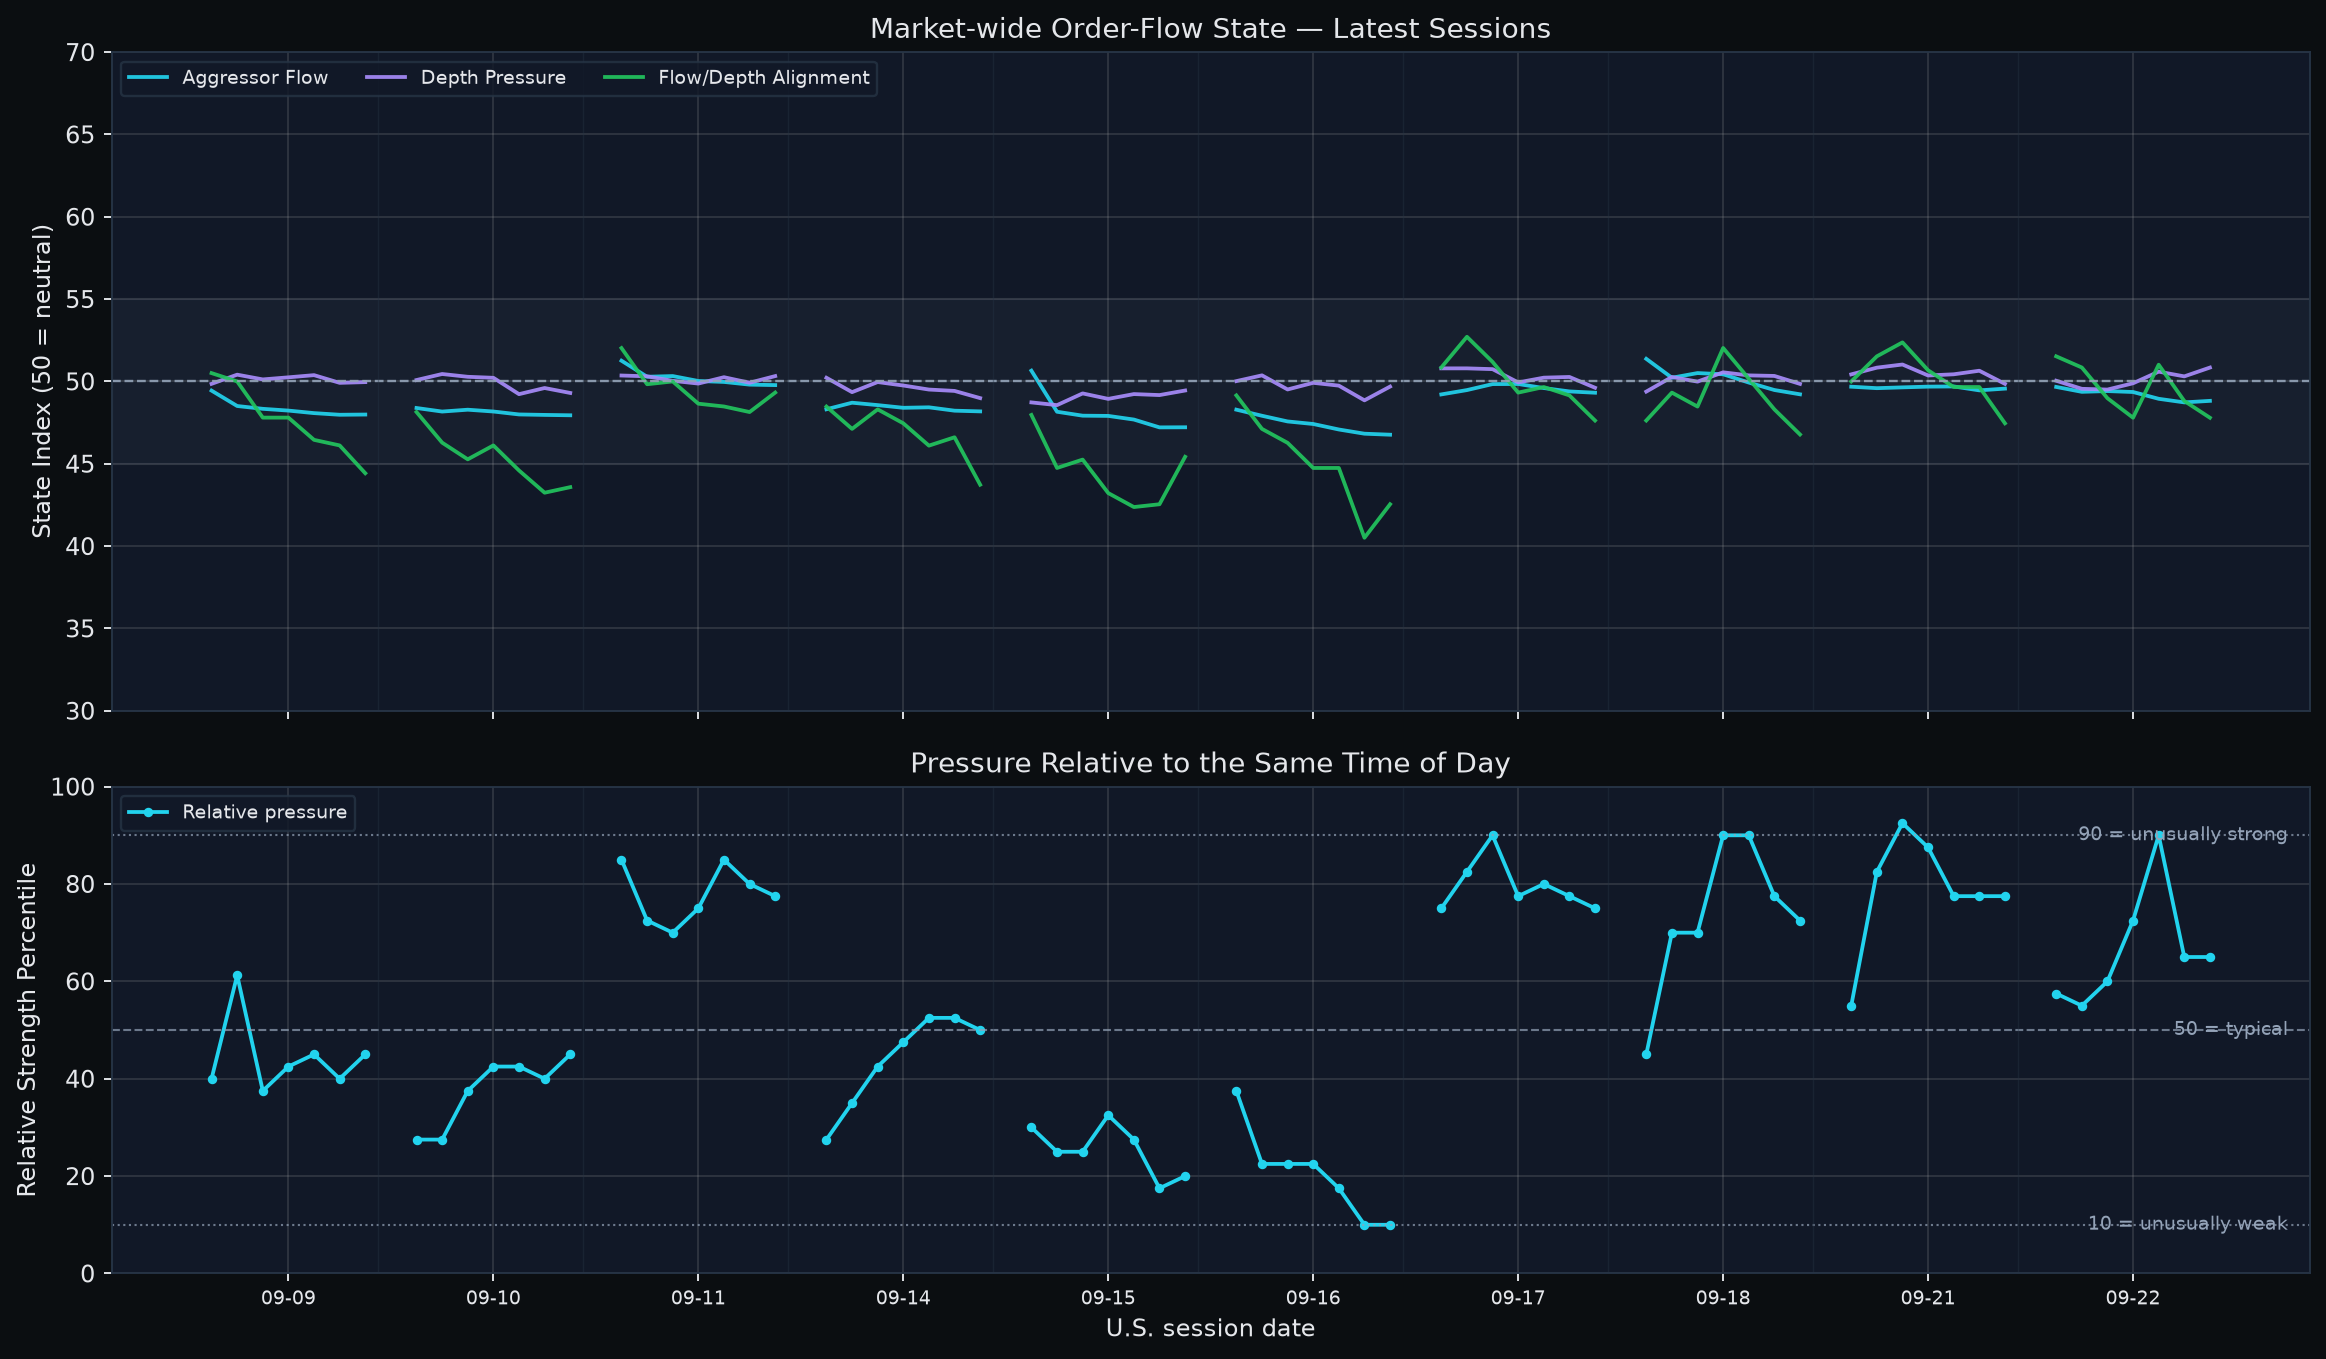
The order-flow path is much less clean. Aggressor Flow spent all seven regular-session checkpoints below 50 and deteriorated from 49.67 at the open to 48.82 at the close. Depth Pressure recovered and finished above neutral at 50.84, but Flow/Depth Alignment fell from 51.53 to 47.80 and deteriorated sharply after a 13:30 recovery. Bull-aligned breadth fell from 21.7% to 14.2%, while Bear-aligned breadth finished 18.6%. The equal-weight basket still gained about 0.19% from open to close and the closing same-time percentile was 65. This is not a failed market in price; it is a market whose supportive displayed depth has not been matched by neutral-or-better aggressor participation.
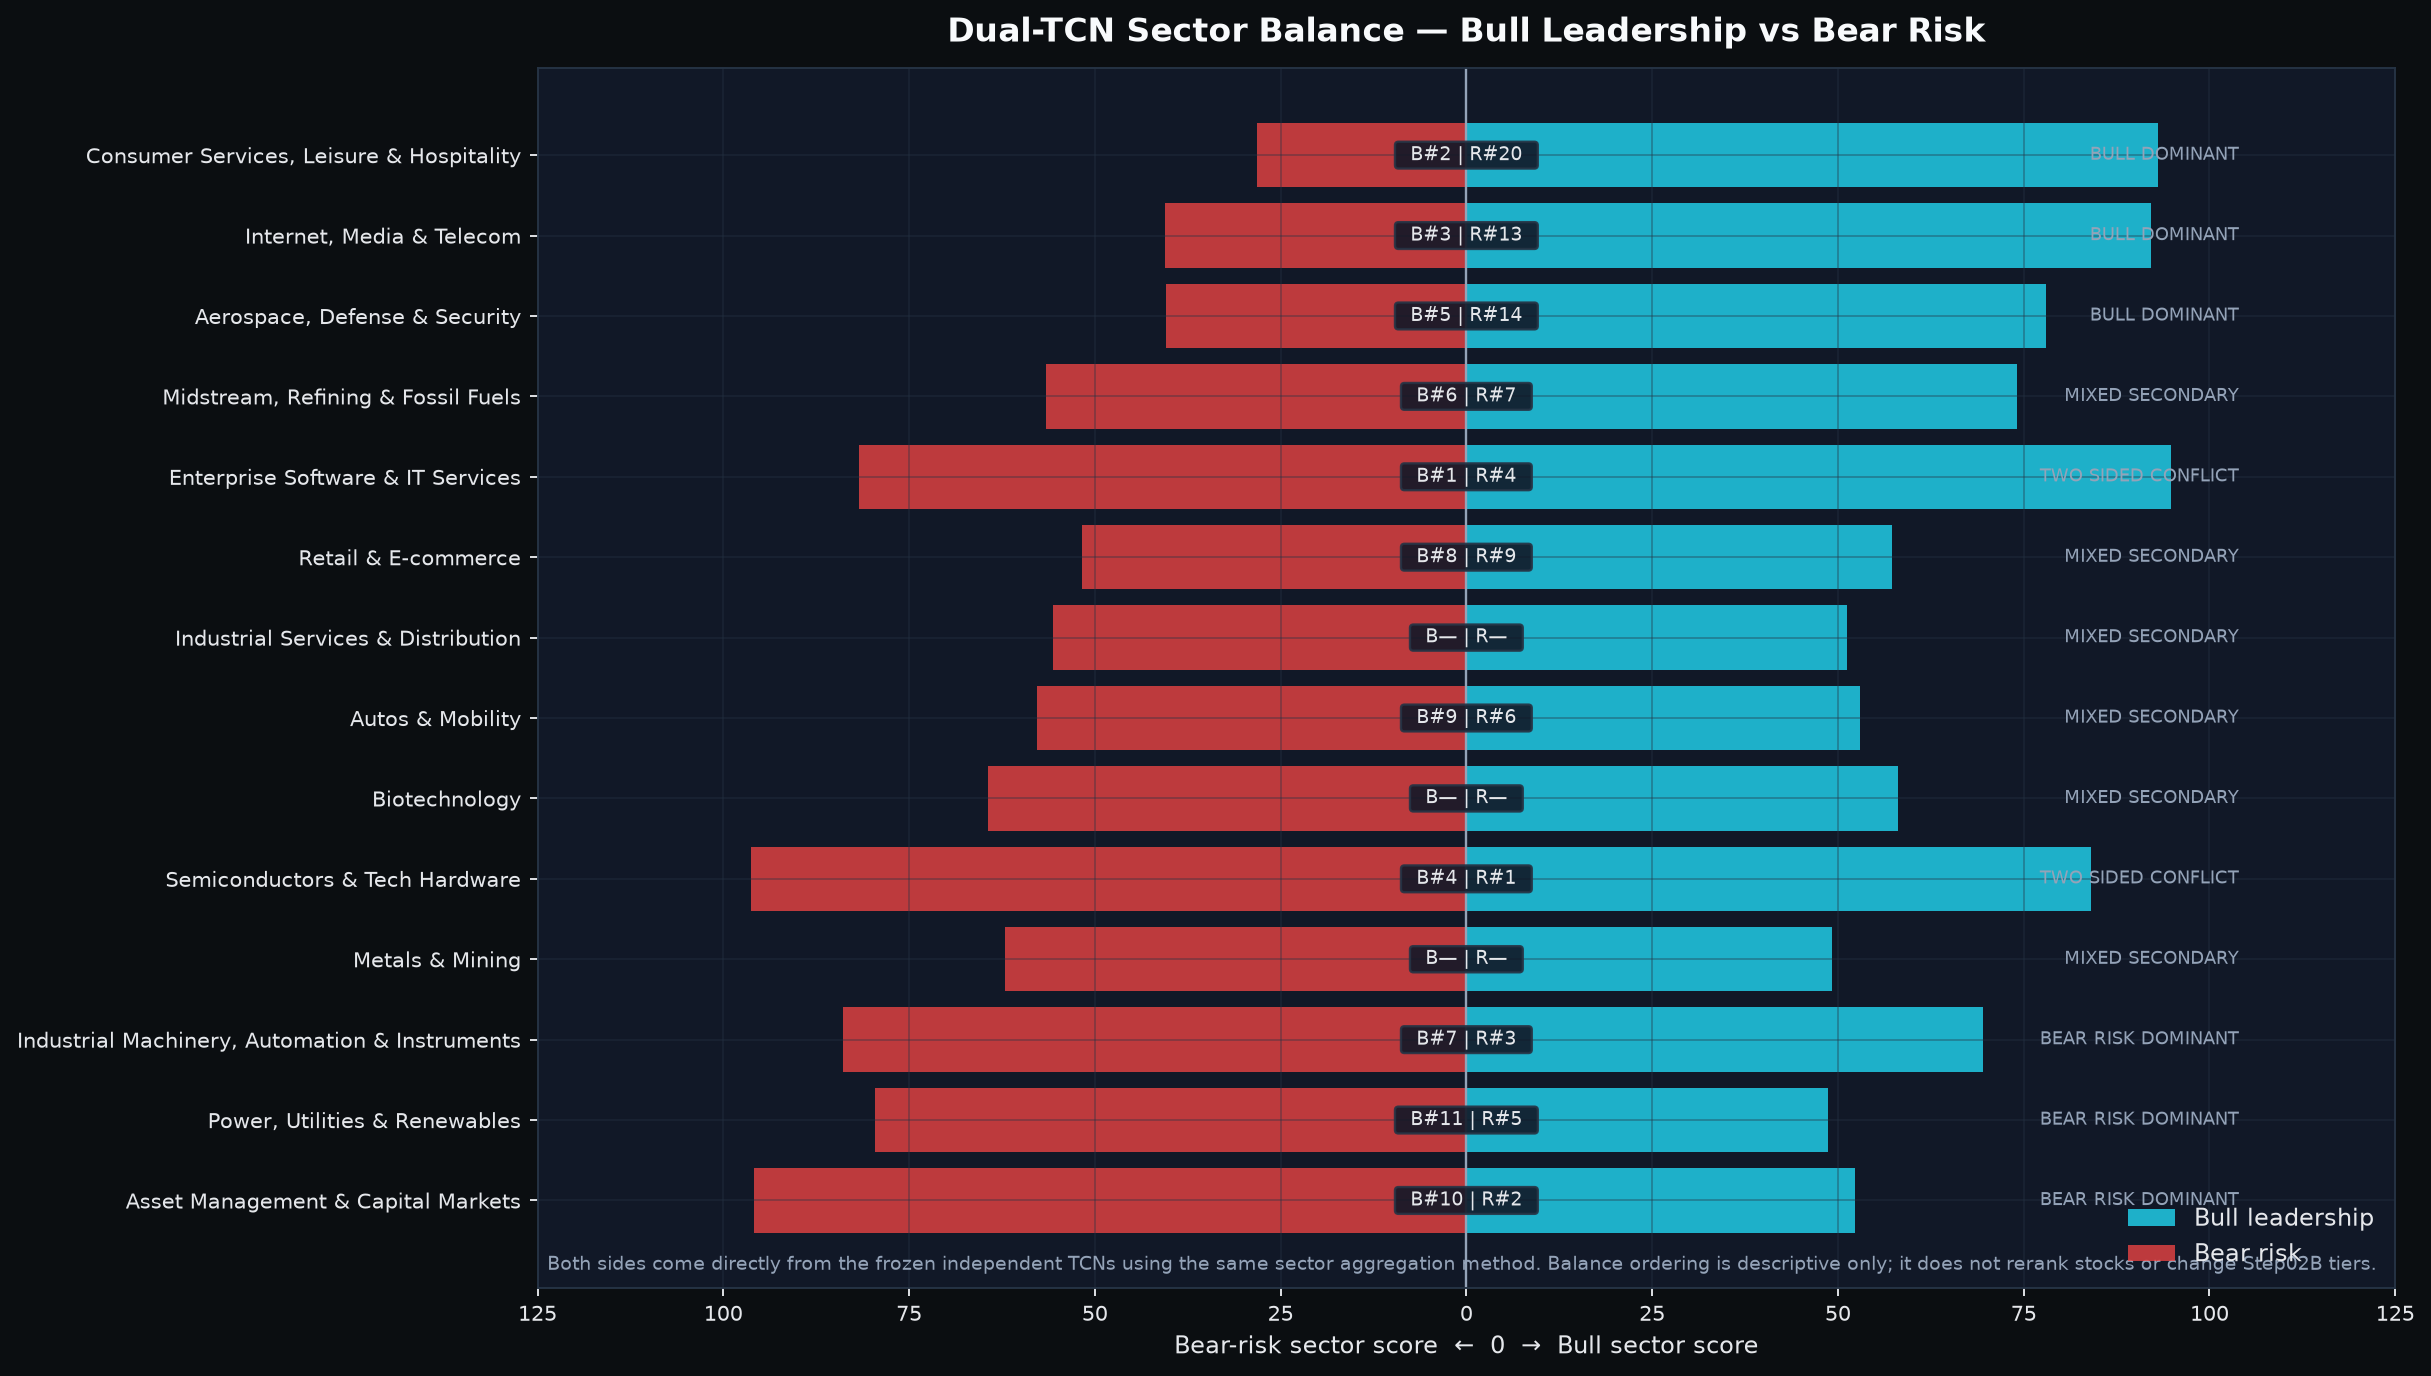
The sector map also changed materially from one session earlier. On September 21, the Bull Top 5 were Asset Management, Oil & Gas, Industrial Services, Semiconductors and Midstream. On September 22, Enterprise Software entered at #1, Consumer Services at #2, Internet/Media at #3 and Aerospace at #5; Semiconductors alone remained, still at #4. That is a wholesale rotation away from the prior financial/energy/industrial mix toward software, consumer, digital media and space. Yet the rotation is not uniformly clean: Enterprise Software is Bear-risk #4 and Semiconductors are Bear-risk #1. My base case is therefore constructive but selective: healthy price/breadth and a growth-oriented leadership reset are real, but weak Aggressor Flow and two-sided technology sectors keep the next-session confirmation burden high.
How to read today’s indicators
| Indicator | Scale / reference | Reader interpretation |
|---|---|---|
| Market-wide order-flow state | Three state indices; 50 = neutral | Aggressor Flow, Depth Pressure and Flow/Depth Alignment answer different questions. Read confirmation and divergence across all three; they are not probabilities. |
| Same-time order-flow percentile | 0-100; 50 = same-time historical median | 90 is unusually strong and 10 unusually weak for that intraday slot. It is not an event probability. |
| Flow x depth state breadth | Cross-sectional percentages | Bull/Bear aligned show joint direction; absorption-compatible breadth shows flow/depth disagreement compatible with absorption, not actor identity or intent. |
| Market breadth | 0-1; about 0.50 = balance | Level measures participation; direction and slope show whether participation is broadening or narrowing. |
| z-score | 0 = historical mean | |1| is notable and |2| unusual. It is standardized distance, not probability. |
| Historical percentile | 0-100; 50 = median | 90+ is historically elevated, but not an event probability. |
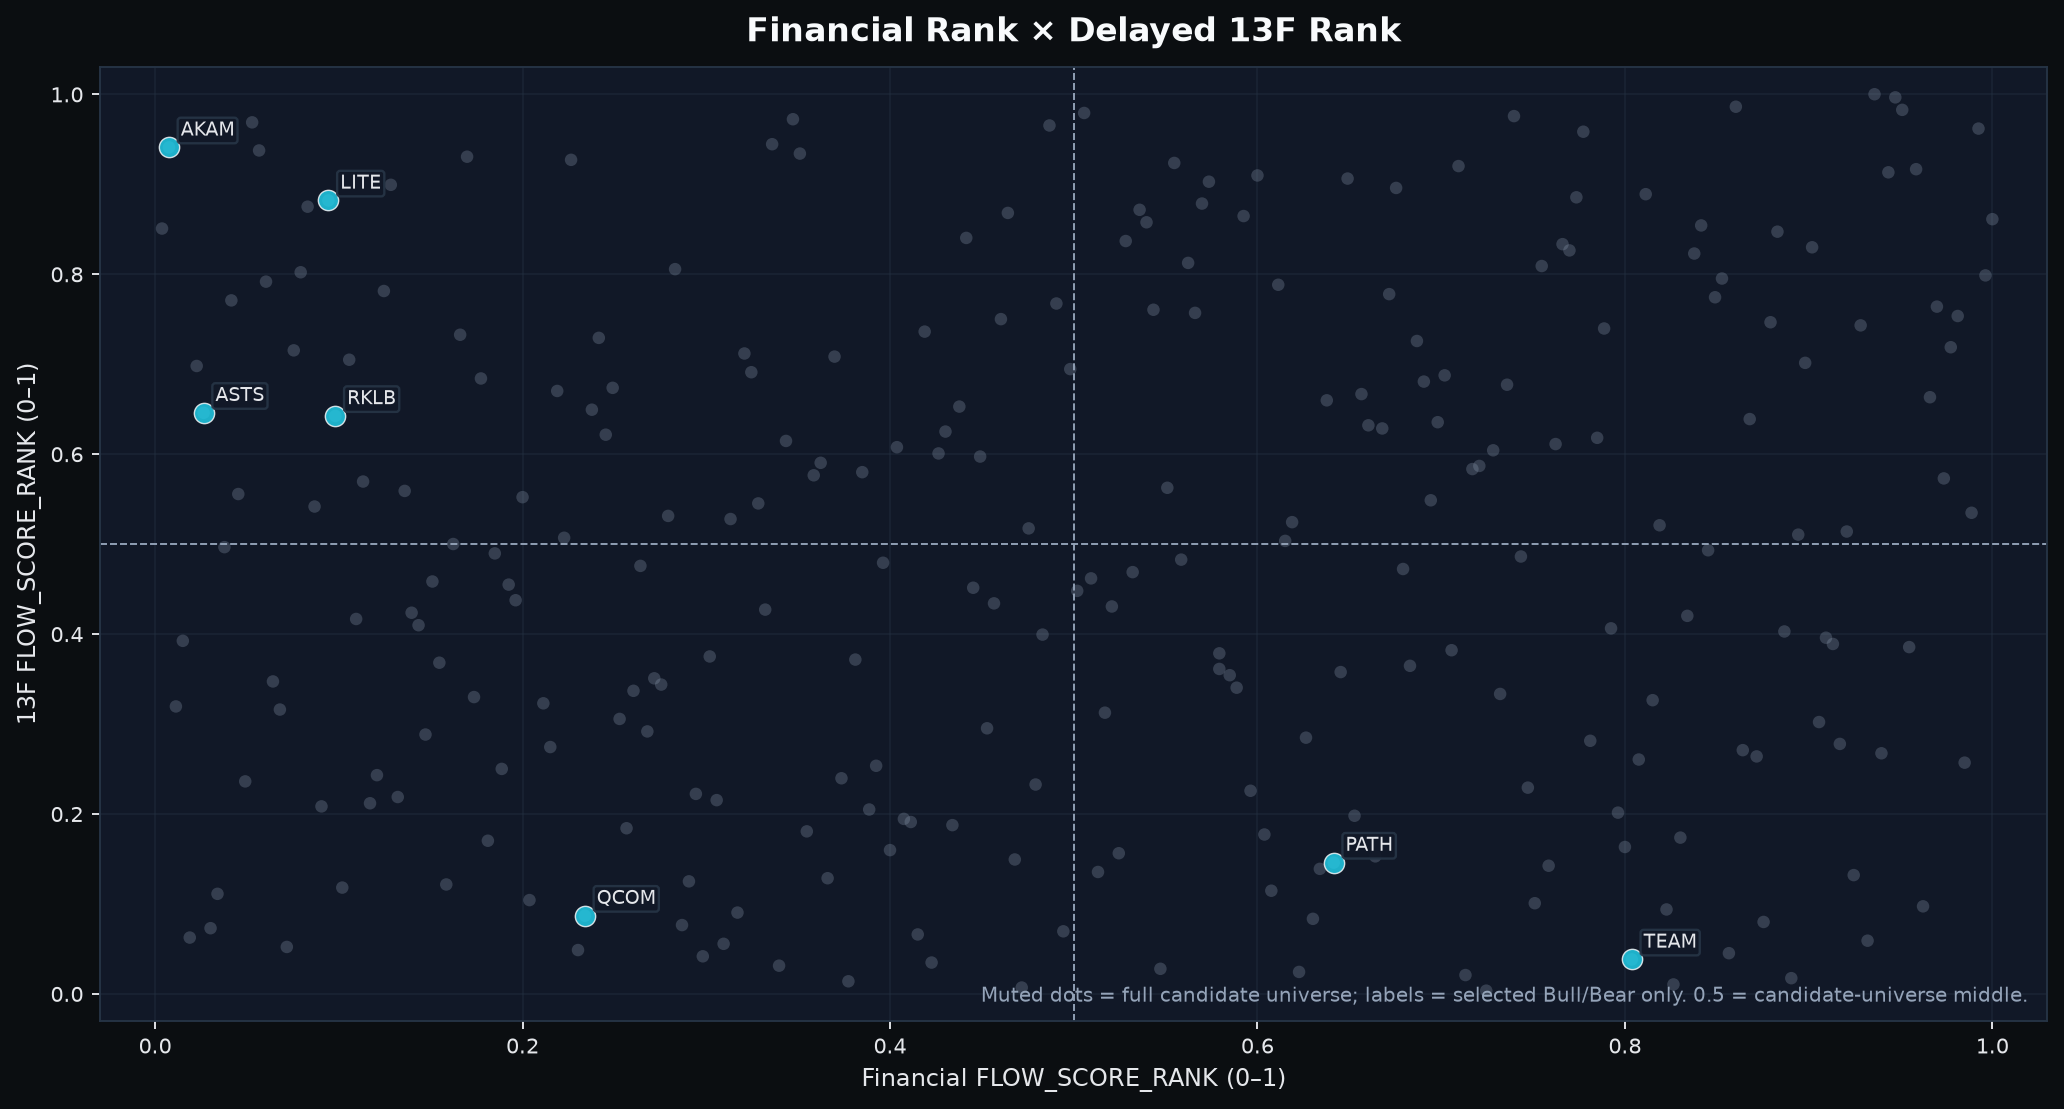
| Financial / delayed-holdings context rank | 0-1; 0.50 = cross-sectional middle | Higher values mean stronger slow context among current candidates. Delayed holdings are not today’s institutional flow. |
| Slow-context versus price divergence | Centered near 0 | Positive means slow context is stronger than price rank; negative means price is ahead. It is not a standalone signal. |
| Expected next-session trading range | High-low amplitude, non-directional | When supplied, read the raw range estimate with its same-day cross-sectional percentile. It is not an upside target. |
1. Price and breadth are healthy; fresh downside damage is not propagating
| Layer | Current evidence | Interpretation | What would change the read |
|---|---|---|---|
| Index price | S&P: MA5 +1.18%, MA20 +1.25%; Nasdaq: MA5 +2.20%, MA20 +3.29% | Both benchmark trends are above short and medium averages, with Nasdaq leading. | A joint MA5 loss with weakening breadth would challenge the repaired surface. |
| Breadth | 0.520; 5-day change +0.182; slope -0.40 z | Participation is slightly above balance and has improved sharply over five sessions. | Sustained breadth below 0.50 would make the index strength less trustworthy. |
| Downside damage | 20-day new-low z +0.96; 252-day new-low z +0.14; down-3% breadth z -0.70; dispersion z -1.05 | New-low pressure is not broadening into large-decline breadth or dispersion. | A joint rise in new lows, large-decline breadth and dispersion would mark propagation. |
| Structural-warning memory | Systemic-warning percentile ~94%; structural-watch ~93% | Historically elevated configurations remain, but are not calibrated crash probabilities. | Current price/breadth deterioration and renewed damage would be needed to convert warning memory into an active breakdown thesis. |
The internal improvement is substantive. The indices are not being held up by price alone: breadth has moved above balance, the McClellan layer is positive, and both large-decline breadth and cross-sectional volatility are quiet. Even the longer-horizon 252-day new-low measure, which had been a persistent source of concern in earlier sessions, is now much closer to neutral. That combination makes the current tape healthier than a narrow-cap-weighted rebound.
The strongest counterevidence sits in the structural-warning memory and macro layer rather than in immediate damage. Funding-price stress is still historically elevated, and the frozen systemic-warning configurations remain active. Those states are reasons to keep a falsifier explicit, not reasons to override today’s healthier breadth and damage evidence. The key distinction is current propagation versus historical vulnerability: vulnerability remains high, but current propagation is not visible.
2. Depth stayed supportive, but Aggressor Flow never joined it
| ET | Aggressor Flow | Depth Pressure | Flow/Depth Alignment | Same-time %ile | Bull aligned | Bear aligned | Buy absorption | Sell absorption | EW bar |
|---|---|---|---|---|---|---|---|---|---|
| 09:30 | 49.67 | 50.04 | 51.53 | 57.5 | 21.7% | 18.6% | 15.6% | 15.3% | -0.142% |
| 10:30 | 49.37 | 49.55 | 50.85 | 55.0 | 18.6% | 16.9% | 14.6% | 16.3% | -0.040% |
| 11:30 | 49.42 | 49.51 | 48.98 | 60.0 | 13.2% | 15.3% | 18.0% | 18.3% | +0.061% |
| 12:30 | 49.36 | 49.89 | 47.80 | 72.5 | 16.3% | 20.7% | 16.9% | 14.2% | +0.125% |
| 13:30 | 48.95 | 50.59 | 51.02 | 90.0 | 15.9% | 13.9% | 15.9% | 9.2% | +0.086% |
| 14:30 | 48.73 | 50.31 | 48.81 | 65.0 | 15.3% | 17.6% | 18.0% | 10.2% | -0.012% |
| 15:30 | 48.82 | 50.84 | 47.80 | 65.0 | 14.2% | 18.6% | 18.6% | 9.8% | -0.021% |
The session never produced a true three-axis repair. Aggressor Flow opened below neutral and never crossed 50. Depth weakened into late morning, then recovered above 50 after 13:30 and closed at its session high. Alignment was much less stable: it began above neutral, fell to 47.80 by 12:30, briefly recovered to 51.02 at 13:30, then lost neutral again and closed back at 47.80. The 13:30 bar was therefore a genuine repair attempt in Depth and Alignment, but it was never confirmed by Aggressor Flow.
The breadth path reinforces that split. Bull-aligned breadth fell 7.5 percentage points from open to close, while buy-absorption-compatible breadth rose about 3.1 points and sell absorption fell. In the last two bars, Bear-aligned breadth increased while Bull-aligned breadth weakened. At the same time, the equal-weight basket still rose about 0.19% from open to close and the same-time percentile finished above median at 65. The correct label is late deterioration with partial state support: Depth is constructive, Aggressor and Alignment are not.
That distinction defines the next-session burden. A constructive reset requires Aggressor Flow to reclaim 50 early and persist, while Alignment needs to recover neutral without another late failure. Depth merely staying above 50 is not enough if Aggressor remains below neutral. Conversely, a brief weak open would not by itself invalidate the thesis if the lagging axes reclaim quickly and breadth/damage remain healthy. This is a confirmation test, not a forecast of buyer or seller exhaustion.
3. Cross-asset conditions still carry macro stress, but the 20-day preference shift favors equities
| Cross-asset layer | Current state | 20-day / decomposition context | Read |
|---|---|---|---|
| Funding-price stress | +2.47 z | 96th historical percentile | Still a material headwind. |
| Liquidity impulse | -1.58 z | Very weak trailing percentile | Does not confirm an easy-liquidity risk-on regime. |
| Equity relative preference | +1.72 z | 20-day change +0.867 | Recent relative-price change strongly favored equities. |
| Credit risk appetite | -0.93 z | Weak relative state | Credit is a meaningful non-confirmation. |
| Duration preference | +1.13 z | Long-Treasury 20-day attribution -0.094 | Current duration state is positive, but Treasuries did not drive the recent R change. |
| Cross-asset coupling | +0.89 z | 20-day K change +0.060 | Moderate coupling increase; node attribution matters. |
Duration preference and 20-day R anatomy answer different questions. Duration describes the current relative state; the R destination decomposition asks which sleeves explain the change in relative preference over the last 20 trading days. Over that window, equity relative preference strengthened by about +0.867. Every non-equity sleeve made a negative contribution to the R gap, including industrial metals (-0.061), investment-grade credit (-0.085), long Treasuries (-0.094), energy (-0.107), high yield (-0.116) and precious metals (-0.155). This is not observed money flow. It says the recent relative-price structure improved faster for equities than for those sleeves.
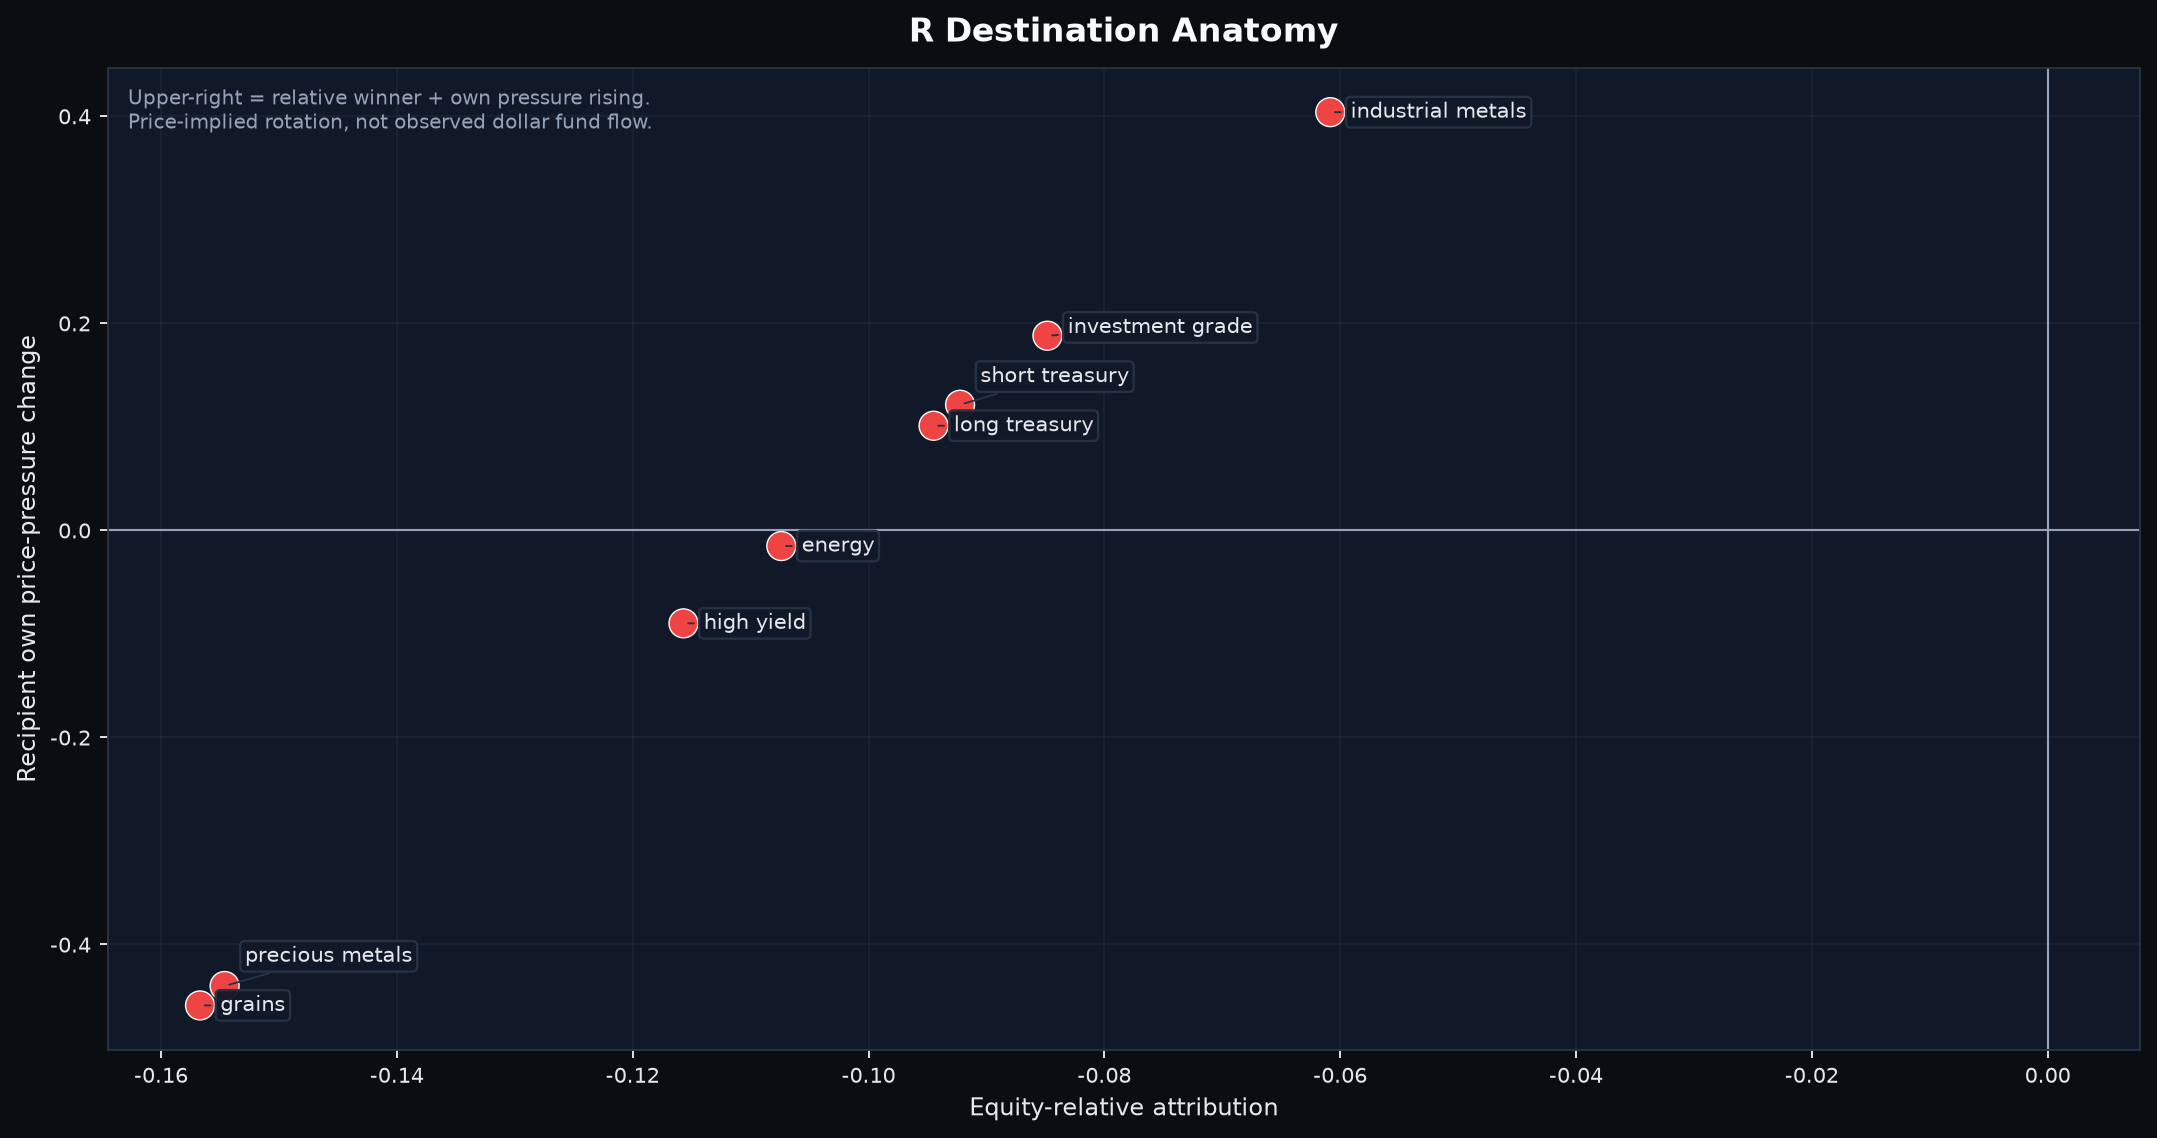
The K decomposition also prevents a simplistic “higher coupling = equity-led stress” interpretation. The 20-day increase in coupling was driven primarily by industrial metals (+0.0213), energy (+0.0166), precious metals (+0.0155) and long Treasuries (+0.0072), while the equity node contributed slightly negatively (-0.0030). The common-mode increase therefore comes mainly from real assets and duration, not from equities locking the system into one risk-off mode.
CFTC positioning is a slower cross-check. The latest report is dated September 15, five trading days before this market close, and is fresh under the normal weekly release schedule. Equity positioning change is weak in that snapshot (-1.36 z on the packet’s four-report comparison), and industrial-metals positioning is also weak (-1.59 z), so the weekly data do not strongly confirm the newer equity-relative move or the real-asset K contribution. Because five trading days remain outside the snapshot, that is soft counterevidence, not a same-day veto.
4. Leadership rotated from financial/energy sectors into software, consumer, media and space
| Bull rank | Sector | Bear-risk rank | Balance state | Representative tickers | Public read |
|---|---|---|---|---|---|
| 1 | Enterprise Software & IT Services | 4 | TWO_SIDED_CONFLICT | AKAM, PATH, INTU, MSTR, NET, CRWV, TEAM | Deep Bull breadth, but meaningful opposing risk remains. |
| 2 | Consumer Services, Leisure & Hospitality | 26 | BULL_DOMINANT | DKNG, CCL, RCL, ABNB, MAR, EXPE, BKNG | Cleaner Bull dominance, though representative price confirmation is uneven. |
| 3 | Internet, Media & Telecom | 19 | BULL_DOMINANT | TTD, APP, CMCSA, SPOT, TTWO, META, NFLX | Digital-ad/media leadership with limited Bear-risk pressure. |
| 4 | Semiconductors & Tech Hardware | 1 | TWO_SIDED_CONFLICT | ASTS, LITE, AXTI, SNDK, SMCI, QCOM, IONQ | Strong Bull names coexist with the market’s highest sector Bear-risk. |
| 5 | Aerospace, Defense & Security | 20 | BULL_DOMINANT | RKLB, NOC, BA, LMT, LHX, RTX, HWM | Leadership is concentrated in a small number of current winners. |
The one-session transition is unusually large. Asset Management, Oil & Gas, Industrial Services and Midstream all left the Bull Top 5; Enterprise Software, Consumer Services, Internet/Media and Aerospace entered, while Semiconductors held #4. That is not observed sector money flow, but it is a clear shift in the frozen Bull ranking toward growth, digital consumption and space-related exposure. Reuters’ September 22 market reporting is consistent with part of that mechanism: the Nasdaq reached a record close as AI-related stocks remained strong, while oil prices fell below $100 and bond yields eased.
Economic anatomy of the current Bull Top 5
| Sector | Current leading subcluster(s) | Key names | Economic linkage | Quant / price confirmation | Why now / public mechanism | Strongest counterevidence |
|---|---|---|---|---|---|---|
| Enterprise Software & IT Services | AI/cloud infrastructure; collaboration/automation; cloud security | AKAM, CRWV, TEAM, PATH, NET | Enterprise AI workloads, cloud delivery, security and automation budgets | Four final support names; AKAM +9.7% vs MA20, CRWV +0.8%, TEAM +1.5%, PATH -14.5% | Akamai reported Cloud Infrastructure Services +39% YoY and multi-year AI/cloud contracts; CoreWeave reported record Q2 revenue/backlog and accelerating enterprise demand; Atlassian and UiPath continue to emphasize AI-powered collaboration and agentic automation. | Bear-risk #4; PATH remains far below MA20 and slow-context ranks conflict sharply across AKAM/TEAM/PATH. |
| Consumer Services, Leisure & Hospitality | Online gaming; cruise/travel; lodging/booking | DKNG, CCL, RCL, ABNB, MAR, EXPE | Discretionary activity and travel demand | No final publication stock; DKNG/CCL/RCL are the current Bull Top30 representatives, but price geometry is mixed. | Falling oil and easing yields reduced a major macro headwind on September 22. No single sector-wide public catalyst was identified. | Lack of a selected support-confirmed stock and uneven representative price confirmation make this more of a sector-rank signal than a clean stock-level setup. |
| Internet, Media & Telecom | Digital advertising; media/platform monetization | TTD, APP, CMCSA, SPOT, TTWO | Digital ad budgets, consumer engagement and AI-driven monetization | Five Bull Top30 representatives, but several remain below short moving averages. | AppLovin reported 59% YoY Q1 revenue growth and continues to position AI-driven advertising software as its core engine; broader AI optimism supported technology risk appetite. | No final publication stock and mixed short-term price geometry across the representative set. |
| Semiconductors & Tech Hardware | AI optical connectivity; edge compute; satellite/communications hardware | QCOM, AXTI, LITE, ASTS, SNDK, SMCI | AI bandwidth, high-speed optical links, edge AI and communications infrastructure | Four final support names; AXTI +20.4% vs MA20, QCOM +12.7%, ASTS +4.7%, LITE +3.9% | AXT reported record InP revenue and strong AI/data-center optical demand; Lumentum reported $1.01B Q4 revenue and accelerating optical/cloud demand; Qualcomm’s Snapdragon Summit opened September 22. | Bear-risk #1 with many hardware names simultaneously in the opposing cohort; AXTI’s price is already far above MA20 and its filing-based cash-flow context is weak. |
| Aerospace, Defense & Security | Launch services; space systems and communications | RKLB, NOC | Commercial/government launch demand and space infrastructure | RKLB is Bull #4 and 0.33 ATR from current support; NOC is the only other Bull Top30 representative. | Rocket Lab reported Q2 revenue of $234M (+62% YoY) and record backlog of $2.36B, with more launch contracts signed after quarter-end. | Leadership is narrow rather than broad across the sector; strength depends heavily on RKLB. |
The synthesis is a growth-oriented rotation with sector overlays, not one universal macro factor. AI/cloud and optical bandwidth connect Enterprise Software and Semiconductors; easier oil/yield conditions help consumer-facing groups; aerospace has its own contract/backlog cycle. The strongest challenge to a clean risk-on interpretation is that the two technology-heavy sectors are also the most conflicted: Enterprise is Bear-risk #4 and Semiconductors Bear-risk #1. The sector map therefore supports selective growth leadership, not indiscriminate beta.
5. Nine support-confirmed names: the primary setup is close to structural support, not the story around them
| Stock | Sector | Selection tier/role | Bull rank (of 295) | Bear rank (of 295) | Recent support confirmation | Distance from live support | vs MA5 / MA20 | Slow context |
|---|---|---|---|---|---|---|---|---|
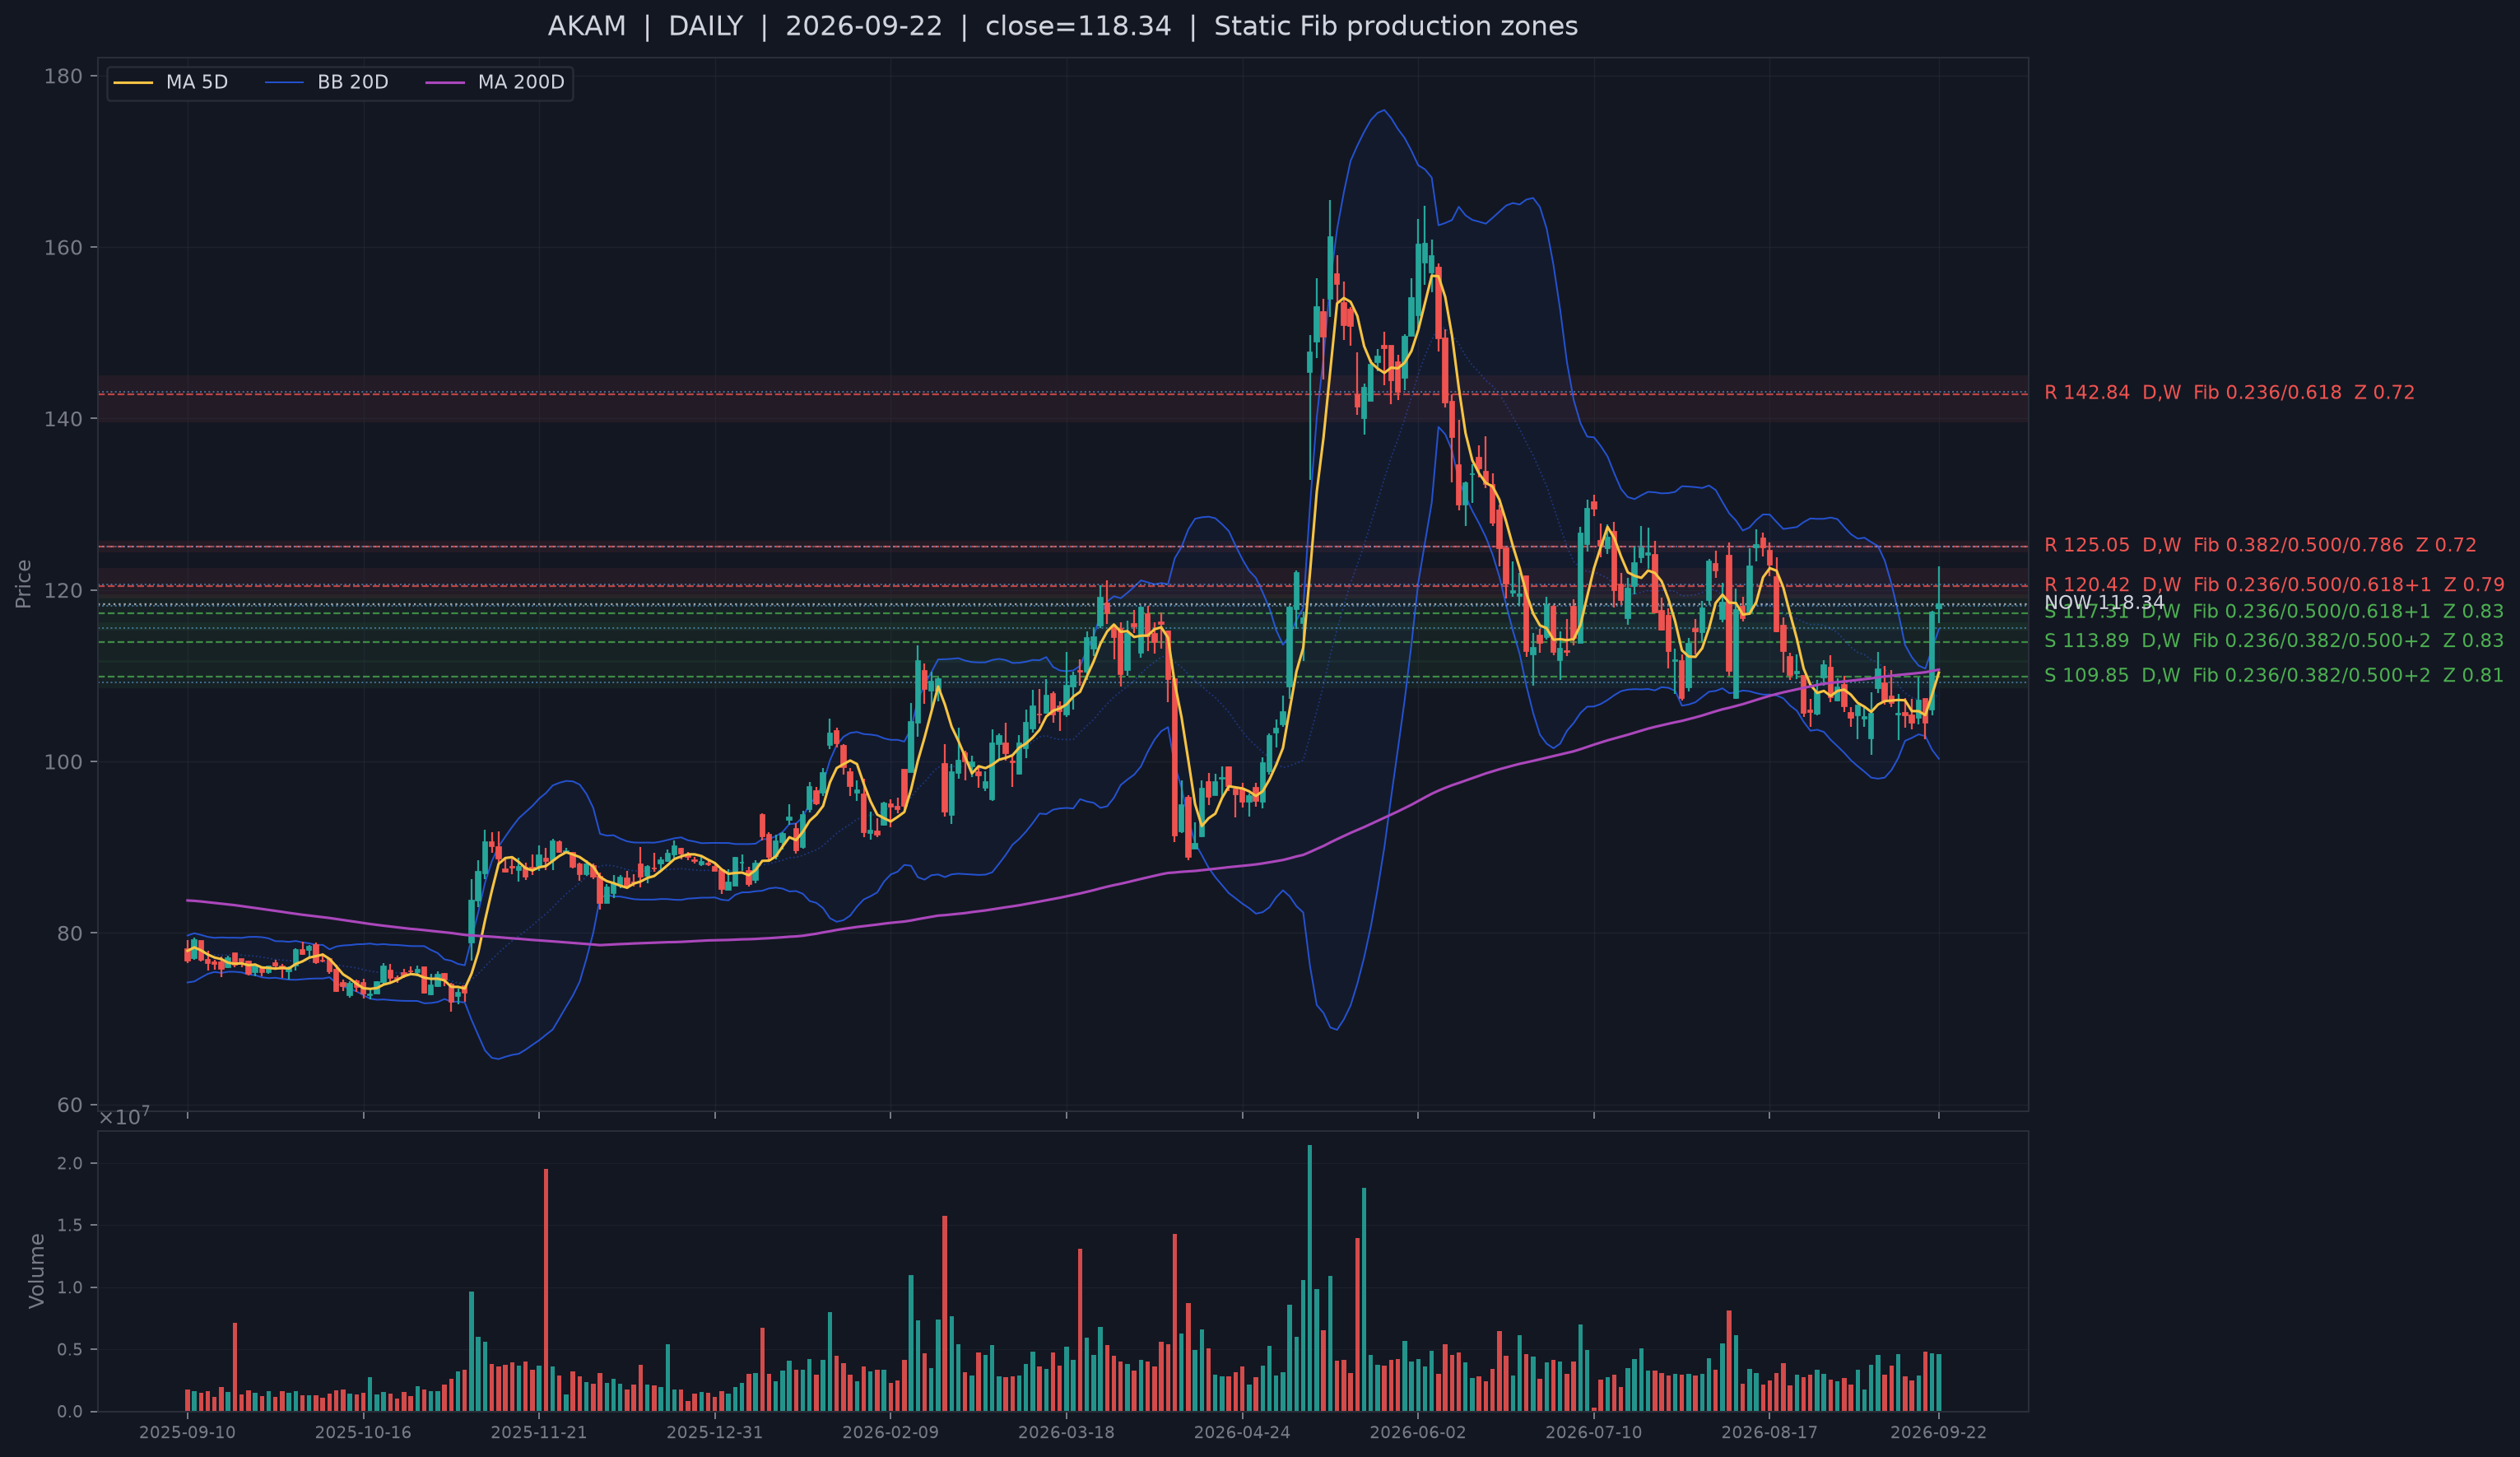
| AKAM | Enterprise Software & IT Services | A+ Bull screen | #2 of 295 | #121 of 295 | Same-day bullish center reclaim; 0TD ago | 0.88% / 0.19 ATR | +7.2% / +9.7% | Fin 0.01; price divergence +0.11 / 13F 0.94; price divergence +0.78 |
| QCOM | Semiconductors & Tech Hardware | B Bull screen | #20 of 295 | #42 of 295 | Same-day bullish center reclaim; 0TD ago | 1.11% / 0.25 ATR | +5.0% / +12.7% | Fin 0.23; price divergence +0.29 / 13F 0.09; price divergence +0.12 |
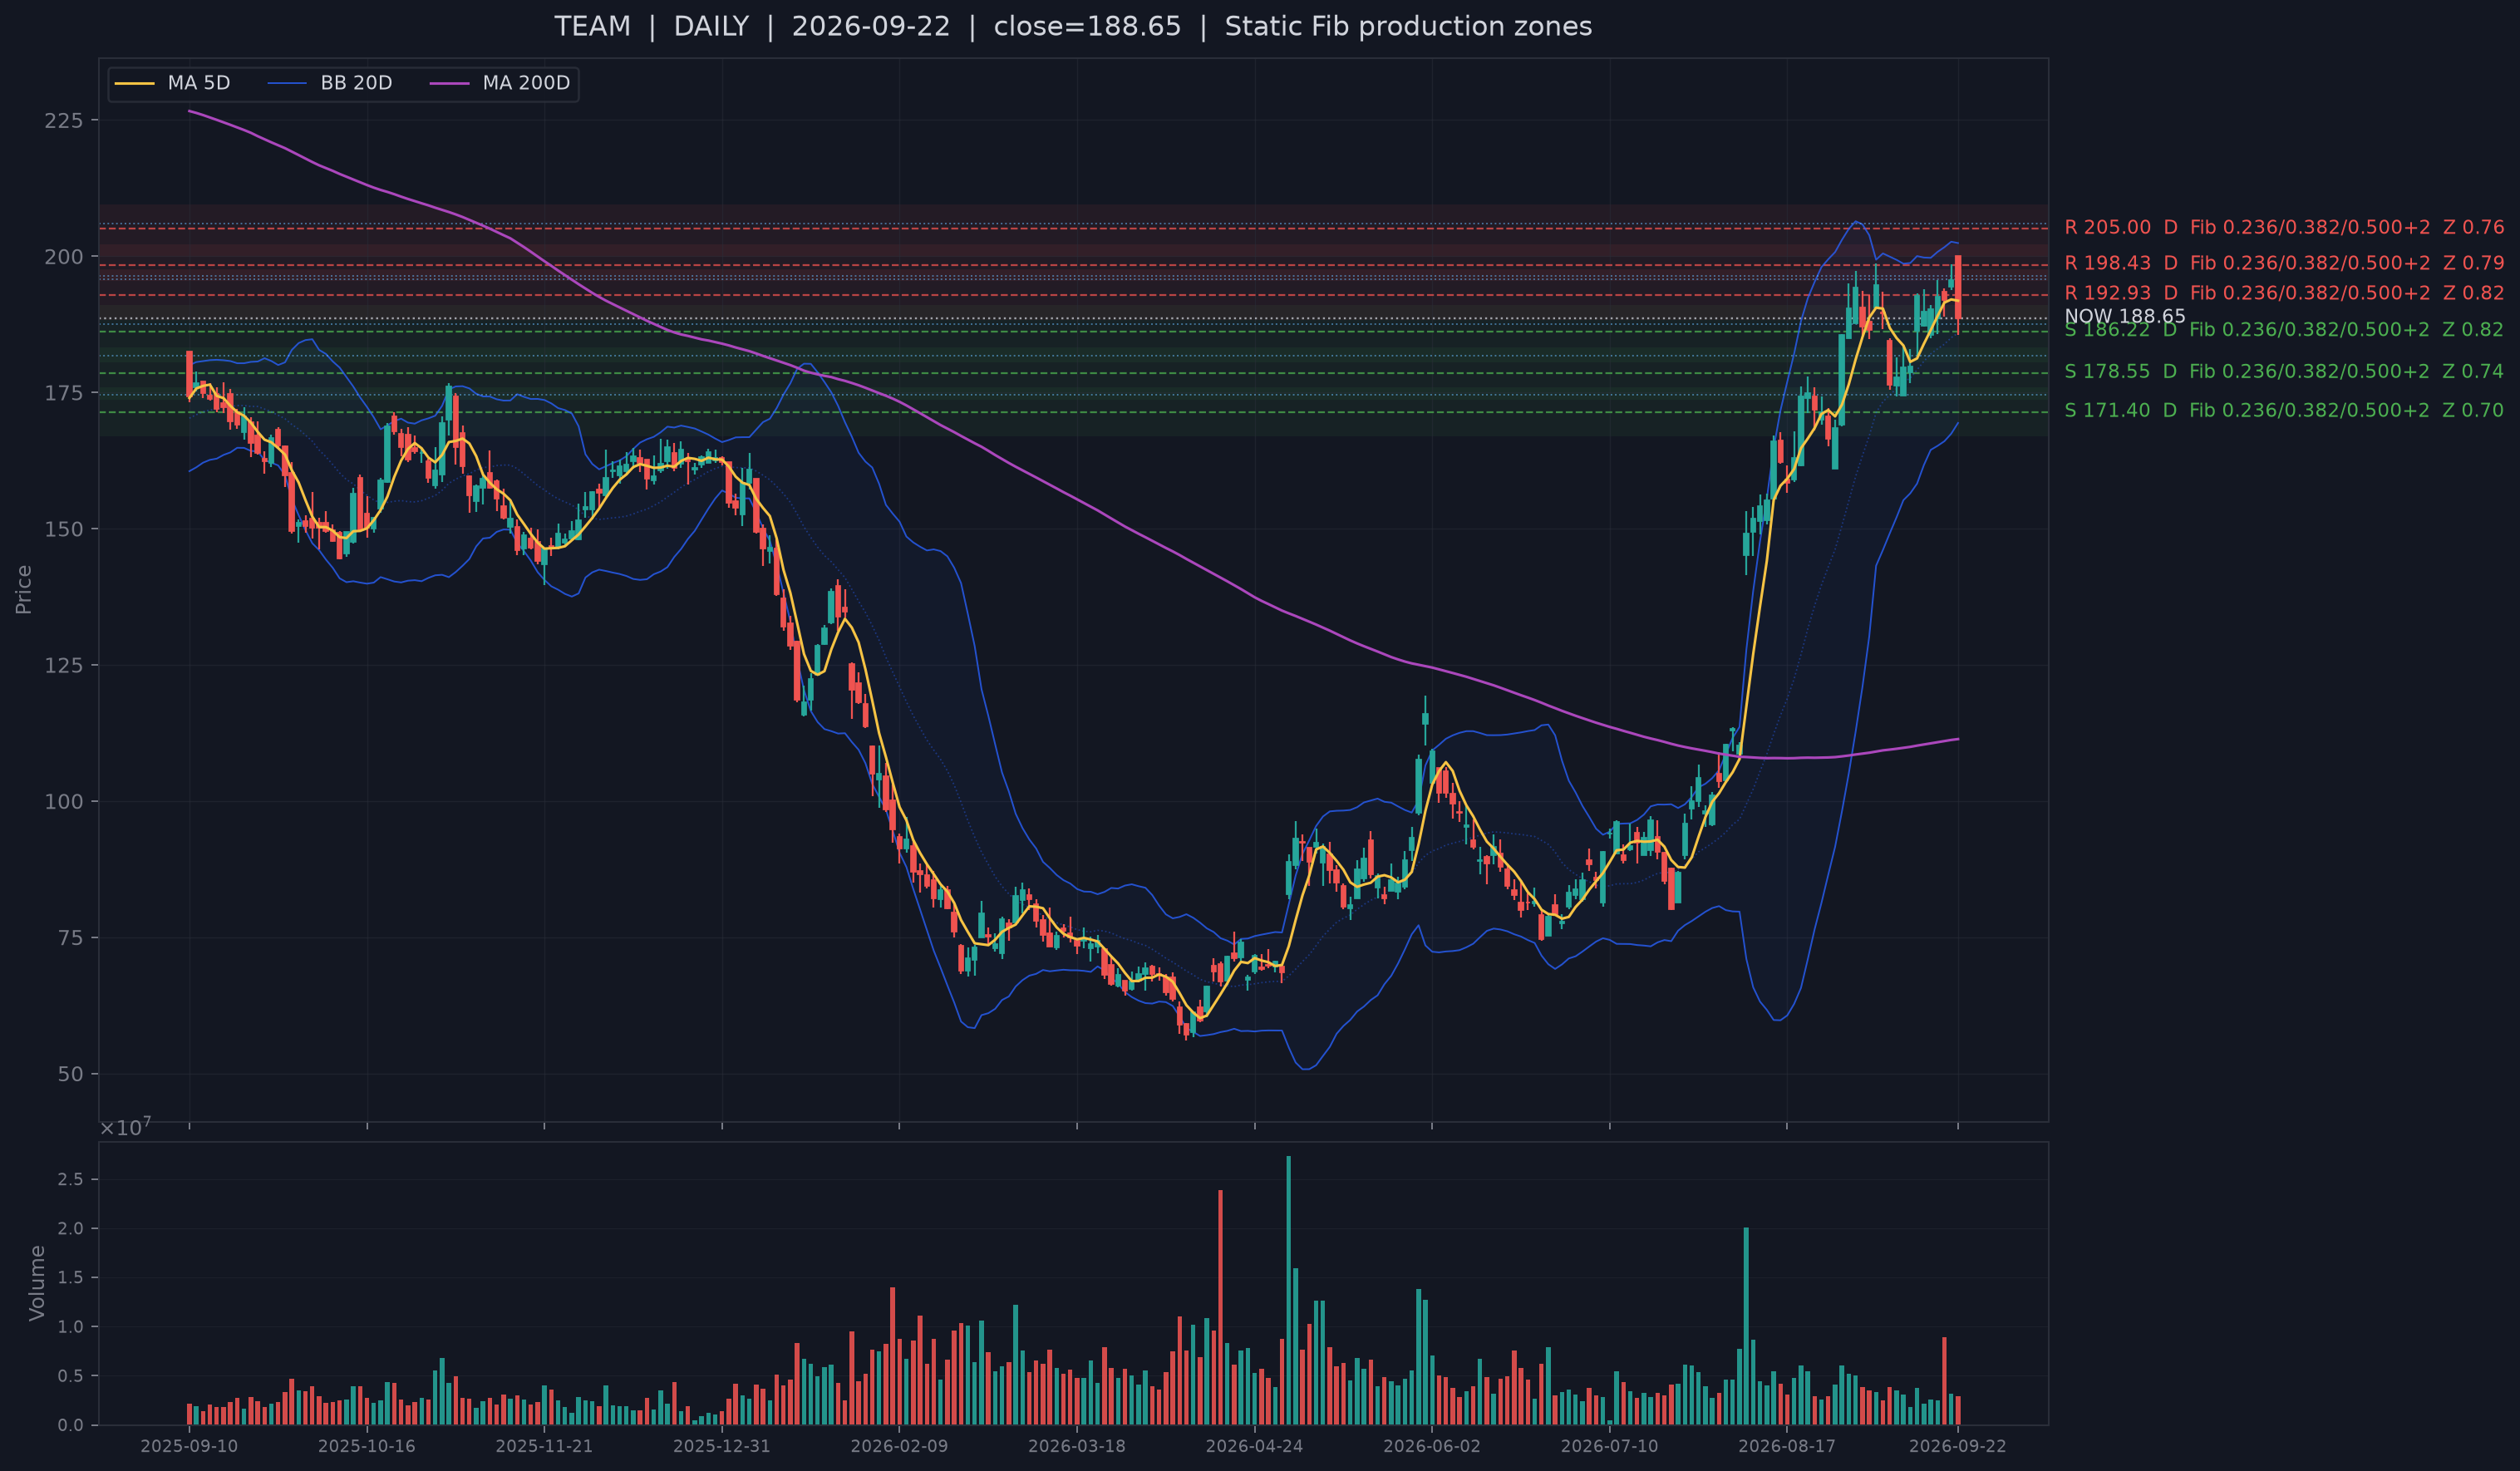
| TEAM | Enterprise Software & IT Services | B Bull screen | #21 of 295 | #91 of 295 | Next-day confirmation after lower-wick test; 1TD ago | 1.31% / 0.27 ATR | -1.7% / +1.5% | Fin 0.80; price divergence -0.35 / 13F 0.04; price divergence -0.78 |
| AXTI | Semiconductors & Tech Hardware | A+ Bull screen | #14 of 295 | #50 of 295 | Same-day bullish center reclaim; 0TD ago | 2.73% / 0.30 ATR | +8.1% / +20.4% | Official-filing fallback: revenue YoY +164.8%, CFO margin -4.6%, FCF margin -15.6% / 13F 0.89; price divergence +0.72 |
| LITE | Semiconductors & Tech Hardware | A Bull screen | #11 of 295 | #81 of 295 | Same-day bullish center reclaim; 0TD ago | 2.33% / 0.33 ATR | +1.8% / +3.9% | Fin 0.09; price divergence -0.17 / 13F 0.88; price divergence +0.32 |
| RKLB | Aerospace, Defense & Security | A Bull screen | #4 of 295 | #57 of 295 | Same-day bullish center reclaim; 0TD ago | 1.80% / 0.33 ATR | +6.5% / +10.7% | Fin 0.10; price divergence +0.33 / 13F 0.64; price divergence +0.64 |
| CRWV | Enterprise Software & IT Services | A Bull screen | #15 of 295 | #71 of 295 | Same-day bullish center reclaim; 0TD ago | 3.16% / 0.46 ATR | +4.1% / +0.8% | Official-filing fallback: revenue YoY +112.5%, CFO margin +91.1%, FCF margin -179.9% / Institutional ownership snapshot 76.7% (fallback; not a 13F flow rank) |
| ASTS | Semiconductors & Tech Hardware | A+ Bull screen | #10 of 295 | #35 of 295 | Same-day bullish center reclaim; 0TD ago | 4.11% / 0.59 ATR | +4.0% / +4.7% | Fin 0.03; price divergence +0.23 / 13F 0.65; price divergence +0.64 |
| PATH | Enterprise Software & IT Services | A Bull screen | #5 of 295 | #229 of 295 | Same-day bullish center reclaim; 1TD ago | 4.17% / 0.62 ATR | -2.0% / -14.5% | Fin 0.64; price divergence -0.39 / 13F 0.15; price divergence -0.69 |
All nine names are within 0.62 ATR of their current structural-support centers, and the upstream order is preserved exactly. The important analytical job is not to restate nine support touches. It is to separate support confirmation, trend confirmation and slow-context confirmation, because they often disagree.
The slower evidence is especially useful today. AKAM is an extreme disagreement: Financial context rank is only 0.01 while delayed-holdings context is 0.94. TEAM is almost the mirror image at 0.80 versus 0.04. LITE is 0.09 versus 0.88; PATH is 0.64 versus 0.15. AXTI has no comparable Financial percentile rank, but official-filing fallback shows revenue growth of +164.8% with CFO margin -4.6% and FCF margin -15.6% - strong growth with weak cash-flow quality. CRWV also uses non-comparable fallback context: revenue +112.5%, CFO margin +91.1% and FCF margin -179.9%, plus an institutional-ownership snapshot of 76.7% that is not a replacement 13F flow rank. Most comparable delayed-holdings snapshots here became available in May or early June 2026, so they are multi-month context rather than a current-flow measure.
Enterprise cloud and automation: AKAM shows trend confirmation; TEAM and PATH show why support is a separate concept
AKAM is the closest name to current support at 0.19 ATR and is already +9.7% above MA20. Akamai’s Q2 Cloud Infrastructure Services revenue grew 39% year over year, Security grew 10%, and the company disclosed multi-year cloud contracts worth more than $2.8 billion year to date, including a four-year deal above $600 million. That public mechanism lines up with the current Enterprise Software rank, but the slow layers still disagree sharply: Financial rank 0.01 versus delayed holdings 0.94.
TEAM and PATH are the useful controls. TEAM required next-day confirmation after a lower-wick test and sits only 0.27 ATR from live support, but it is 1.7% below MA5 despite remaining 1.5% above MA20. Its Financial rank is strong at 0.80 while delayed holdings are only 0.04. PATH is even more important: it is still within 0.62 ATR of support, yet remains 14.5% below MA20. UiPath’s agentic-automation strategy and September 22 Investor Day can explain the business narrative, but fresh structural support does not equal completed trend repair.
CRWV sits between those extremes. It is 0.46 ATR from support and only 0.8% above MA20, while CoreWeave reported record Q2 revenue/backlog and accelerating enterprise adoption. The official-filing fallback is mixed rather than uniformly bullish: revenue +112.5% and CFO margin +91.1%, but FCF margin -179.9%. That is exactly the kind of counterevidence that should remain visible rather than being compressed into a simple “positive” label.
AI interconnect and edge hardware: strong price confirmation, but the sector remains two-sided
QCOM, AXTI, LITE and ASTS all passed current support confirmation, and each is above MA20. AXTI is the most extended in secondary price terms at +20.4% versus MA20, even though the moving structural-support map leaves it only 0.30 ATR from current support. AXT’s Q2 revenue rose to $47.6 million from $18.0 million a year earlier and management cited record indium-phosphide revenue and strong AI/data-center optical demand. Lumentum reported $1.01 billion in Q4 revenue and described cloud modules, OCS and 1.6T adoption as emerging growth drivers. Those public facts support the optical-connectivity mechanism, but they do not erase the sector’s Bear-risk #1 status.
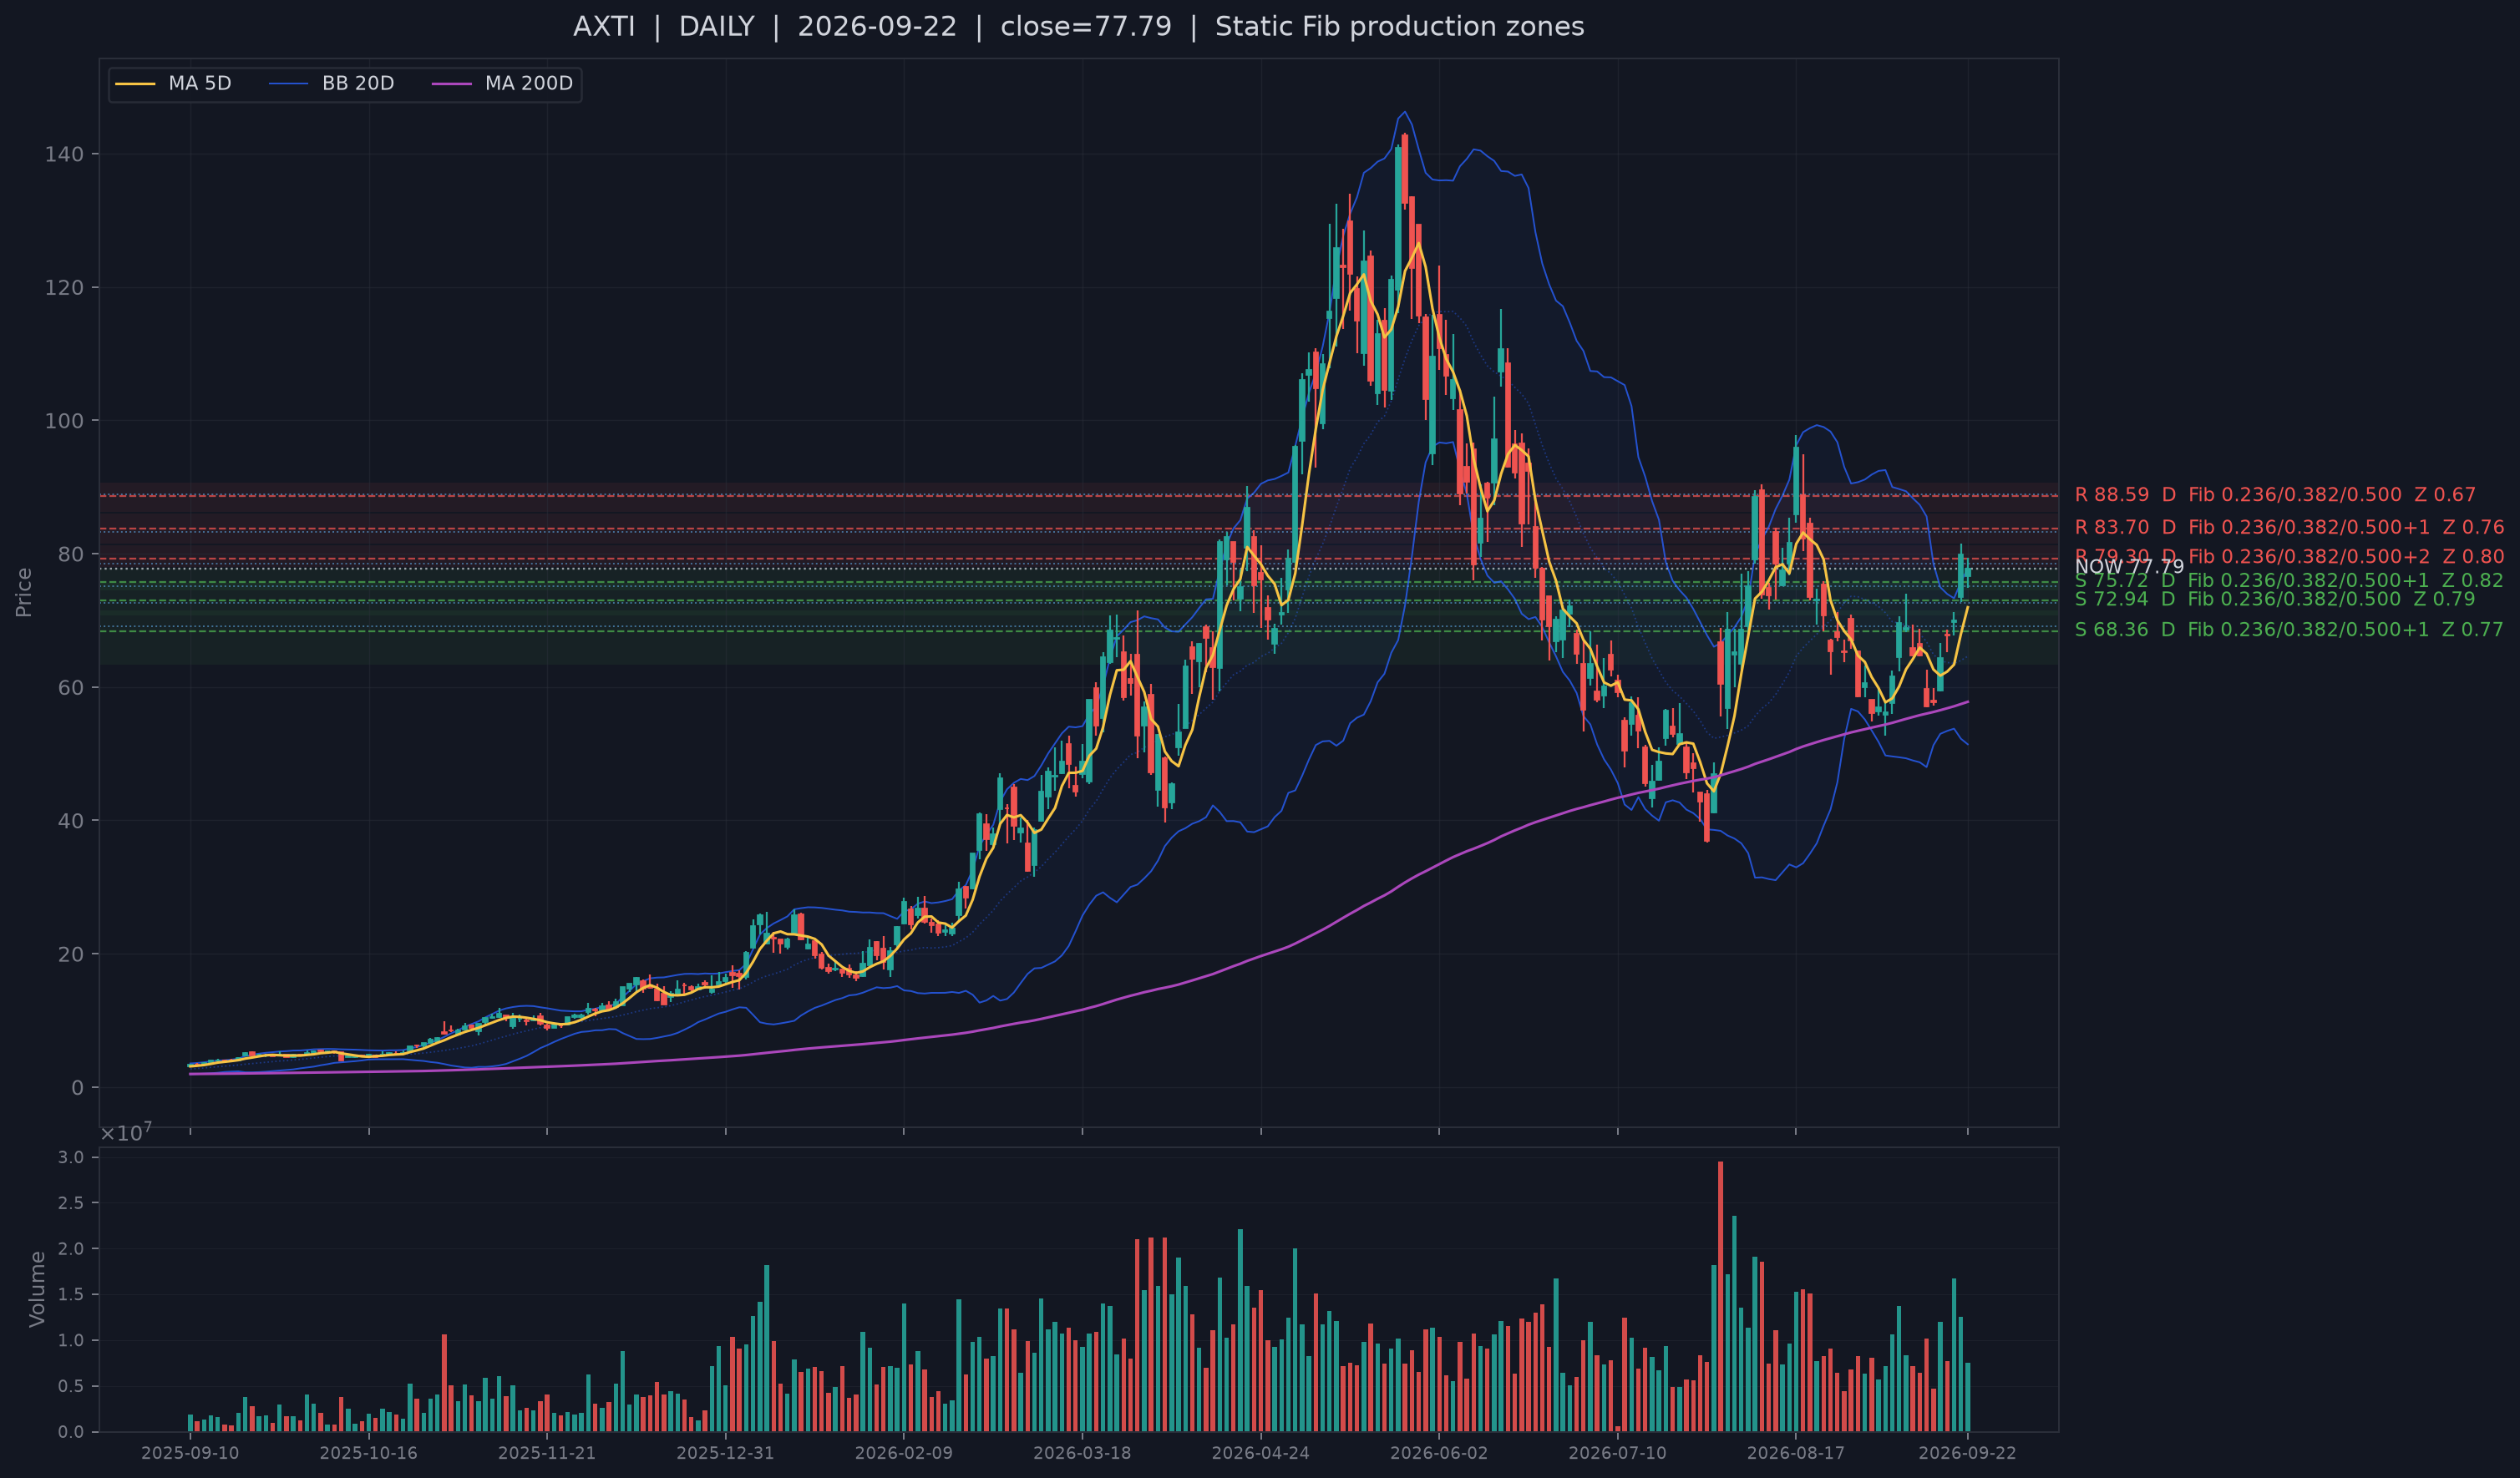
The slow context is also uneven. QCOM is weak on both comparable slow ranks at 0.23 / 0.09. LITE and ASTS have weak Financial ranks but much stronger delayed holdings. AXTI combines very strong recent revenue growth and a high delayed-holdings rank with negative CFO/FCF margins. Strong price transmission and strong demand narrative are real; so is the two-sided sector risk.
Space infrastructure: RKLB carries the selected support signal, while ASTS adds adjacent communications exposure
RKLB is 0.33 ATR from current support and +10.7% above MA20. Rocket Lab’s Q2 revenue reached $234 million, up 62% year over year, with record backlog of $2.36 billion and additional launch contracts signed after quarter-end. That gives the Aerospace #5 rank a concrete business mechanism. ASTS sits in the semiconductor/hardware taxonomy rather than Aerospace, but economically adds satellite communications exposure and is 0.59 ATR from current support with price 4.7% above MA20. The counterevidence is concentration: Aerospace has only two Bull Top30 representatives, so the sector rank is not broad.
6. What would confirm or falsify the 3-10 trading-day thesis
Base case - medium confidence: price, breadth and current downside damage are constructive, and leadership has rotated toward growth, consumer and space-related groups. But execution quality is split: supportive Depth has not been matched by Aggressor Flow, Alignment weakened late, macro funding/liquidity remain restrictive and the two technology-heavy Bull sectors are also materially represented in Bear-risk. The evidence supports selective continuation with a high confirmation burden, not a completed broad risk-on regime.
Constructive confirmation: Aggressor Flow should reclaim 50 early and hold it, while Alignment should remain above neutral into the close rather than repeating the midday/late failures. Breadth should stay above balance, downside damage should remain contained, and the weaker price controls - TEAM below MA5, CRWV only marginally above MA20 and PATH far below MA20 - should improve without breaking current structural support. Enterprise and Semiconductor Bear-risk should also ease if the rotation is becoming cleaner.
Strongest counterevidence: funding-price stress remains +2.47 z, liquidity is weak, credit risk appetite is negative, CFTC weekly positioning does not strongly validate the newest relative-price move, Enterprise Software is two-sided and Semiconductors are Bear-risk #1. Several selected names also show sharp Financial-versus-delayed-holdings disagreement.
Bearish falsifier: if Aggressor remains below neutral while Alignment repeatedly fails late, breadth falls back below 0.50, new-low/large-decline breadth and dispersion begin rising together, and multiple selected names break their current live support, the apparent healthy surface would look more like a late-cycle divergence than a durable growth rotation.
What this evidence does not establish: it does not identify institutional accumulation/distribution, buyer or seller exhaustion, or observed dollar flows across sectors. Cross-asset R and sector ranks are price-implied relative states; delayed holdings and weekly CFTC positioning are slower context.
Sources
- Reuters - Nasdaq sets record high, oil dips on improved crude flows (2026-09-22).
- Akamai - Akamai Reports Second Quarter 2026 Financial Results (2026-08-06).
- Atlassian - Investor Relations - Q4 FY26 results and AI-powered collaboration (2026-08-06).
- CoreWeave - CoreWeave Reports Strong Second Quarter 2026 Results (2026-08-11).
- UiPath - UiPath Announces Upcoming Investor Day (2026-08-25).
- AXT - AXT Announces Second Quarter 2026 Financial Results (2026-07-30).
- Lumentum - Lumentum Announces Fourth Quarter and Full Fiscal Year 2026 Results (2026-08-11).
- Rocket Lab - Rocket Lab Announces Second Quarter 2026 Financial Results (2026-08-10).
- AppLovin - AppLovin Announces First Quarter 2026 Financial Results (2026-05-06).
- Qualcomm - Investor Relations - Snapdragon Summit 2026 and Q3 FY26 materials (2026-09-22).
- CFTC - Commitments of Traders reports dated September 15, 2026 (2026-09-15).
Methodology
Market Layers is an independent quantitative research publication focused on U.S. equities. The process is data first and narrative second: quantitative observations define the questions, while public company filings, official data and high-quality reporting test mechanisms and counterevidence. Stock selection is fixed before public research; recent structural support is primary, price geometry is secondary, and Financial / delayed-holdings context is slower confirmation or contradiction. Order-flow analysis separates Aggressor Flow, Depth Pressure and Flow/Depth Alignment and compares the path with the absolute 50-neutral state and same-time history. This research is designed for 3-10 trading-day swing setups; the signals and conclusions may not transfer to intraday trading or longer-horizon investing. It is for informational and research purposes only and is not investment advice.