Breadth Repaired, but the Close Still Failed the Order-Flow Test
Price and breadth repaired sharply and leadership broadened into digital markets, energy, industrials and semiconductors, but Aggressor Flow never reclaimed neutral and all three order-flow axes closed below 50.
This research is designed for 3-10 trading-day swing setups. The signals and conclusions may not transfer to intraday trading or longer-horizon investing.
Key takeaway
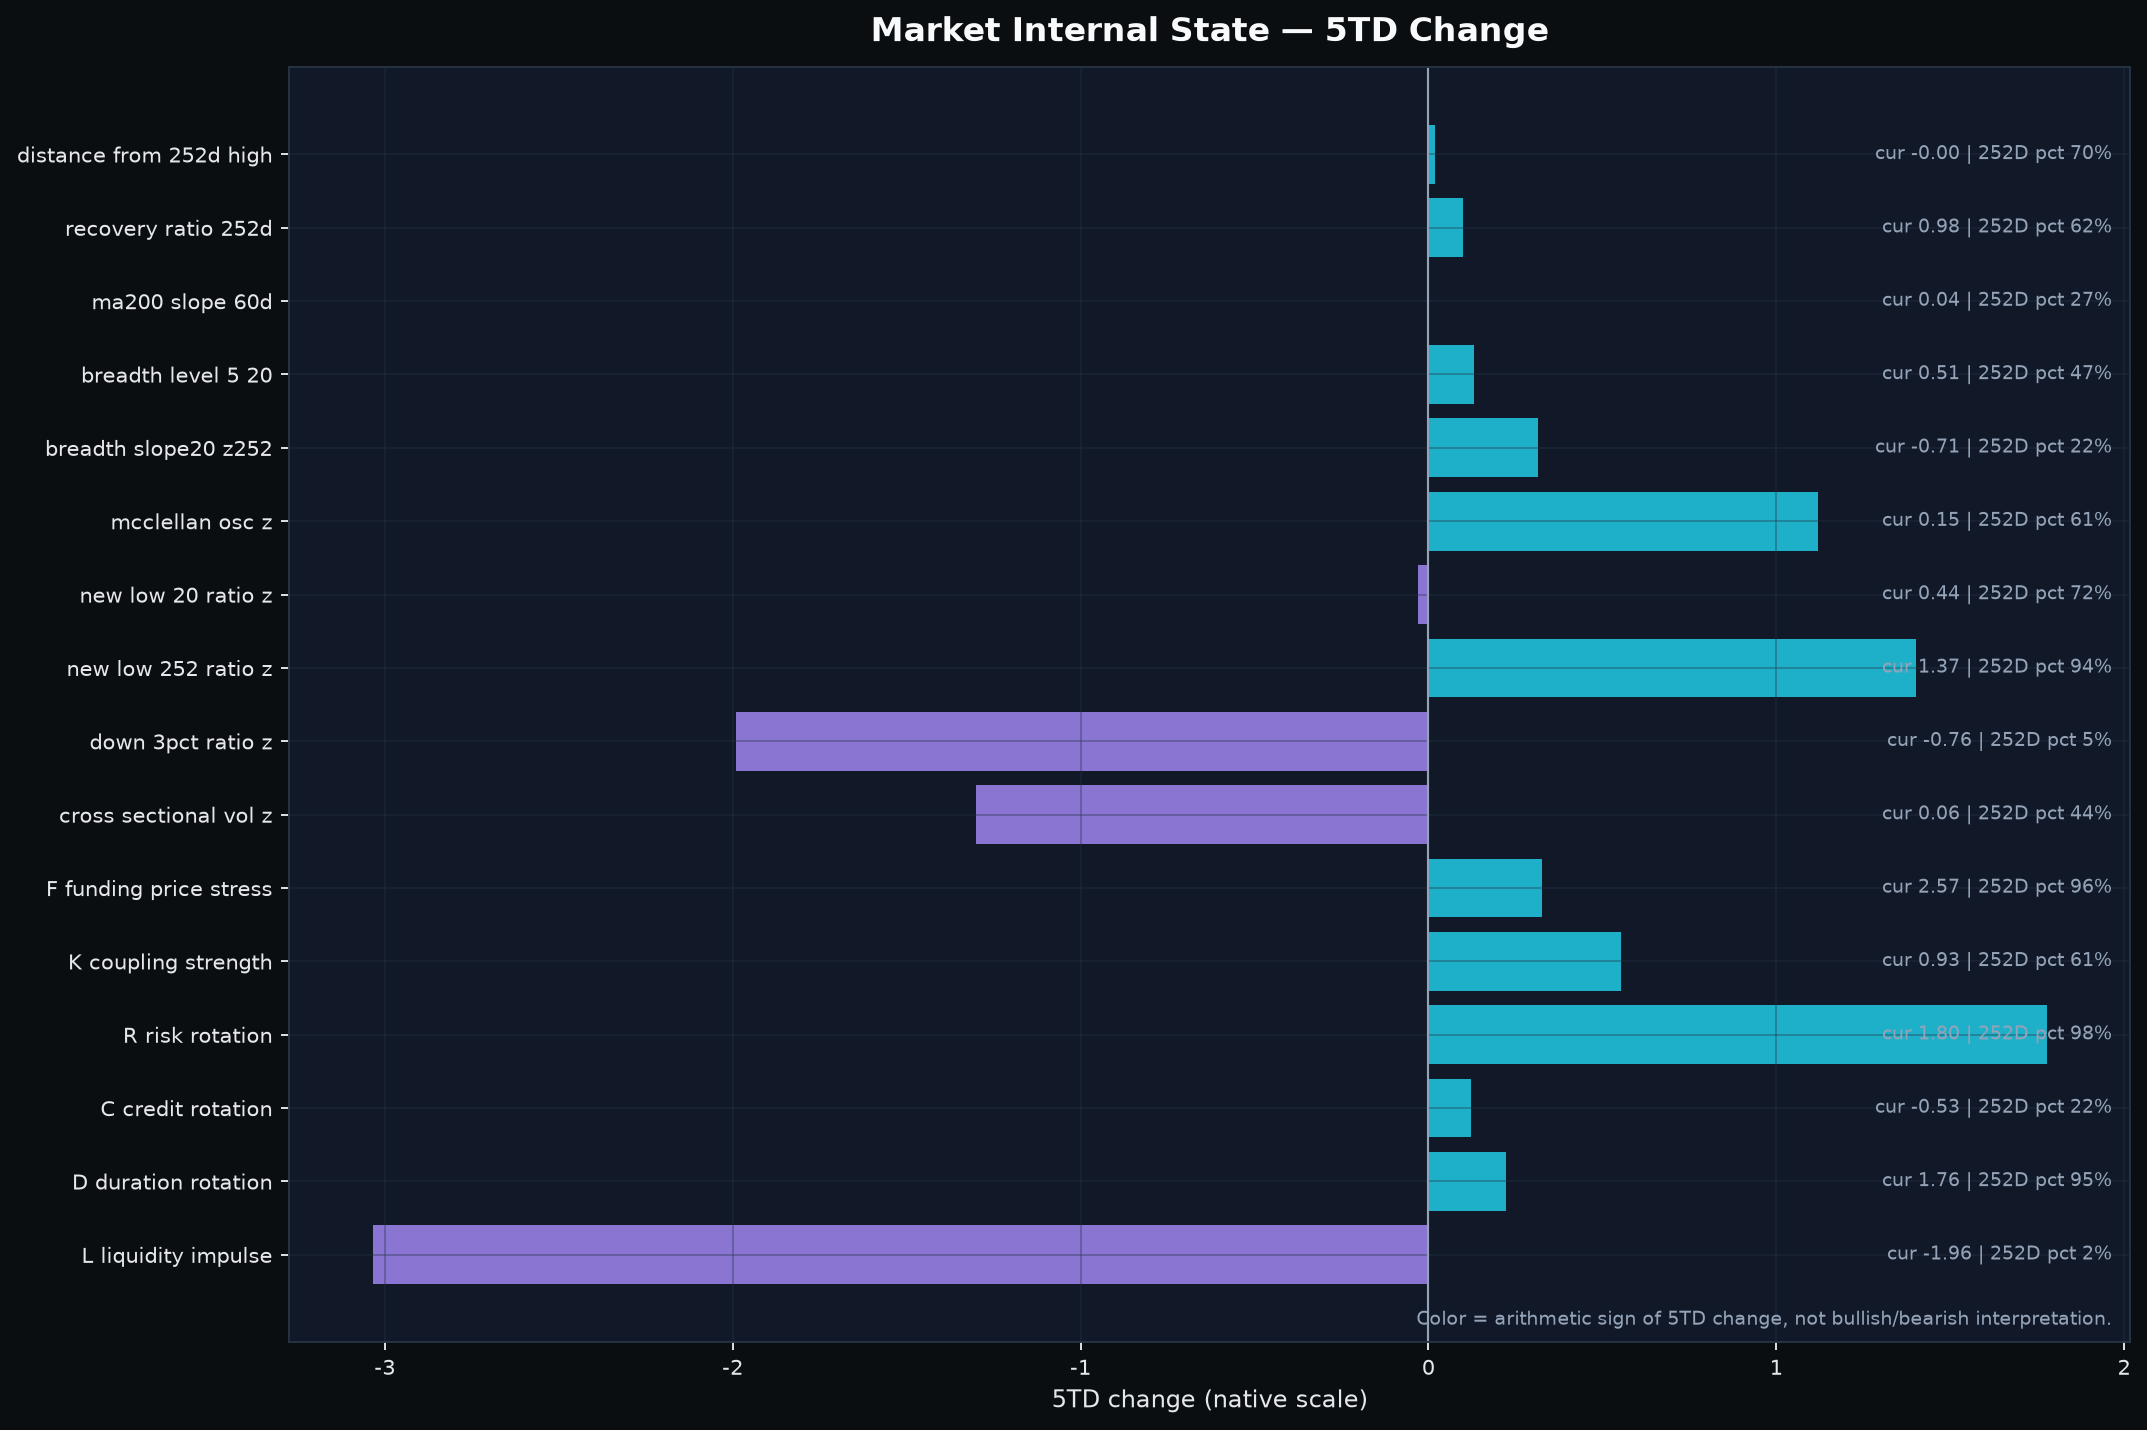
The market repaired more than price alone suggests, but the close still failed the order-flow test. The S&P 500 finished 1.66% above its 5-day average and 1.32% above its 20-day average; the Nasdaq Composite was 2.72% above MA5 and 3.07% above MA20. Breadth recovered to 0.510 after the prior session’s 0.385 reading, and its five-day change was strongly positive. Short-horizon damage also eased: the 20-day new-low ratio was only +0.44 z, the share of stocks down 3% or more was -0.76 z, and cross-sectional volatility was near its historical mean. The remaining tail is the 252-day new-low ratio at +1.37 z, alongside historically elevated structural-warning states. In other words, price and participation repaired, while the longer-horizon fragility did not disappear.
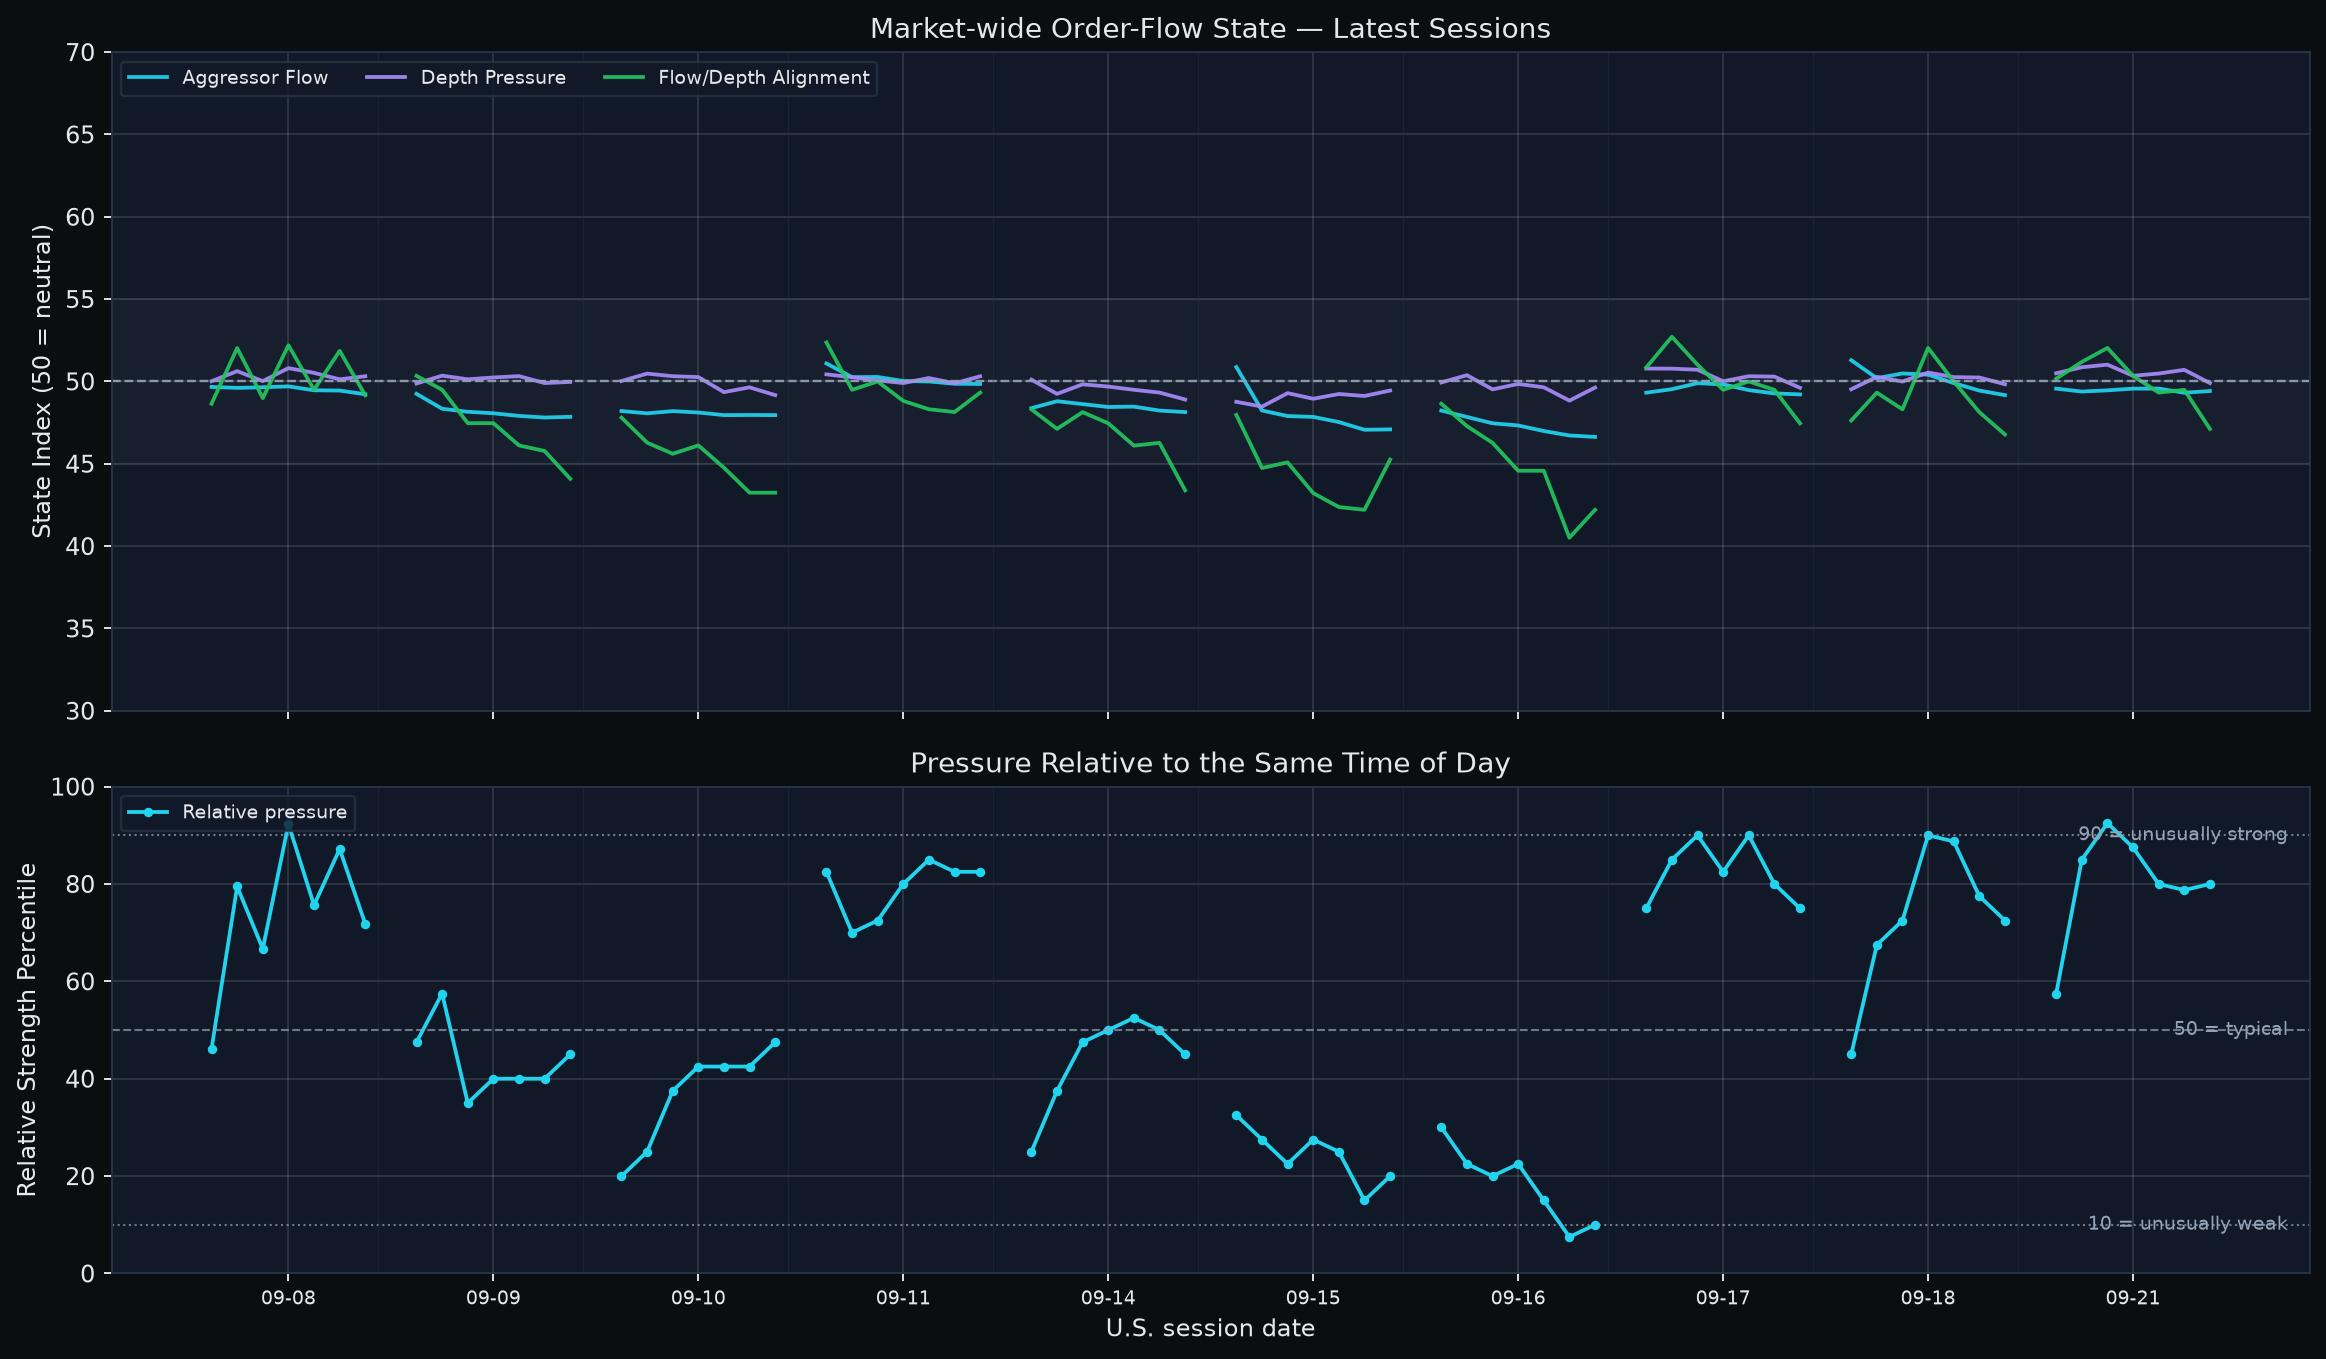
The intraday path explains why I would not call this a completed broad repair. Aggressor Flow never traded above its 50 neutral state in any of the seven regular-session checkpoints. Depth Pressure stayed above 50 for six bars and Flow/Depth Alignment reached 52.0 in late morning, so there was a real repair attempt in those layers. But the last hour reversed it: Depth fell from 50.71 to 49.90 and Alignment from 49.49 to 47.12, while Bull-aligned breadth dropped and Bear-aligned breadth rose. All three state axes closed below neutral. The same-time percentile still closed at 80 and the equal-weight basket gained about 0.30% from open to close, so this is not a synchronized selloff. It is a repaired price/breadth surface with a high next-session confirmation burden.
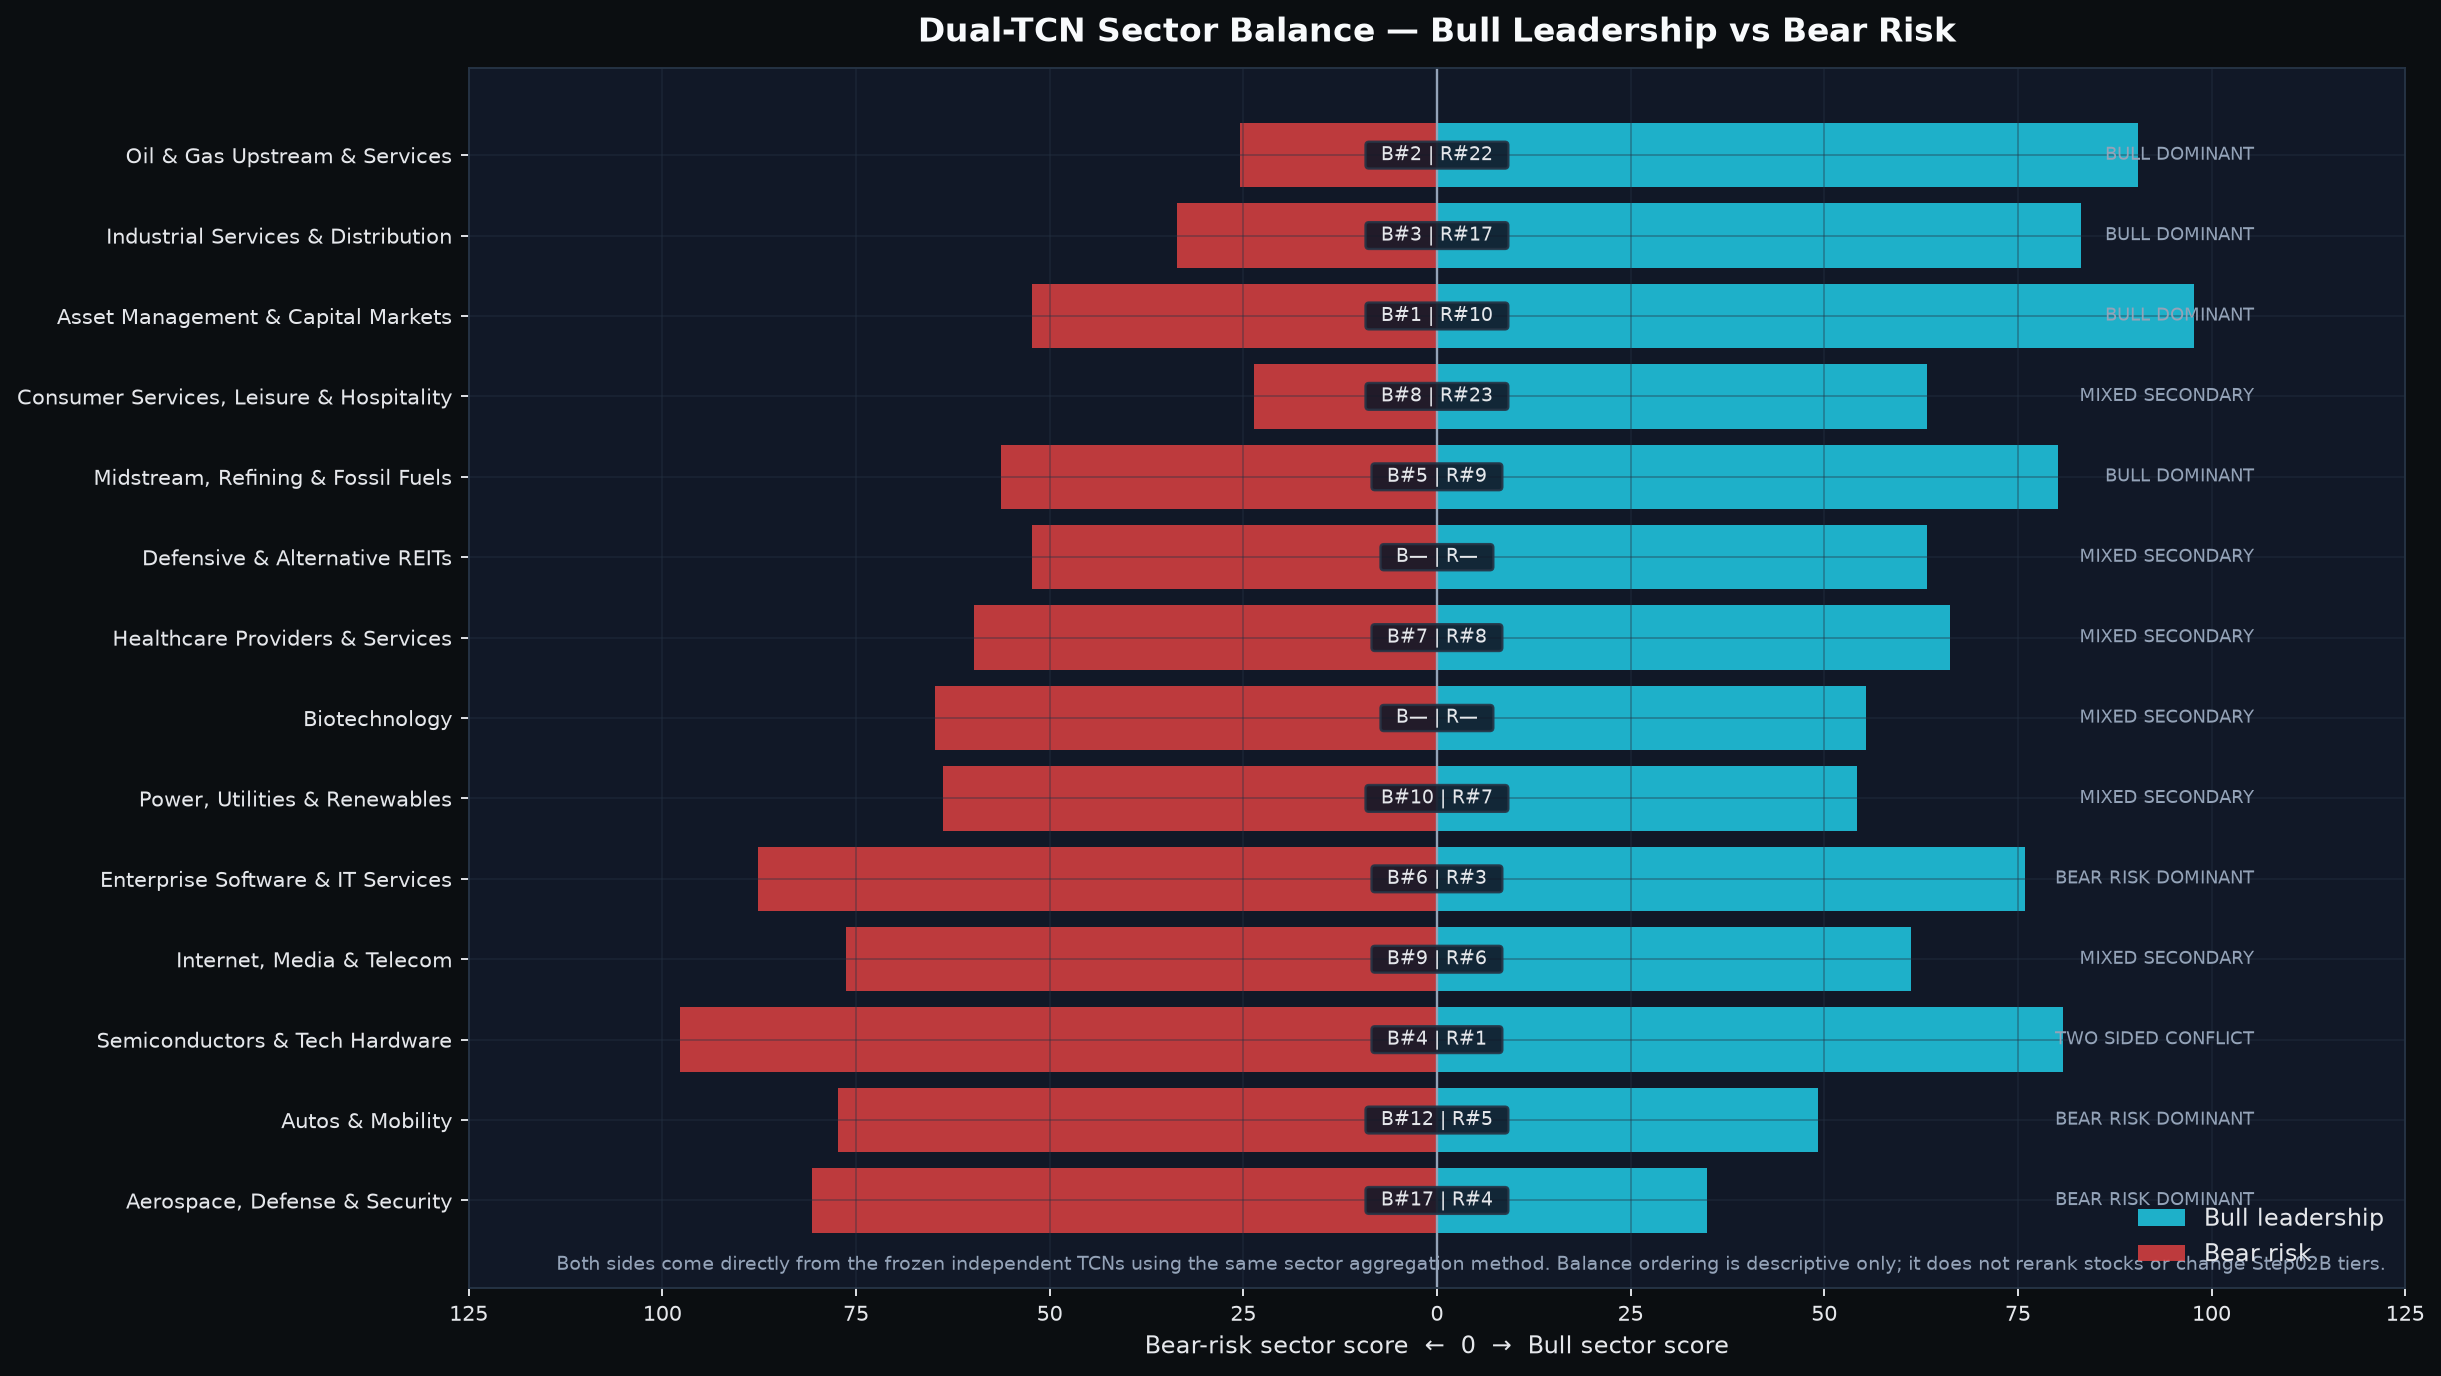
Leadership also broadened materially from the prior session. Asset Management & Capital Markets is Bull #1, Oil & Gas Upstream & Services #2, Industrial Services & Distribution #3, Semiconductors & Tech Hardware #4 and Midstream/Refining #5. The combination is not one clean factor: digital-market infrastructure and power-rich compute are strong inside the top sector, energy ranks are high but current representative price confirmation is mixed, industrials are narrow, and semiconductors are simultaneously Bear-risk #1. My base case is therefore constructive but conditional: broader leadership is real, yet the late order-flow failure and heterogeneous sector confirmation keep the recovery selective rather than fully synchronized.
How to read today’s indicators
| Indicator | Scale / reference | Reader interpretation |
|---|---|---|
| Market-wide order-flow state | Three state indices; 50 = neutral | Aggressor Flow, Depth Pressure and Flow/Depth Alignment answer different questions. Read confirmation and divergence across all three; they are not probabilities. |
| Same-time order-flow percentile | 0-100; 50 = same-time historical median | 90 is unusually strong and 10 unusually weak for that intraday slot. It is not an event probability. |
| Flow x depth state breadth | Cross-sectional percentages | Bull/Bear aligned show joint direction; absorption-compatible breadth shows flow/depth disagreement compatible with absorption, not actor identity or intent. |
| Market breadth | 0-1; about 0.50 = balance | Level measures participation; direction and slope show whether participation is broadening or narrowing. |
| z-score | 0 = historical mean | |1| is notable and |2| unusual. It is standardized distance, not probability. |
| Historical percentile | 0-100; 50 = median | 90+ is historically elevated, but not an event probability. |
| Financial / delayed-holdings context rank | 0-1; 0.50 = cross-sectional middle | Higher values mean stronger slow context among current candidates. Delayed holdings are not today’s institutional flow. |
| Slow-context versus price divergence | Centered near 0 | Positive means slow context is stronger than price rank; negative means price is ahead. It is not a standalone signal. |
| Expected next-session trading range | High-low amplitude, non-directional | When supplied, read the raw range estimate with its same-day cross-sectional percentile. It is not an upside target. |
1. Price and breadth repaired; damage has not fully reset
| Layer | Current evidence | Interpretation | What would change the read |
|---|---|---|---|
| Index price | S&P: MA5 +1.66%, MA20 +1.32%; Nasdaq: MA5 +2.72%, MA20 +3.07% | Both benchmark trends are above short and medium averages; Nasdaq remains stronger. | A joint loss of MA5 with weakening breadth would challenge the repaired surface. |
| Breadth | 0.510; 5-day change +0.130; 20-day slope -0.71 z | Participation returned to the balance area, but the longer slope still carries some cooling memory. | Sustained breadth above balance would strengthen the broad-repair case. |
| Short-horizon damage | 20-day new-low z +0.44; stocks down 3%+ z -0.76; cross-sectional volatility z +0.06 | Fresh liquidation pressure is not broad. | A joint rise in new lows, large-decline breadth and dispersion would mark propagation. |
| Long-horizon tail | 252-day new-low z +1.37; about 94th historical percentile | Some longer-horizon damage remains elevated despite the short-horizon repair. | A decline in long-horizon new lows would reduce residual structural fragility. |
| Frozen warning context | Systemic-warning percentile 94.0%; structural-watch 92.8% | Historically elevated configurations, not calibrated crash probabilities. | Current price/breadth/damage propagation is required before treating them as an active breakdown. |
The change from the prior session matters. Breadth did not merely tick up; it moved back to the practical balance area while both major indices pushed above MA20. At the same time, the 20-day new-low layer cooled and large one-day declines remained subdued. That combination weakens the argument that the market is already in broad liquidation. The strongest counterevidence is slower-moving: the 252-day new-low tail is still elevated and the structural-warning states remain historically high. The market repaired its fast layer faster than its slow damage memory. That makes current strength more credible than a narrow index-only bounce, but still vulnerable if fresh damage resumes.
2. Depth repaired in the morning, but Aggressor never reclaimed neutral
| ET | Aggressor Flow | Depth Pressure | Flow/Depth Alignment | Same-time %ile | Bull aligned | Bear aligned | Buy absorption | Sell absorption | EW bar |
|---|---|---|---|---|---|---|---|---|---|
| 09:30 | 49.6 | 50.5 | 50.2 | 57.5 | 16.6% | 16.3% | 20.7% | 14.2% | +0.160% |
| 10:30 | 49.4 | 50.9 | 51.2 | 85.0 | 20.0% | 17.6% | 17.6% | 13.6% | +0.063% |
| 11:30 | 49.5 | 51.0 | 52.0 | 92.5 | 19.3% | 15.3% | 21.4% | 13.9% | +0.180% |
| 12:30 | 49.6 | 50.3 | 50.3 | 87.5 | 18.6% | 18.0% | 17.6% | 14.2% | +0.041% |
| 13:30 | 49.6 | 50.5 | 49.3 | 80.0 | 18.6% | 20.0% | 17.6% | 10.8% | +0.174% |
| 14:30 | 49.3 | 50.7 | 49.5 | 78.8 | 18.0% | 19.0% | 16.9% | 11.5% | -0.071% |
| 15:30 | 49.4 | 49.9 | 47.1 | 80.0 | 14.9% | 20.7% | 14.2% | 14.2% | -0.076% |
The session’s constructive evidence sits in Depth and Alignment, not in Aggressor Flow. Depth rose from 50.49 at the open to 51.02 at 11:30 and stayed above 50 through 14:30. Alignment improved from 50.17 to 52.03 at 11:30, while the same-time percentile climbed to 92.5. Bull-aligned and buy-absorption-compatible breadth also improved around the strongest intraday window. Those are real signs of better market structure than a close-only reading would show.
But path direction and absolute state diverged. Aggressor Flow spent zero of seven checkpoints above 50; it never converted the supportive depth state into a neutral-or-better aggressor state. Alignment then slipped below 50 at 13:30 and closed 47.12. From 13:30 to the close, Bull-aligned breadth fell 3.73 percentage points, Bear-aligned breadth rose 0.68, buy-absorption-compatible breadth fell 3.39 and sell-absorption-compatible breadth rose 3.39. In the final hour, Depth dropped 0.80 points and Alignment 2.37.
This is a partial intraday repair that failed at the close, not a successful state repair. The next session does not need merely another strong same-time percentile; it needs Aggressor Flow to reclaim 50, Depth to hold above 50 and Alignment to recover its 2.88-point closing gap to neutral, with Bull-aligned breadth and equal-weight price confirming. The main counterevidence to a bearish reading is equally important: the close still ranked at the 80th same-time percentile and the equal-weight basket gained about 0.30% from open to close. That is why the evidence supports a high confirmation burden, not a claim of buyer exhaustion or distribution.
3. Cross-asset conditions are tight, but the 20-day relative-preference move favored equities
| Layer | Current state | 20-day / anatomy read | Interpretation |
|---|---|---|---|
| Funding-price stress | +2.57 z | Still historically elevated | Persistent financing/discount-rate headwind. |
| Liquidity impulse | -1.96 z | Weak | Second macro headwind despite equity strength. |
| Equity relative preference | +1.80 z | 20-day change +0.744 | Recent relative preference moved toward equities, not away from them. |
| Credit appetite | -0.53 z | Soft | Credit does not fully confirm the equity risk-on surface. |
| Duration preference | +1.76 z | Long-Treasury 20-day attribution -0.034 | Current duration state is positive, but it did not drive the recent relative-preference change. |
| Cross-asset coupling | +0.93 z | 20-day change +0.063 | Moderate coupling rise; node attribution matters. |
The first reconciliation is important. Duration preference and 20-day R destination anatomy are not contradictory measures. Duration describes the current relative state; R anatomy asks which sleeves explain the change in relative preference over the last 20 trading days. Over that window, equity relative preference strengthened by roughly +0.744. Every non-equity sleeve made a negative contribution to that change, including long Treasuries (-0.034), investment-grade credit (-0.034), industrial metals (-0.045) and high yield (-0.058). Some of those sleeves still had positive own-price pressure. The conclusion is not that money literally flowed from bonds or metals into stocks; it is that equities improved faster in the relative-price structure.
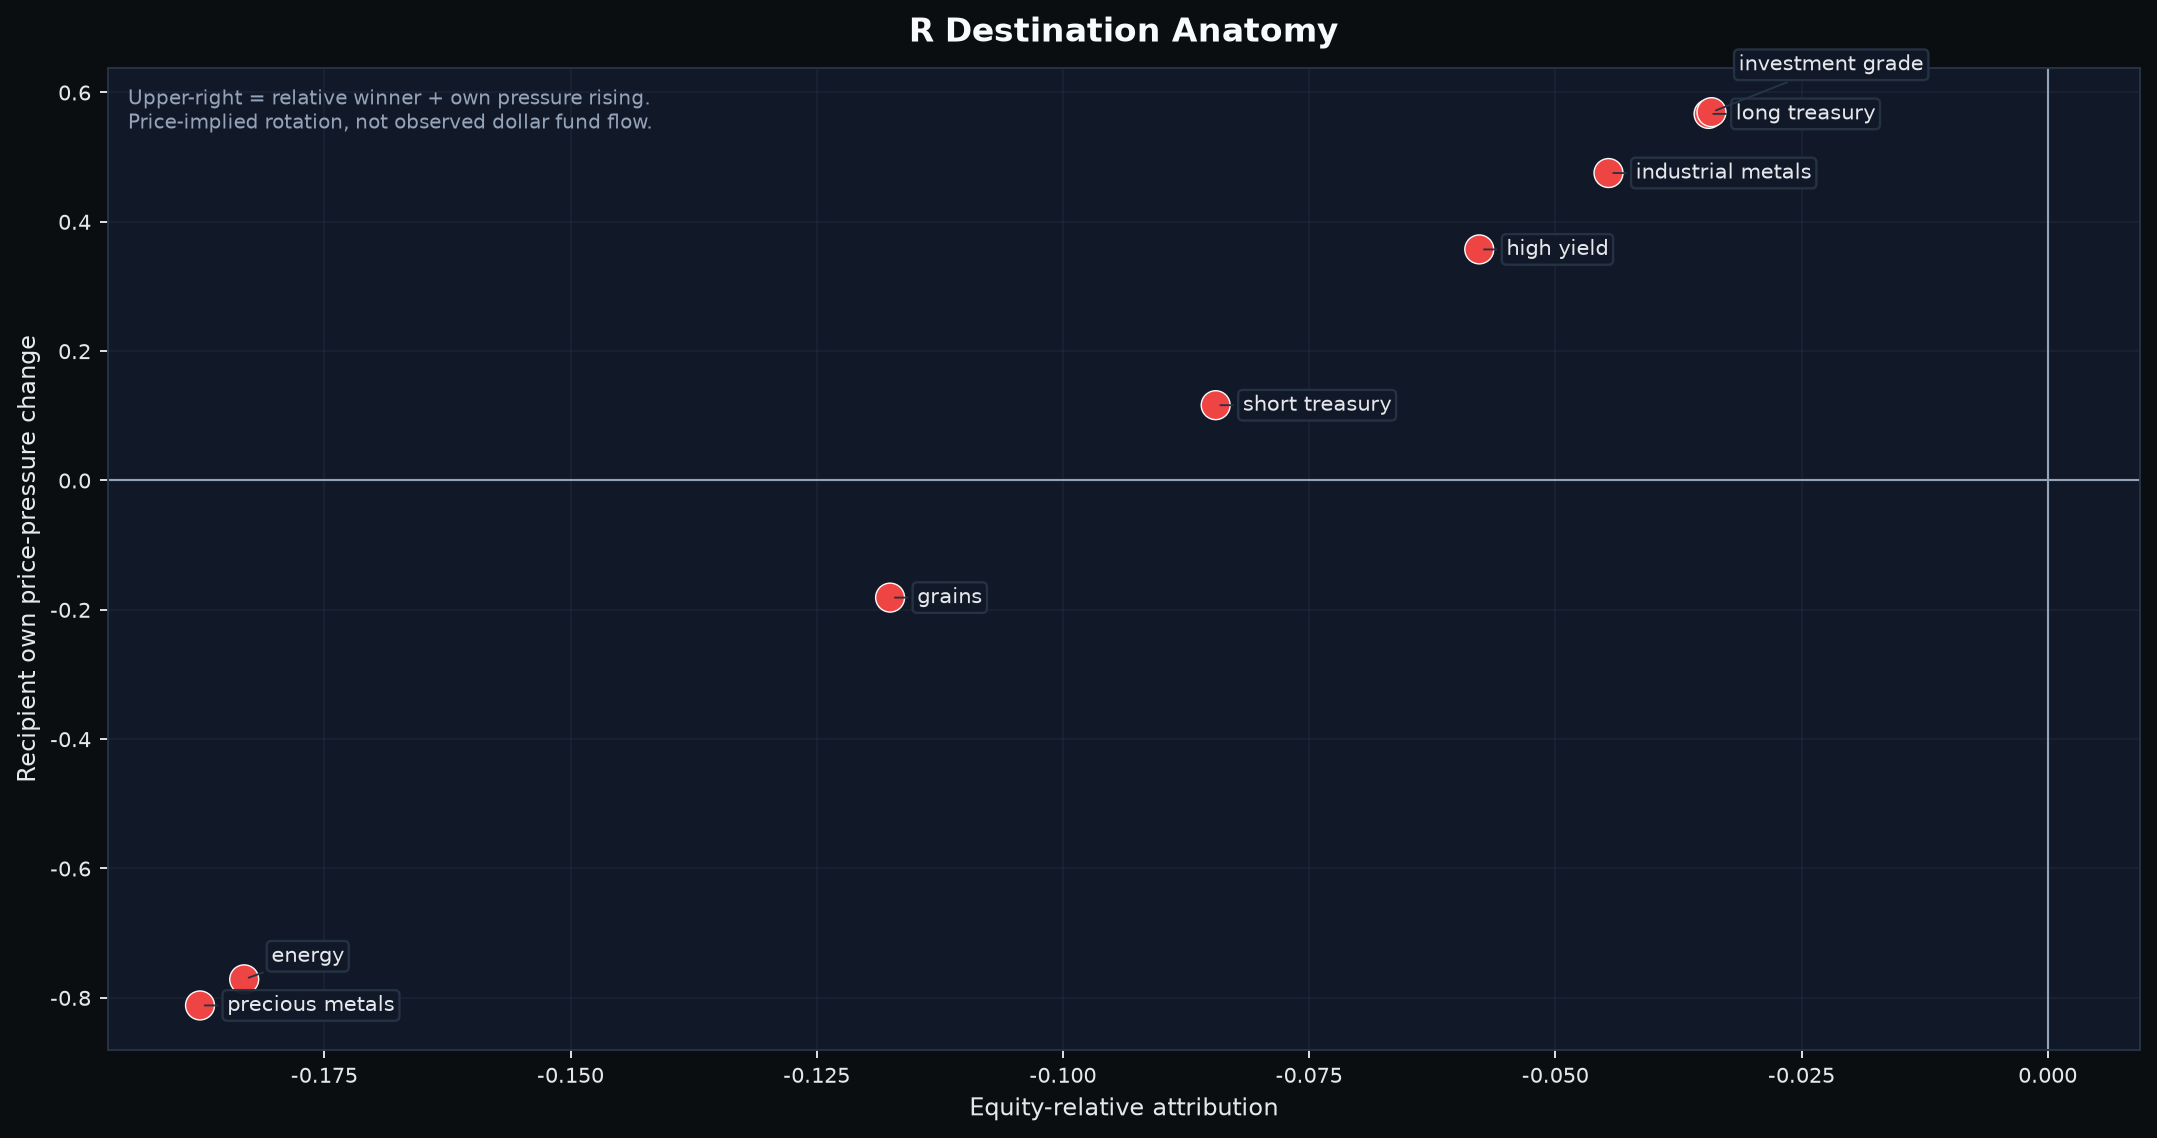
The K decomposition also argues against reading higher coupling as synchronized equity-led risk-off. The 20-day increase in coupling was driven mainly by industrial metals (+0.0235), energy (+0.0167), precious metals (+0.0163) and long Treasuries (+0.0073), while the equity node contributed negatively (-0.0033). That is a real-asset/common-mode contribution, not an equity-driven stress lockstep. The combination - tight funding, weak liquidity, strong equity relative preference and non-equity-led coupling - is mixed rather than cleanly risk-on or risk-off.
CFTC positioning is useful as a slow cross-check, not a same-day verdict. The latest report is dated September 15, four trading days before this market close, and is current under the normal weekly release schedule. Industrial-metals own-price pressure is positive in the current cross-asset state, yet the weekly positioning change for that sleeve is weak; equity positioning is also negative in the snapshot. The covered weekly positions therefore do not broadly validate the newest price-implied rotation. Because the report predates this close by four trading days, that is soft counterevidence rather than a veto.
4. Leadership broadened, but the quality of confirmation differs by sector
| Bull rank | Sector | Bear-risk rank | Balance state | Representative tickers | Public read |
|---|---|---|---|---|---|
| 1 | Asset Management & Capital Markets | 13 | BULL_DOMINANT | CRCL, HUT, MARA, COIN, IREN, BMNR, HOOD | Broad selected-stock confirmation across digital markets and power-rich compute. |
| 2 | Oil & Gas Upstream & Services | 27 | BULL_DOMINANT | FANG, XOM, PBR, BP, COP, OXY, EOG | High rank, but current representative price confirmation is uneven. |
| 3 | Industrial Services & Distribution | 22 | BULL_DOMINANT | HON, CPRT, WM, SUNB, MMM | Narrower confirmation; HON is the only final selected name. |
| 4 | Semiconductors & Tech Hardware | 1 | TWO_SIDED_CONFLICT | SNDK, ON, LITE, SMCI, ONDS, AXTI, IONQ | Strong upside cohort, but the highest Bear-risk of any sector. |
| 5 | Midstream, Refining & Fossil Fuels | 10 | BULL_DOMINANT | MPC, VLO, PSX, KMI, LNG, WMB | Rank strength lacks a final selected stock and near-term price confirmation is soft. |
| Sector | Current leading subcluster(s) | Key names | Economic linkage | Quant / price-support confirmation | Why now / public mechanism | Strongest counterevidence |
|---|---|---|---|---|---|---|
| Asset Management & Capital Markets | Digital-market infrastructure; crypto-sensitive compute / AI data centers | CRCL, COIN, HOOD; WULF, HUT, IREN | Crypto/market activity plus power-rich compute infrastructure | Six final names; WULF 0.04 ATR, HUT 0.10, IREN 0.11, HOOD 0.22, CRCL 0.27, COIN 0.38 from live support | Bitcoin rose more than 6% on Sep. 21; Circle launched Arc with 100+ institutional/ecosystem builders; Robinhood’s August crypto volume rose 61% month over month; WULF has a 20-year Anthropic lease for about 401 MW | Sector taxonomy mixes businesses with different economics; slow-context ranks disagree sharply across names. |
| Oil & Gas Upstream & Services | Integrated/upstream production | PBR; FANG, XOM, BP, COP, OXY, EOG as controls | Commodity production and upstream cash-flow exposure | PBR passed recent support, but is -1.8% vs MA5; several large representatives closed below recent 5-day support | Petrobras reported record operated oil production in Brazil of 2.7m bpd in Q2, +15% YoY | Brent fell to an 11-day low on Sep. 21 and representative price confirmation is weaker than the sector rank. |
| Industrial Services & Distribution | Automation / industrial systems / distribution | HON; CPRT, WM, MMM controls | Capital spending, automation and industrial-service demand | HON has same-day support confirmation but remains -1.3% vs MA20; several controls are weaker | Honeywell reported 16% order growth excluding the separated aerospace business and about $20bn backlog | Leadership is narrow and HON has not completed medium-term trend repair. |
| Semiconductors & Tech Hardware | AI/power hardware; data-center storage | ON, SNDK; LITE, SMCI, AXTI controls | AI compute, power delivery, storage and connectivity | SNDK +10.4% vs MA20; ON -0.5% vs MA20; both have recent support confirmation | onsemi highlighted AI/power-density constraints at its Sep. 16 investor day; Sandisk reported FY26 data-center revenue +437% | Bear-risk rank #1 makes the sector explicitly two-sided; some conflict names rank highly on both sides. |
| Midstream, Refining & Fossil Fuels | Refining / transport / LNG infrastructure | MPC, VLO, PSX, KMI, LNG, WMB | Hydrocarbon processing, transport and export infrastructure | No final selected stock; MPC/VLO/PSX are below MA5 | No single public catalyst is needed to explain the rank; it sits beside the broader energy cohort | Oil prices fell on Sep. 21 and near-term representative price transmission is weak. |
The temporal change is meaningful because recent sector history supports it. Asset Management rose from #2 to #1, while Oil & Gas advanced from #4 to #2. The industrial slot changed identity from Industrial Machinery, Automation & Instruments at #3 to Industrial Services & Distribution at #3. Semiconductors and Midstream entered the Bull Top 5, while Enterprise Software and Consumer Services exited. That is broader economic coverage, not observed dollar flow. It also means the market is no longer being carried by one software/digital-infrastructure cluster.
The strongest current cluster is still economically heterogeneous. Within Asset Management, WULF/HUT/IREN are better understood as power-rich compute and data-center infrastructure, while CRCL/COIN/HOOD are digital-market or financial infrastructure. WULF’s 401 MW Anthropic lease and IREN’s multi-gigawatt power footprint give the first group a physical-infrastructure mechanism; Circle’s Arc launch and Robinhood’s elevated platform/crypto activity give the second group a digital-market mechanism. Their common backdrop is risk appetite plus infrastructure demand, not a direct commercial relationship.
Energy is a useful counterexample to rank-chasing. Oil & Gas is Bull #2 and PBR is a final selected name very close to live support, but multiple large representatives are weak versus MA5 and Brent fell on the session. Industrial Services is similarly narrow: HON’s support is fresh, yet its MA20 gap remains negative. Semiconductors are the opposite type of conflict: SNDK is strongly above MA20 and ON has fresh support, but the sector is Bear-risk #1. A high Bull rank does not erase the internal opposing evidence.
5. The selected support set is broadening faster than slow context agrees
| Stock | Sector | Selection tier/role | Bull rank (of 297) | Bear rank (of 297) | Recent structural support | Live-support distance | MA5 / MA20 | Slow context |
|---|---|---|---|---|---|---|---|---|
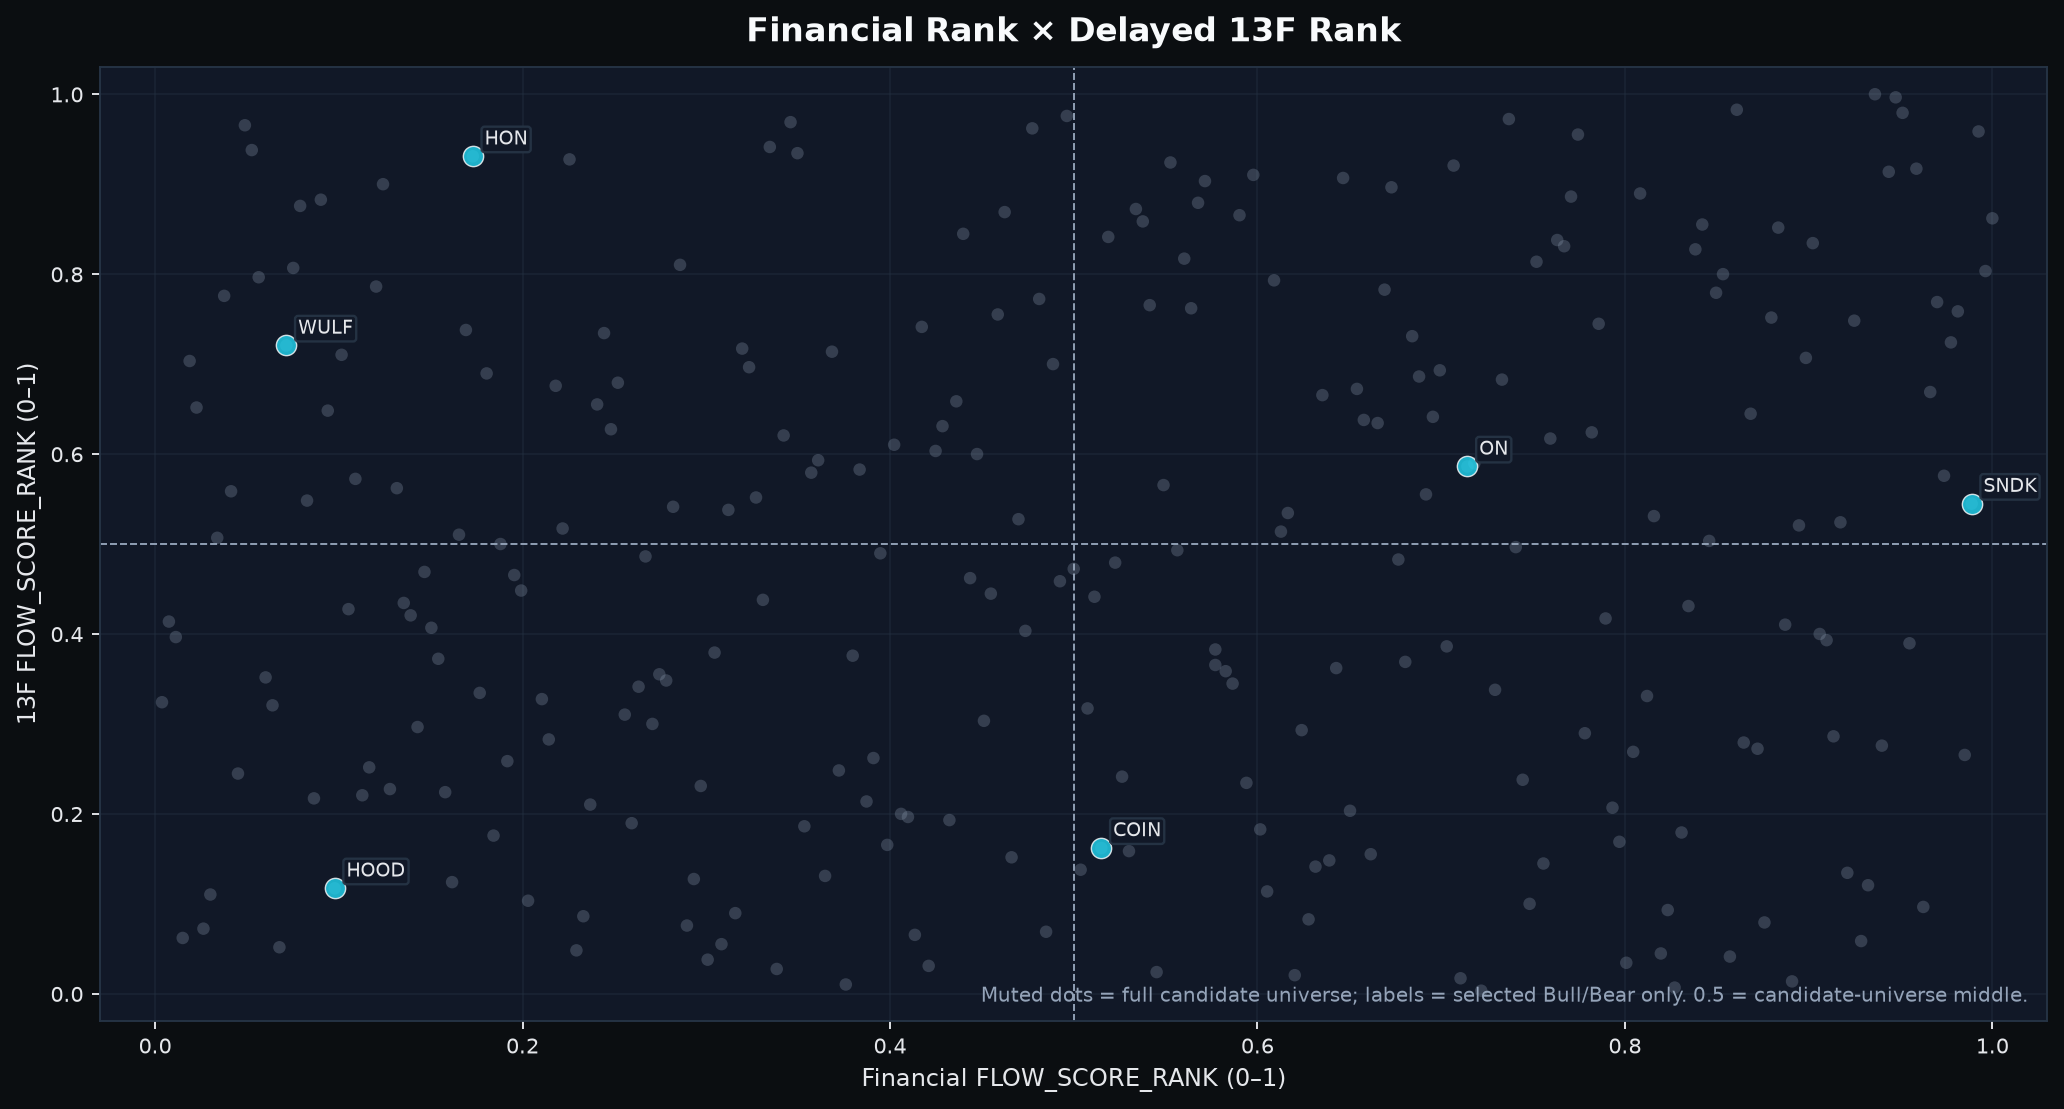
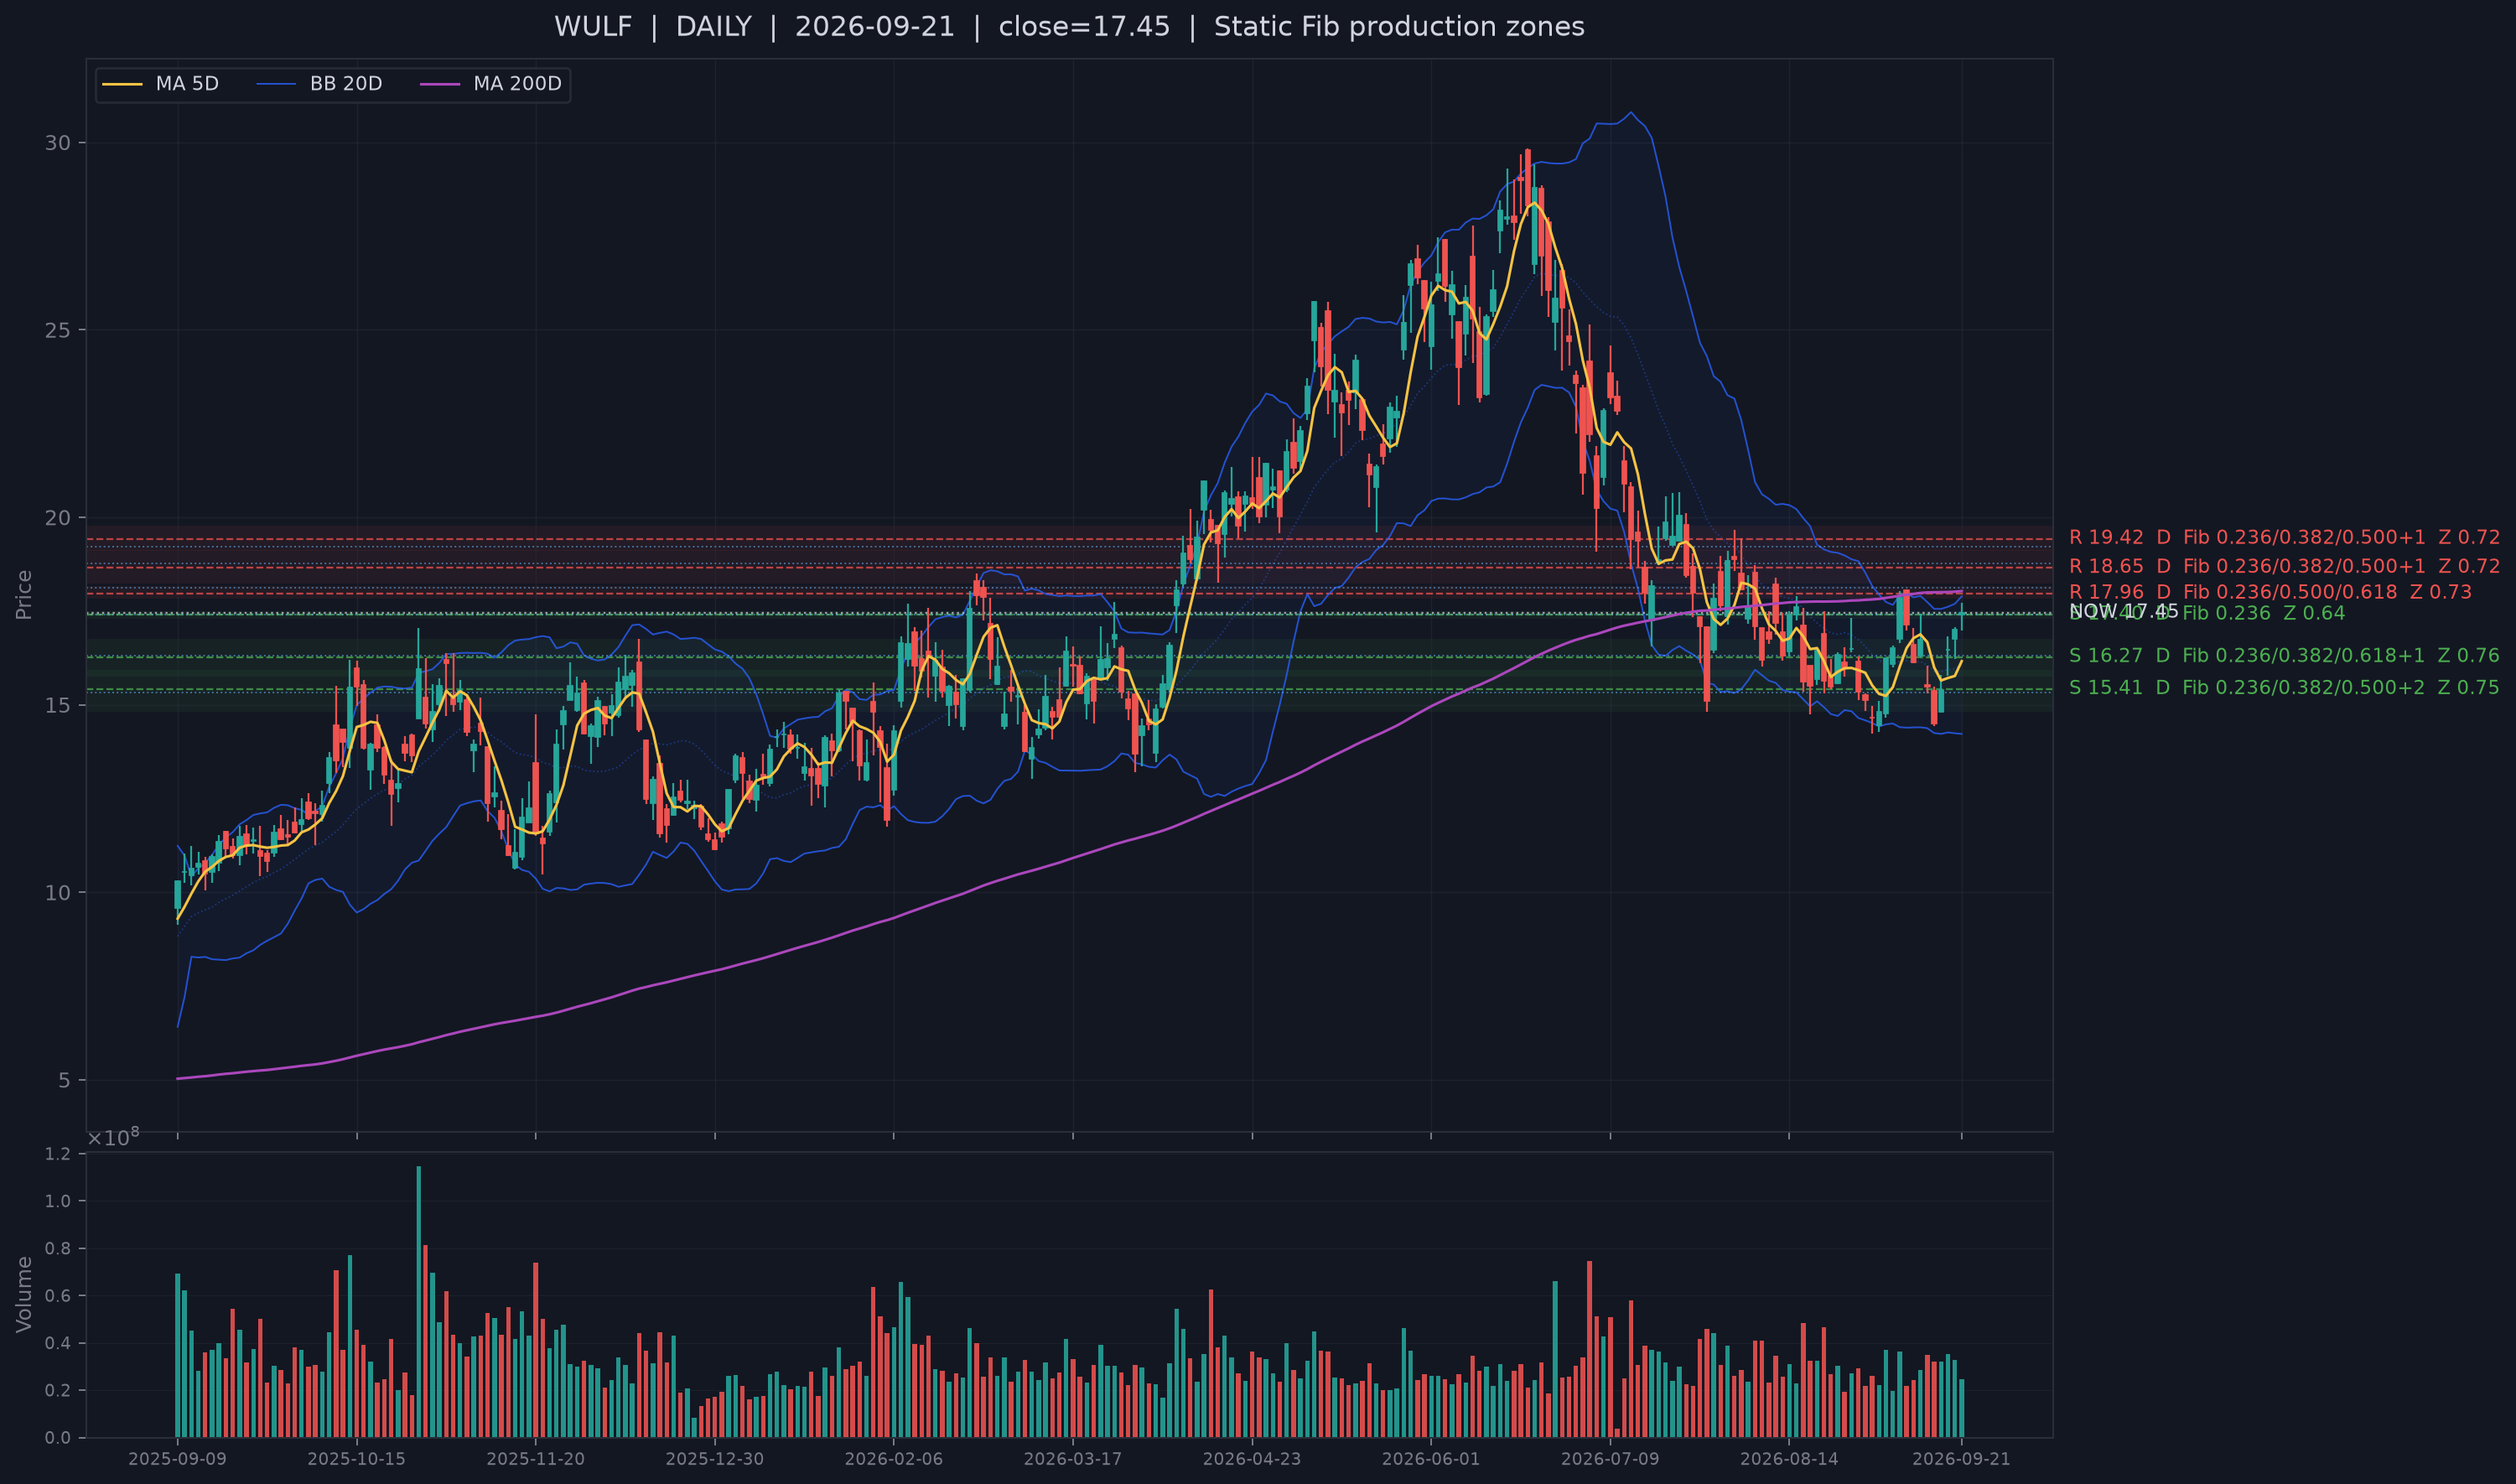
| WULF | Asset Management & Capital Markets | B Bull screen | #28 | #44 | Same-day bullish center reclaim; 1TD ago | 0.30% / 0.04 ATR | +8.0% / +8.7% | Fin 0.07 / delayed 13F 0.72 |
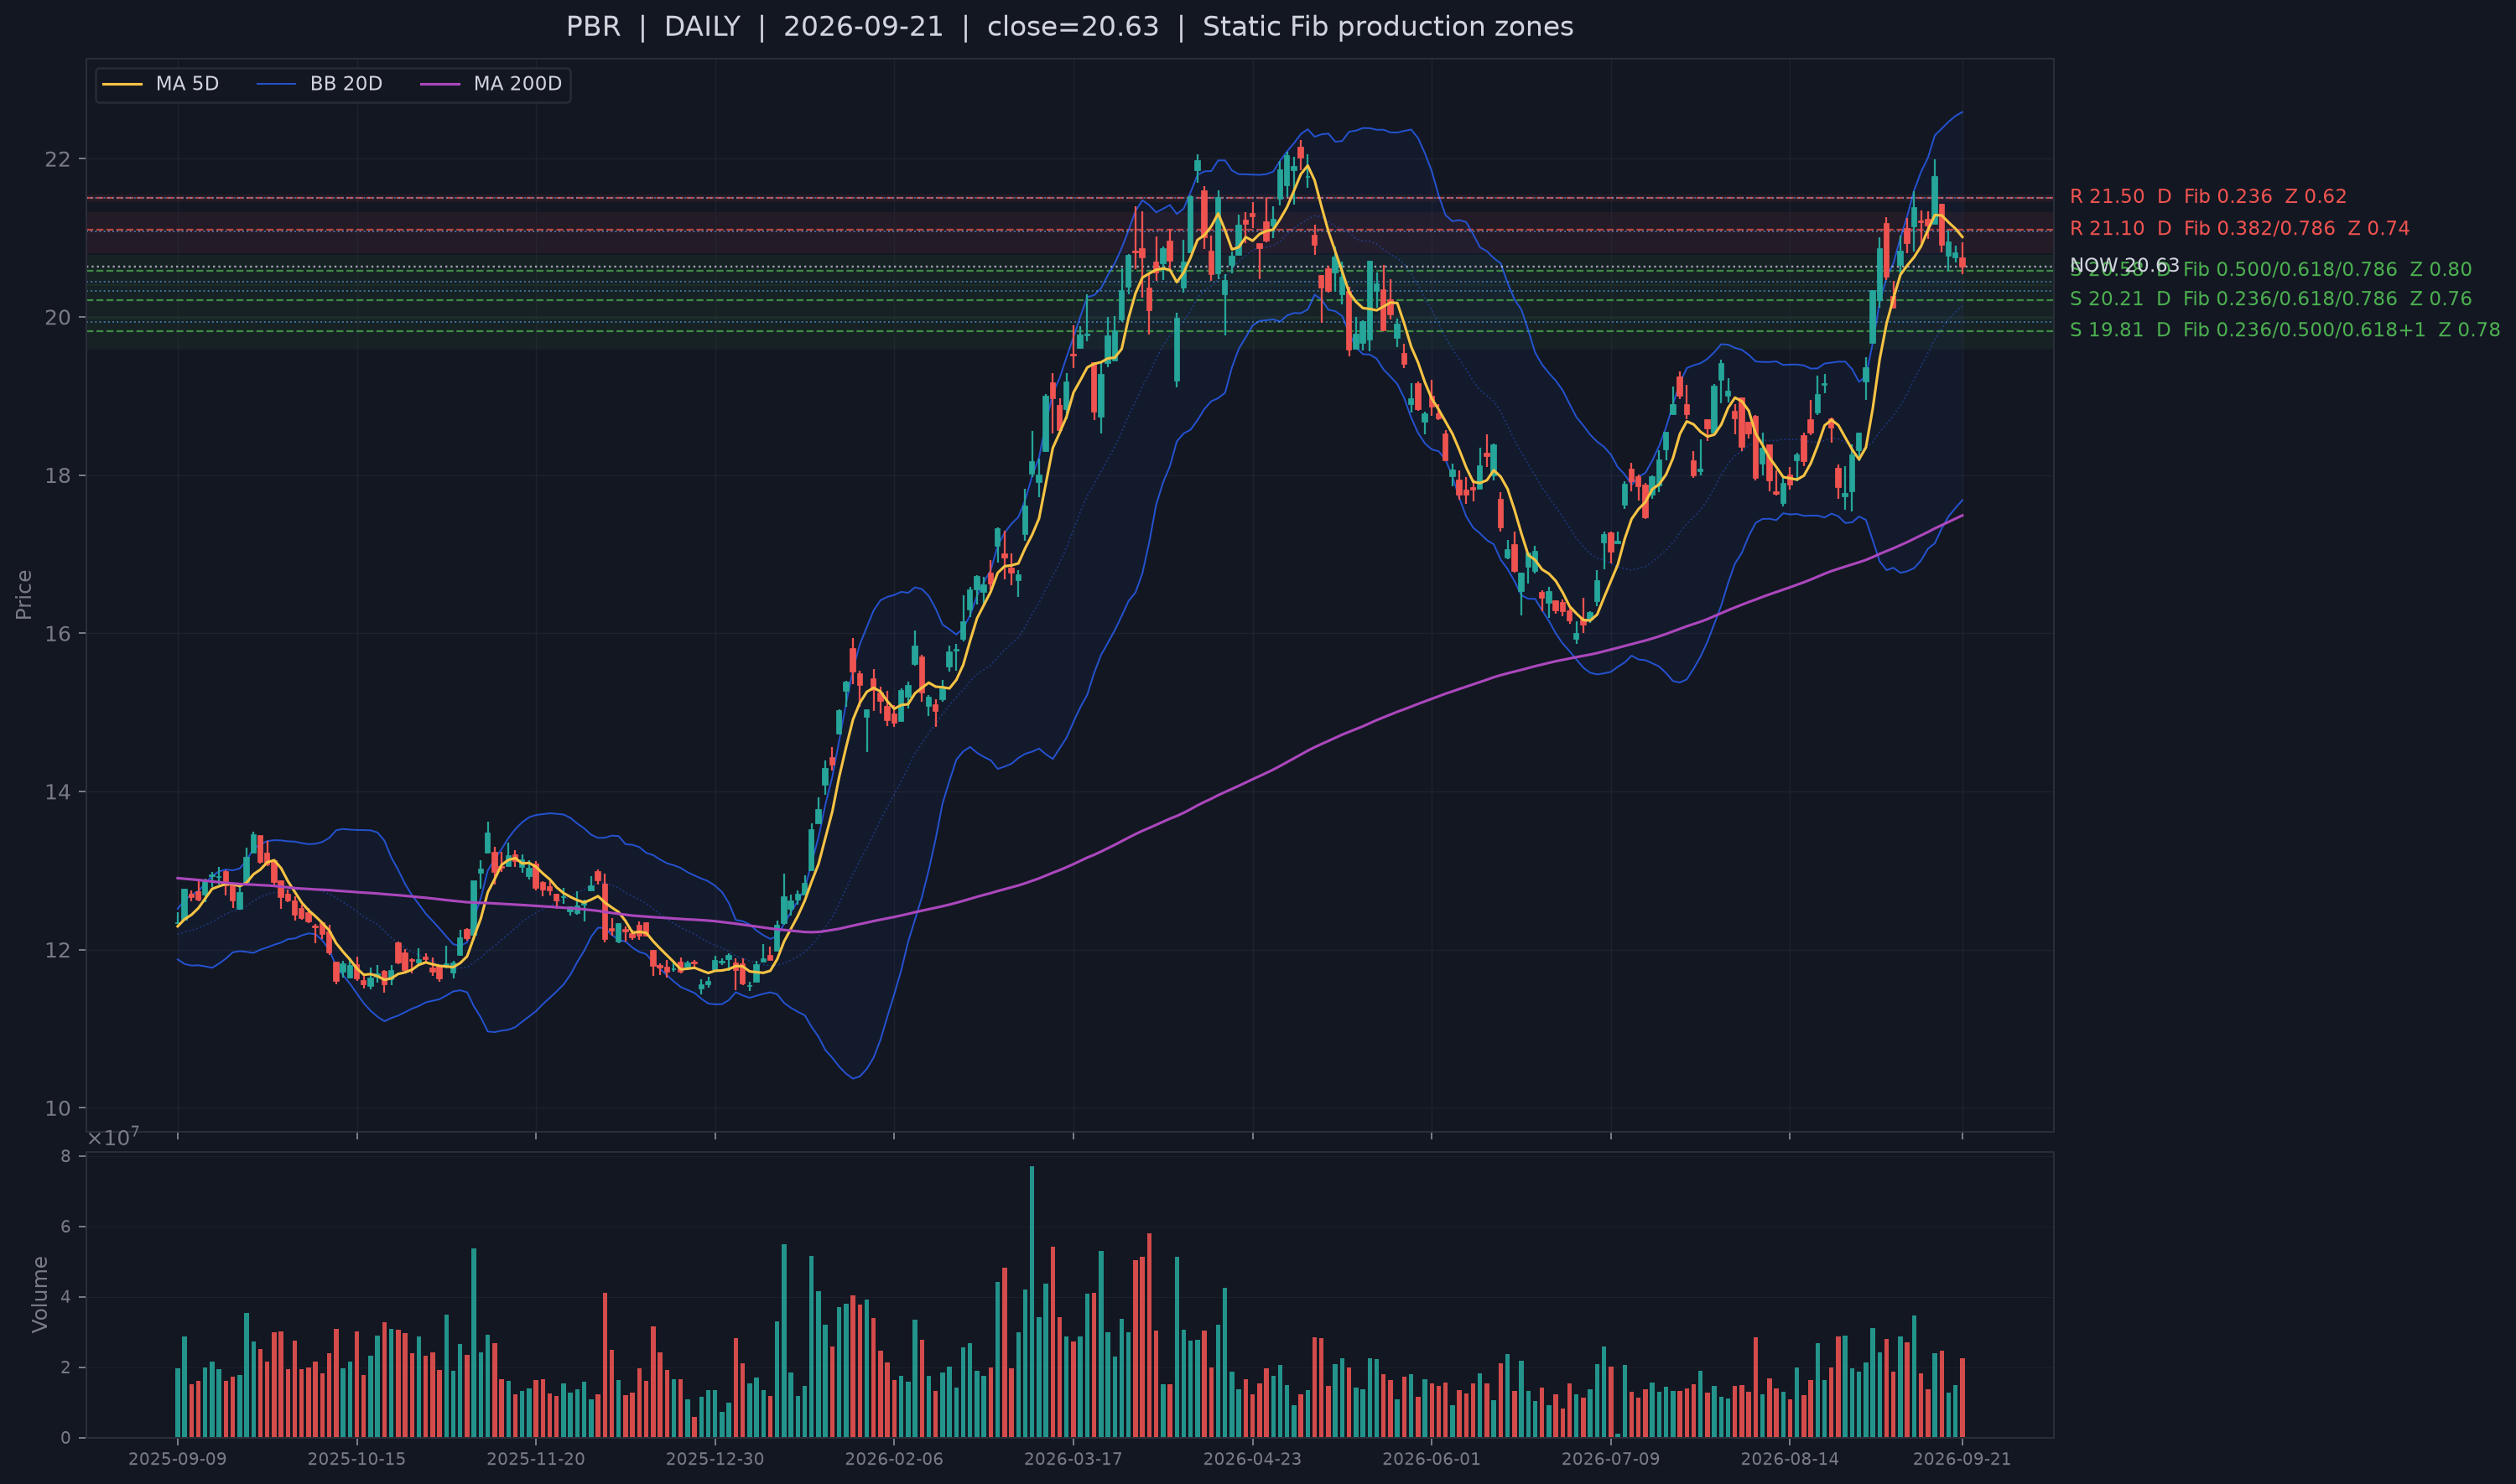
| PBR | Oil & Gas Upstream & Services | B Bull screen | #23 | #246 | Same-day bullish center reclaim; 1TD ago | 0.25% / 0.09 ATR | -1.8% / +2.5% | Financial context not available from comparable current sources / delayed 13F 0.95 |
| HUT | Asset Management & Capital Markets | A+ Bull screen | #4 | #113 | Same-day bullish center reclaim; 3TD ago | 0.81% / 0.10 ATR | +10.0% / +16.1% | Official-filing fallback: revenue YoY +81.4%, CFO margin -28.1% / delayed 13F 0.57 |
| IREN | Asset Management & Capital Markets | A+ Bull screen | #8 | #77 | Same-day bullish center reclaim; 1TD ago | 0.75% / 0.11 ATR | +6.6% / +12.2% | Official-filing fallback: revenue YoY -26.7%, CFO margin +297.1%, FCF margin -127.0% / delayed 13F 0.46 |
| HOOD | Asset Management & Capital Markets | B Bull screen | #19 | #60 | Next-day center reclaim after lower-wick test; 1TD ago | 1.22% / 0.22 ATR | +8.6% / +10.0% | Fin 0.10 / delayed 13F 0.12 |
| CRCL | Asset Management & Capital Markets | A Bull screen | #1 | #74 | Same-day bullish center reclaim; 1TD ago | 2.00% / 0.27 ATR | +7.8% / +3.0% | Official-filing fallback: revenue YoY +41.1%, CFO margin +552.7%, FCF margin +541.8%; institutional ownership snapshot 68.4% - non-comparable fallback, not a 13F flow rank |
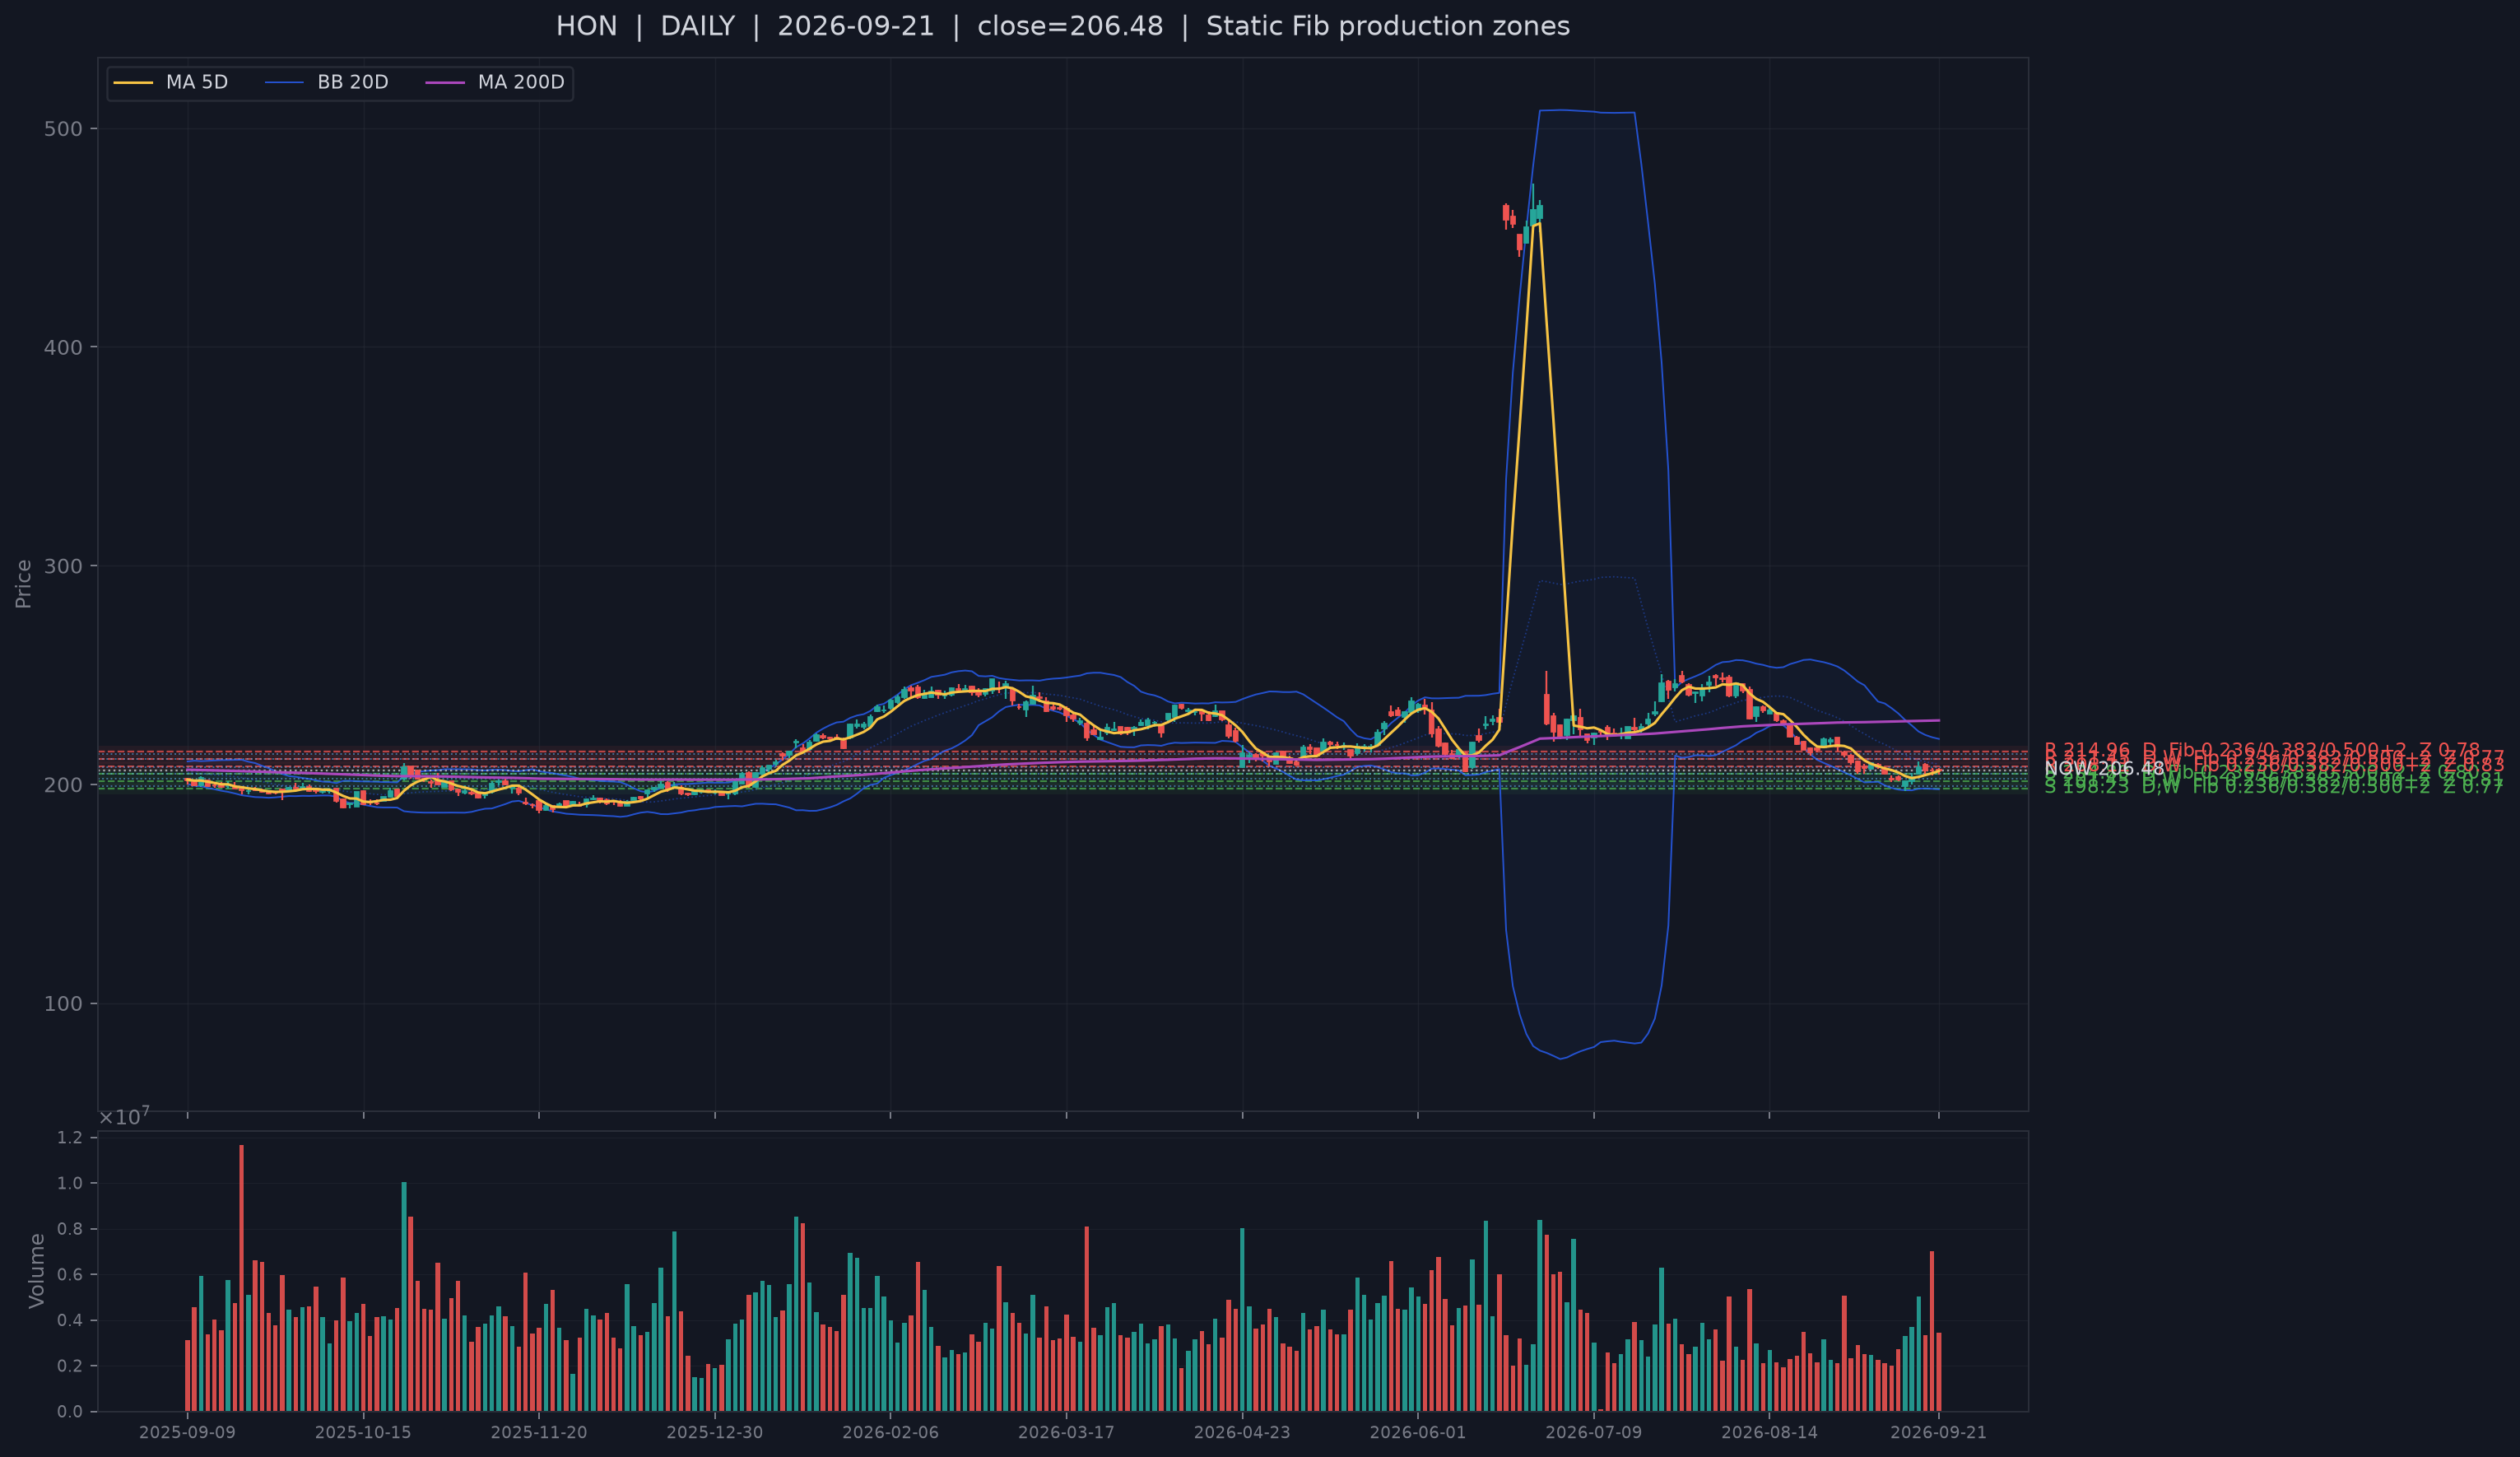
| HON | Industrial Services & Distribution | A Bull screen | #14 | #148 | Next-day center reclaim after lower-wick test; 0TD ago | 0.82% / 0.32 ATR | +0.2% / -1.3% | Fin 0.17 / delayed 13F 0.93 |
| COIN | Asset Management & Capital Markets | A Bull screen | #7 | #78 | Same-day bullish center reclaim; 1TD ago | 2.45% / 0.38 ATR | +11.0% / +10.7% | Fin 0.52 / delayed 13F 0.16 |
| ON | Semiconductors & Tech Hardware | A+ Bull screen | #11 | #127 | Same-day bullish center reclaim; 0TD ago | 2.07% / 0.39 ATR | +2.5% / -0.5% | Fin 0.71 / delayed 13F 0.59 |
| SNDK | Semiconductors & Tech Hardware | A+ Bull screen | #3 | #53 | Same-day bullish center reclaim; 2TD ago | 2.82% / 0.42 ATR | +7.4% / +10.4% | Fin 0.99 / delayed 13F 0.54 |
Slow-context disagreement is useful, but it is not an override. WULF has one of the weakest Financial ranks at 0.07 but delayed-holdings rank 0.72. HON is an even cleaner split at 0.17 versus 0.93. HOOD is weak on both slower ranks at 0.10 / 0.12 despite being +10.0% above MA20. COIN sits near the middle in Financial context at 0.52 but weak in delayed holdings at 0.16. By contrast, ON and SNDK are stronger in Financial context and not weak in delayed holdings. HUT and IREN do not have comparable Financial percentile ranks, but official-filing fallback context is available and mixed: HUT combines +81.4% revenue growth with a -28.1% CFO margin, while IREN shows -26.7% revenue growth, a +297.1% CFO margin and a -127.0% FCF margin. Those filing metrics are fallback fundamentals, not replacement Financial ranks. PBR has no Financial context from comparable current sources. CRCL’s 68.4% institutional-ownership snapshot is likewise a non-comparable fallback, not a 13F flow rank. Most comparable delayed-holdings snapshots used here became available in May or early June 2026, so they are multi-month context rather than a current-flow measure. The point is not to prefer one slow layer: the disagreement shows where current price/support strength has or has not been validated by slower evidence.
Digital infrastructure: fresh support plus a strong trend, but different business engines
WULF is the clearest near-support positive control: it sits only 0.04 ATR from current structural support and is +8.7% above MA20. HUT and IREN are also close to support at 0.10 and 0.11 ATR while trading +16.1% and +12.2% above MA20. HOOD, CRCL and COIN add the digital-market side of the same sector ranking. Public facts help explain the timing without deciding the rank: TeraWulf’s 20-year Anthropic agreement covers about 401 MW of critical IT capacity; Circle launched Arc on Sep. 16 with more than 100 institutional/ecosystem builders; Robinhood reported August crypto trading volume up 61% month over month. These are distinct mechanisms under one broad sector label, which is exactly why the economic subclusters matter.
Energy: PBR confirms support, but the sector’s price transmission is incomplete
PBR is second in the final support order and only 0.09 ATR from current live support, while remaining +2.5% above MA20. That makes it a useful selected control for Oil & Gas. But the broader sector is not clean: PBR is -1.8% versus MA5, and several large representatives have broken recent 5-day support. Petrobras’ Q2 operating record - 2.7 million barrels per day of operated oil in Brazil, up 15% year over year - provides a company-level operating mechanism, not proof that the whole sector is currently well bid. Reuters reported Brent at an 11-day low on Sep. 21. The quantitative and public layers therefore agree on structural support with weak short-term transmission, not on a broad energy breakout.
Industrials and semiconductors: support can arrive before trend repair, while strong trend can coexist with conflict
HON has fresh same-day support confirmation and the strongest delayed-holdings rank in the selected set at 0.93, but its Financial rank is only 0.17 and price remains 1.3% below MA20. Honeywell’s reported 16% order growth and roughly $20 billion backlog support an industrial-demand mechanism; they do not complete the price repair. HON is therefore a clean example of support confirmation plus strong slow holdings context not equaling completed trend repair.
ON and SNDK show the other side. Both passed current support confirmation, and SNDK is already +10.4% above MA20 while ON is only 0.5% below it. onsemi’s investor-day emphasis on AI power-density constraints and Sandisk’s 437% fiscal-year data-center revenue growth make the business mechanism concrete. Yet the sector’s Bear-risk rank is #1, with several semiconductor/hardware names appearing in the opposing cohort. Strong selected names therefore do not justify treating the entire sector as clean leadership.
6. What would confirm or falsify the 3-10 trading-day thesis
Base case - medium confidence: the fast market layers repaired materially: both indices are above MA20, breadth returned to balance and short-horizon damage cooled. Leadership also broadened beyond software into digital markets, energy, industrials and semiconductors. But the close still failed the order-flow state test, macro stress remains tight, sector confirmation is heterogeneous and the long-horizon new-low tail is still elevated. The evidence therefore supports conditional broadening rather than an all-clear risk-on regime.
Constructive confirmation: Aggressor Flow needs an early and persistent reclaim above 50, Depth should hold above neutral and Alignment should recover and sustain neutral rather than repeat a late fade. Breadth should remain at or above the balance area, 20-day and 252-day new-low pressure should continue to ease, and the weaker sector controls - PBR versus MA5, HON versus MA20, ON versus MA20 - should improve without breaking current structural support.
Strongest counterevidence: funding-price stress and weak liquidity remain adverse, credit does not fully confirm the equity relative-preference move, CFTC positioning does not broadly validate the newest rotation, and the semiconductor sector is simultaneously Bear-risk #1. Oil and Midstream also have rank strength without clean representative price transmission.
Bearish falsifier: if the three order-flow axes again close below neutral, breadth falls back below balance, short-horizon new lows and large-decline breadth begin expanding together, and a material share of the selected support set breaks current live support, the current repair would look less like healthy broadening and more like a failed rebound before renewed propagation.
What this evidence does not establish: it does not identify institutional accumulation/distribution, buyer or seller exhaustion, or observed dollar flows across sectors. R and sector ranks are price-implied relative states; delayed holdings and weekly CFTC data are slower context.
Sources
- Reuters - Nasdaq notches record-high close, AI optimism reignites and Treasury yields retreat (2026-09-21).
- TeraWulf - TeraWulf Reports Second Quarter 2026 Results (2026-08-05).
- Circle - Circle Launches Arc Mainnet, an Economic Operating System for the Internet (2026-09-16).
- Robinhood - Robinhood Markets, Inc. Reports August 2026 Operating Data (2026-09-10).
- IREN - Next-Gen Data Centers for AI, HPC & Sustainable Compute (accessed 2026-09-22).
- Petrobras - Petrobras Reports R$ 52.4 Billion Profit in the Second Quarter of 2026 (2026-08-06).
- Honeywell - Honeywell Technologies Reports Second Quarter Results (2026-07-23).
- onsemi - onsemi Charts Path to Power the Next Decade of Innovation (2026-09-16).
- Sandisk - Sandisk Reports Fiscal Fourth Quarter 2026 Financial Results (2026-08-05).
- CFTC - Commitments of Traders reports dated September 15, 2026 (2026-09-15).
Methodology
Market Layers is an independent quantitative research publication focused on U.S. equities. The process is data first and narrative second: quantitative observations define the questions, while public company filings, official data and high-quality reporting test mechanisms and counterevidence. Stock selection is fixed before public research; recent structural support is primary, price geometry is secondary, and Financial / delayed-holdings context is slower confirmation or contradiction. Order-flow analysis separates Aggressor Flow, Depth Pressure and Flow/Depth Alignment and compares the path with the absolute 50-neutral state and same-time history. This research is designed for 3-10 trading-day swing setups; the signals and conclusions may not transfer to intraday trading or longer-horizon investing. It is for informational and research purposes only and is not investment advice.