Nasdaq Strength Hides Weaker Breadth as Software and Digital Infrastructure Take the Lead
Nasdaq price strength persists, but breadth is weak, new-low damage is rising and a failed midday order-flow repair leaves a high next-session confirmation burden as leadership rotates toward enterprise software and digital infrastructure.
This research is designed for 3-10 trading-day swing setups. The signals and conclusions may not transfer to intraday trading or longer-horizon investing.
Key takeaway
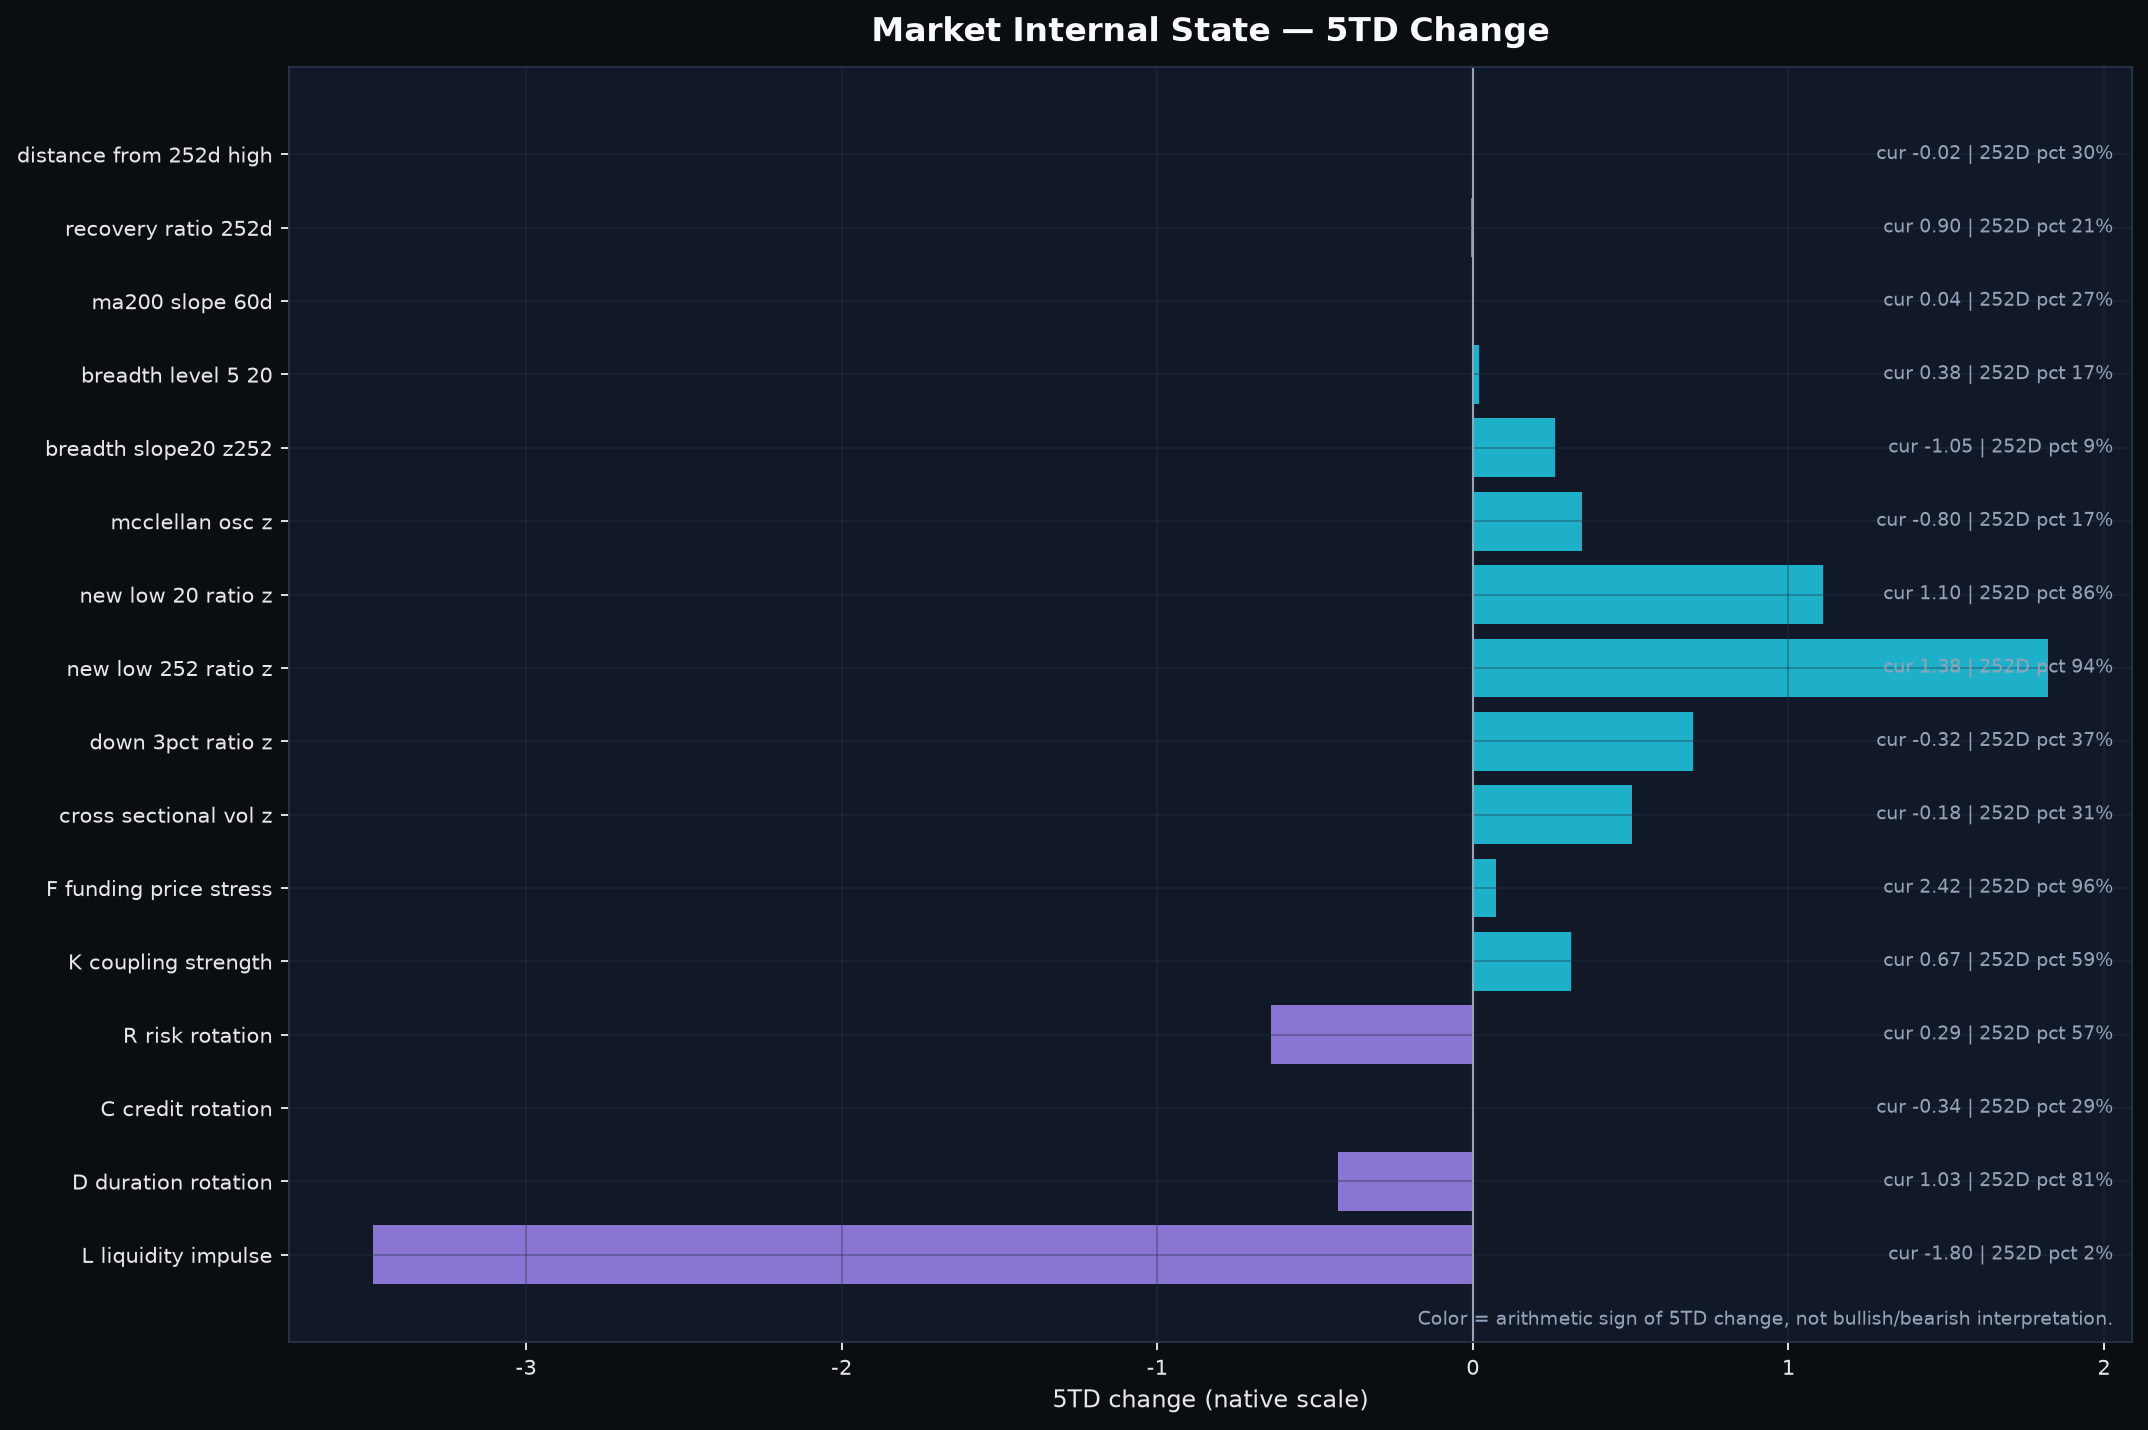
The Nasdaq is still carrying the index surface, but the internals are becoming harder to ignore. The Nasdaq Composite closed 1.16% above its 5-day average and 0.97% above its 20-day average, while the S&P 500 was 0.54% above MA5 but 0.11% below MA20. Beneath that price resilience, breadth was only 0.385 - still well below the 0.50 balance area - and the 20-day breadth slope remained weak at -1.05 z. More importantly, downside damage is no longer as quiet as it was a session earlier: the 20-day new-low ratio reached +1.10 z and the 252-day new-low ratio +1.38 z. Large one-day declines and cross-sectional volatility are not yet elevated enough to call broad liquidation, but the damage layer has moved from “absent” to “notable and rising.”
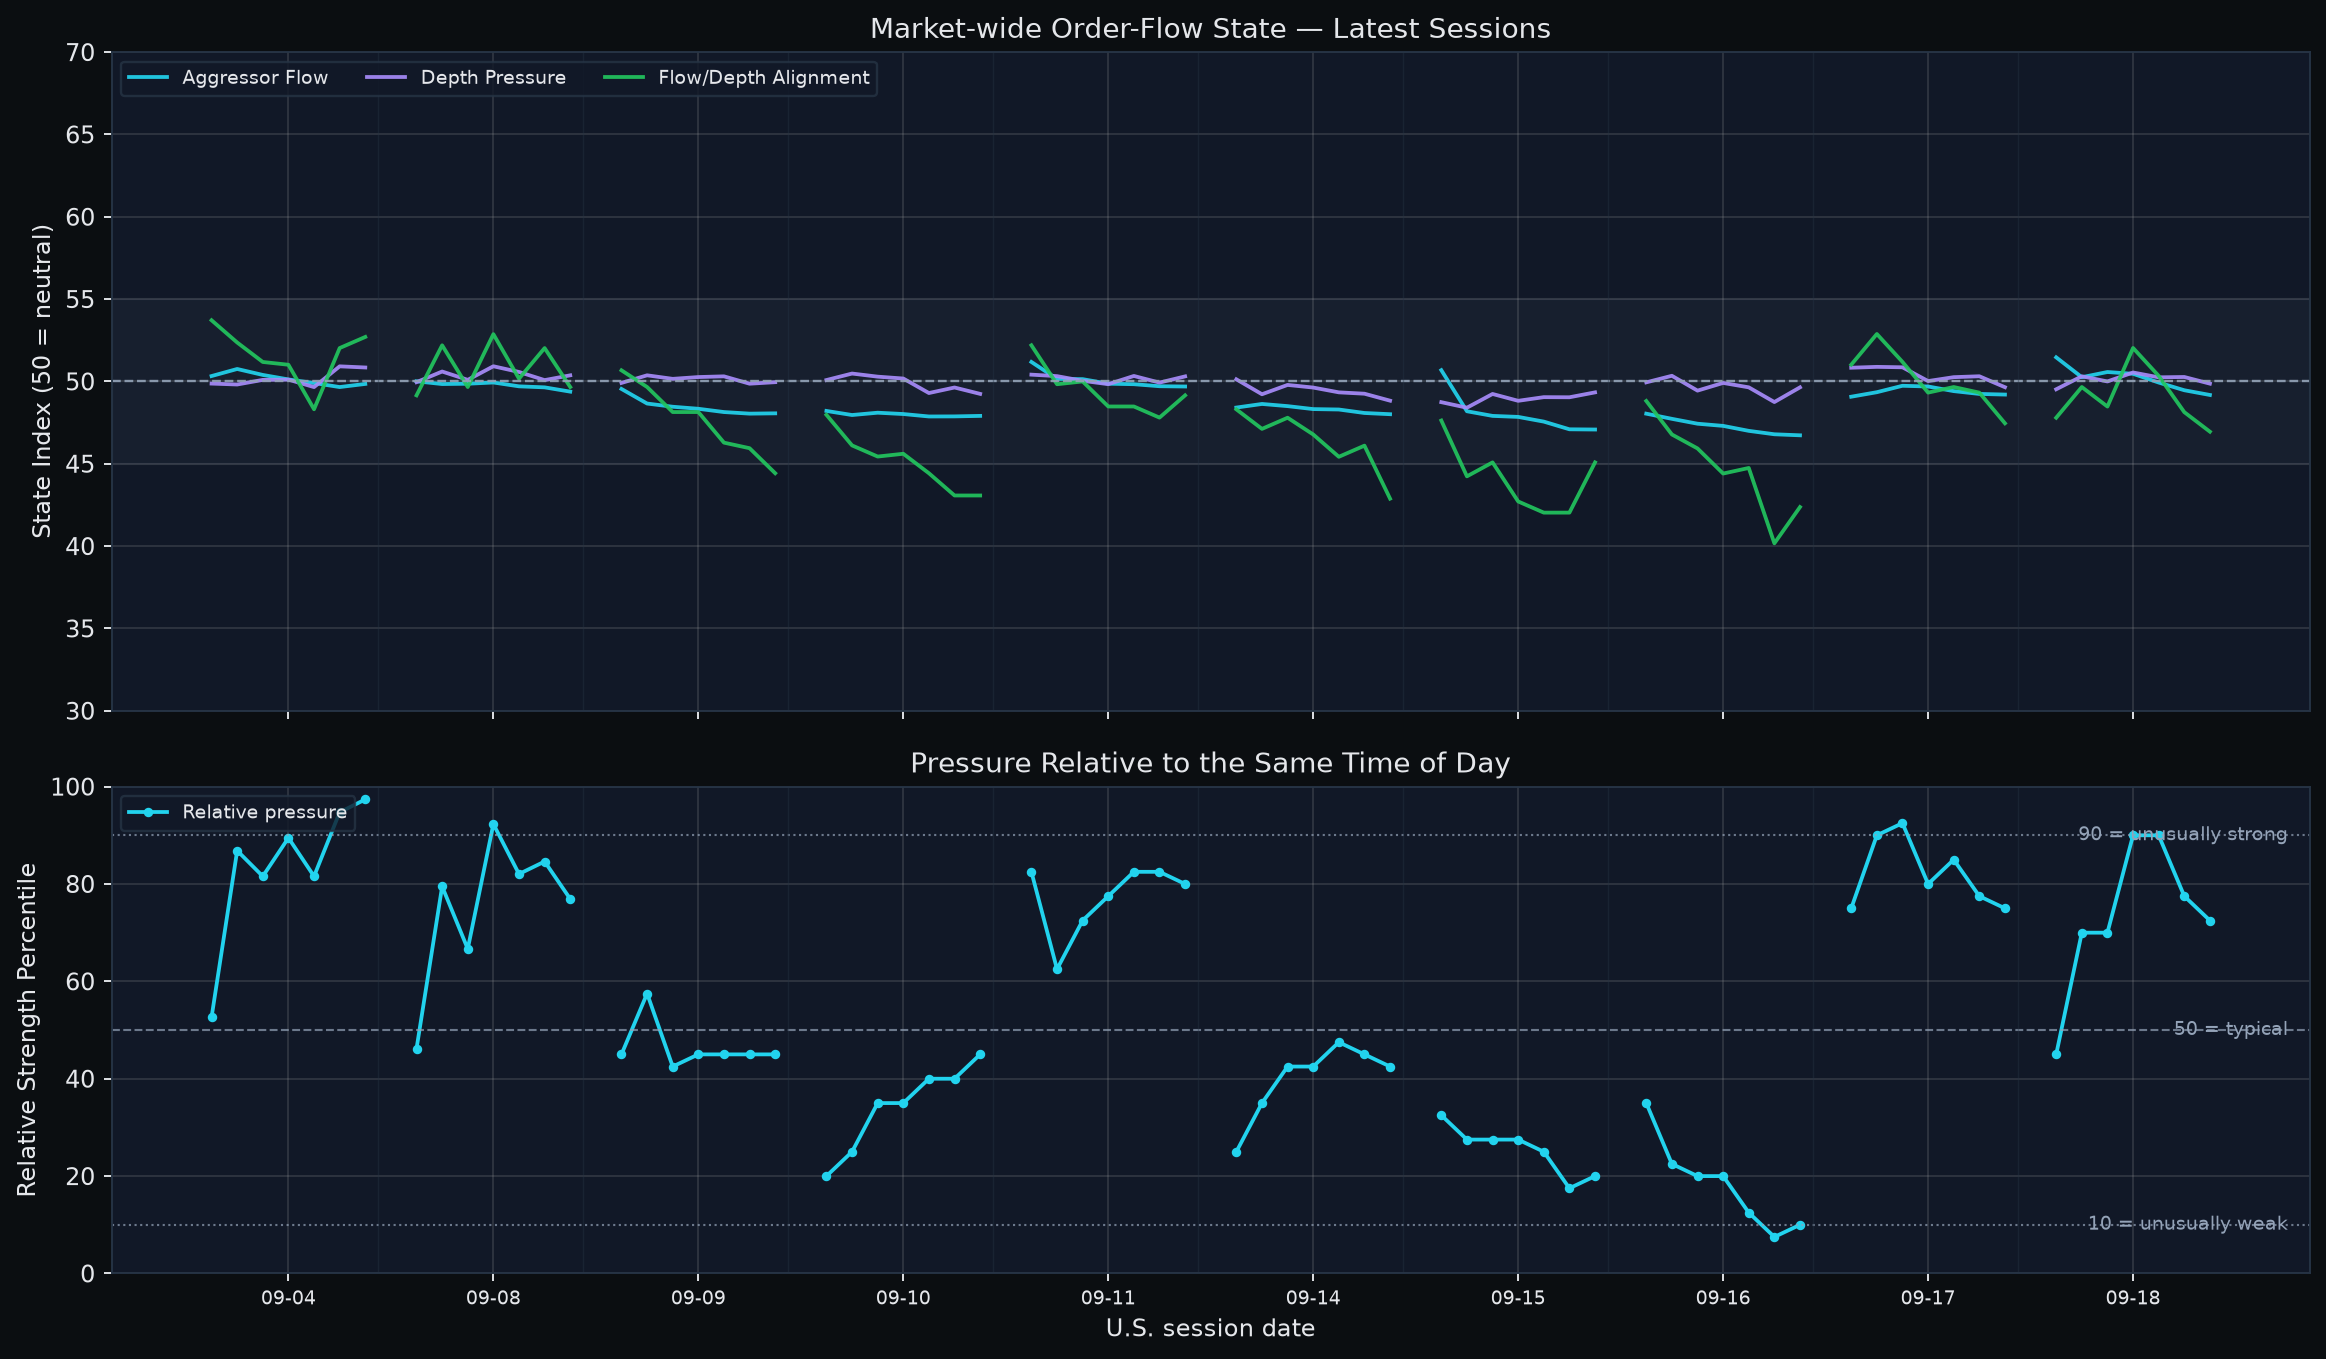
The intraday order-flow path did not repair that concern. The three state axes briefly converged around neutral near midday, with Flow/Depth Alignment reaching 52.0 at 12:30 ET, but that improvement failed. In the final hour Aggressor Flow fell to 49.18, Depth Pressure to 49.87 and Alignment to 46.95. Bull-aligned breadth fell 2.0 percentage points, Bear-aligned breadth rose, and buy-absorption-compatible breadth fell sharply. This was a failed midday repair followed by final-hour deterioration, with all three state axes closing below neutral. The equal-weight basket still gained 0.34% from open to close, so the tape is not a synchronized selloff. But the next session inherits a high repair burden.
Leadership also changed. Enterprise Software & IT Services moved to Bull rank #1 and Asset Management & Capital Markets to #2, while semiconductors dropped out of the Bull Top 5. The support-confirmed stock set now concentrates in enterprise AI/data platforms, AI cloud and power-rich data centers, digital financial infrastructure, security and selected advanced-power exposure. That is coherent enough to support a selective thesis, but not clean enough to call broad risk-on: the top three Bull sectors are all simultaneously high in Bear-risk. My base case is therefore selective technology/digital-infrastructure leadership inside a fragile, increasingly damage-sensitive market.
How to read today’s indicators
| Indicator | Scale / reference | Reader interpretation |
|---|---|---|
| Market-wide order-flow state | Three state indices; 50 = neutral | Aggressor Flow, Depth Pressure and Flow/Depth Alignment answer different questions. Read confirmation/divergence across the three; they are not probabilities. |
| Same-time order-flow percentile | 0-100; 50 = same-time historical median | 90 is unusually strong and 10 unusually weak for that intraday slot. It is not an event probability. |
| Flow x depth state breadth | Cross-sectional percentages | Bull/Bear aligned show joint direction; absorption-compatible breadth shows disagreement compatible with absorption, not actor identity or intent. |
| Market breadth | 0-1; about 0.50 = balance | Level measures participation; direction and slope show whether participation is broadening or narrowing. |
| z-score | 0 = historical mean | |1| is notable and |2| unusual. It is standardized distance, not probability. |
| Historical percentile | 0-100; 50 = median | 90+ is historically elevated, but not an event probability. |
| Financial / delayed-holdings context rank | 0-1; 0.50 = cross-sectional middle | Higher values mean stronger slow context among current candidates. Delayed holdings are not today’s institutional flow. |
| Slow-context versus price divergence | Centered near 0 | Positive means slow context is stronger than price rank; negative means price is ahead. It is not a standalone signal. |
| Expected next-session trading range | High-low amplitude, non-directional | Read with its same-day cross-sectional percentile. It is not an upside target. |
1. Price resilience is real; participation and new-low damage are the constraint
| Layer | Current evidence | Interpretation | What changes the read |
|---|---|---|---|
| Index price | S&P: MA5 +0.54%, MA20 -0.11%; Nasdaq: MA5 +1.16%, MA20 +0.97% | Nasdaq trend is firmer; S&P is still near, but slightly below, MA20. | A joint loss of MA5 with weaker breadth would make the index surface less defensible. |
| Breadth | 0.385; 20-day slope -1.05 z; breadth percentile about 17 | Participation remains narrow despite index resilience. | A sustained move toward 0.50 would validate broader repair. |
| New-low damage | 20-day new-low z +1.10; 252-day new-low z +1.38 | Damage is now notable and rising rather than fully contained. | Further new-low expansion together with large-decline breadth and dispersion would mark propagation. |
| Large-decline / dispersion | Stocks down 3%+ z -0.32; cross-sectional volatility z -0.18 | Broad liquidation is not yet synchronized. | A simultaneous jump here would remove the main counterevidence to a risk-off interpretation. |
| Structural warning | Systemic-warning percentile 94.0%; structural-watch percentile 92.8% | Historically elevated configuration, not a calibrated crash probability. | Current price/breadth/damage propagation is required before treating it as an active breakdown. |
The important change is not that every damage measure is flashing. It is that new lows are now rising while breadth is still weak. A high index close can coexist with that structure for a while, especially when a narrow technology cohort is carrying performance. The constructive counterargument is that the share of stocks falling 3% or more and cross-sectional volatility remain below their historical means. That means the market is fragile, but the evidence still stops short of broad liquidation. A clean bearish escalation requires the two layers to meet: weak breadth plus expanding, synchronized damage.
2. Midday repair failed; the final hour increased the next-session burden
| ET | Aggressor Flow | Depth Pressure | Flow/Depth Alignment | Same-time %ile | Bull aligned | Bear aligned | Buy absorption | Sell absorption | EW bar |
|---|---|---|---|---|---|---|---|---|---|
| 09:30 | 51.5 | 49.5 | 47.8 | 45.0 | 17.3% | 21.7% | 11.9% | 16.9% | -0.005% |
| 10:30 | 50.3 | 50.3 | 49.7 | 70.0 | 14.9% | 15.6% | 17.3% | 17.6% | +0.001% |
| 11:30 | 50.6 | 50.0 | 48.5 | 70.0 | 16.3% | 19.3% | 18.0% | 18.3% | -0.001% |
| 12:30 | 50.5 | 50.5 | 52.0 | 90.0 | 18.6% | 14.6% | 20.3% | 15.6% | +0.001% |
| 13:30 | 49.9 | 50.3 | 50.3 | 90.0 | 16.9% | 16.3% | 22.4% | 17.6% | +0.001% |
| 14:30 | 49.5 | 50.3 | 48.1 | 77.5 | 15.6% | 19.3% | 23.7% | 13.9% | +0.001% |
| 15:30 | 49.2 | 49.9 | 46.9 | 72.5 | 13.6% | 19.7% | 18.3% | 15.3% | +0.001% |
The session was not uniformly weak. Aggressor Flow opened above neutral at 51.5, Depth moved above 50 by 10:30, and the strongest point came at 12:30 when Alignment reached 52.0 and the same-time percentile reached 90. That was the day’s best candidate for state repair. It did not hold. By 13:30 Aggressor was already below 50; Alignment then fell from 50.34 at 13:30 to 48.14 at 14:30 and 46.95 at the close.
The broader late window and the final hour tell the same story. From 13:30 to the close, Aggressor deteriorated 0.75 points, Depth 0.38 and Alignment 3.39. In the final hour alone, Aggressor fell another 0.29, Depth 0.40 and Alignment 1.19. The close left reclaim distances of 0.82 points for Aggressor, 0.13 for Depth and 3.05 for Alignment. Bull-aligned breadth fell 2.03 percentage points in the final hour while Bear-aligned breadth increased 0.34; buy-absorption-compatible breadth fell 5.42 points while sell-absorption-compatible breadth rose 1.36.
This is late deterioration below neutral, not effort without full repair. There is no repaired state to preserve into the next session. A constructive reset needs an early reclaim of all three axes and, especially, a sustained improvement in Alignment beyond the opening impulse. That reclaim should be accompanied by Bull-aligned breadth and by stable or improving equal-weight price, breadth and damage. The strongest counterevidence to an outright bearish read is still price: the equal-weight basket gained 0.34% from open to close and the closing same-time percentile remained 72.5. Order-flow weakness has therefore raised the burden of proof without yet forcing a broad downside regime conclusion.
3. Cross-asset pressure is tight, but the destination anatomy is not a textbook safety trade
| Layer | Current state | What it says |
|---|---|---|
| Discount-rate / funding stress | +2.42 z, about 96th percentile | Financial pricing remains unusually tight for long-duration equities. |
| Liquidity impulse | -1.80 z, about 2nd percentile | Liquidity is a second macro headwind. |
| Duration preference | +1.03 z | Longer-duration Treasuries retain a positive current relative state. |
| Credit risk appetite | -0.34 z | Credit does not provide a clean risk-on confirmation. |
| Cross-asset coupling | +0.67 z; 20-day change +0.03 | Coupling is moderate, not crisis-like; node contributions matter. |
The Fed’s September 16 decision to raise the policy range by 25 basis points to 3.75%-4.00% is consistent with the private stress layer: inflation remains a constraint, and public market reporting at the September 18 close showed 10-year Treasury yields above 5% and crude above $100. Those facts are a macro headwind, not a mechanical reason to discard support-confirmed stocks.
Duration preference and R destination anatomy answer different questions. Duration preference describes the current relative state; the 20-trading-day R anatomy asks which sleeves account for the recent change in relative preference. On that second question, industrial metals are the clear positive destination: R-gap attribution is +0.054 and own-price pressure change is +1.01. Long Treasuries, by contrast, have only +0.02 own-pressure change and a negative R-gap attribution of -0.056. High Yield has positive own pressure (+0.33) but a negative R-gap contribution (-0.022). So the recent relative-price rotation is selective and non-classical, not a simple flight from equities into Treasuries. These are price-implied relative states, not observed dollar flows.
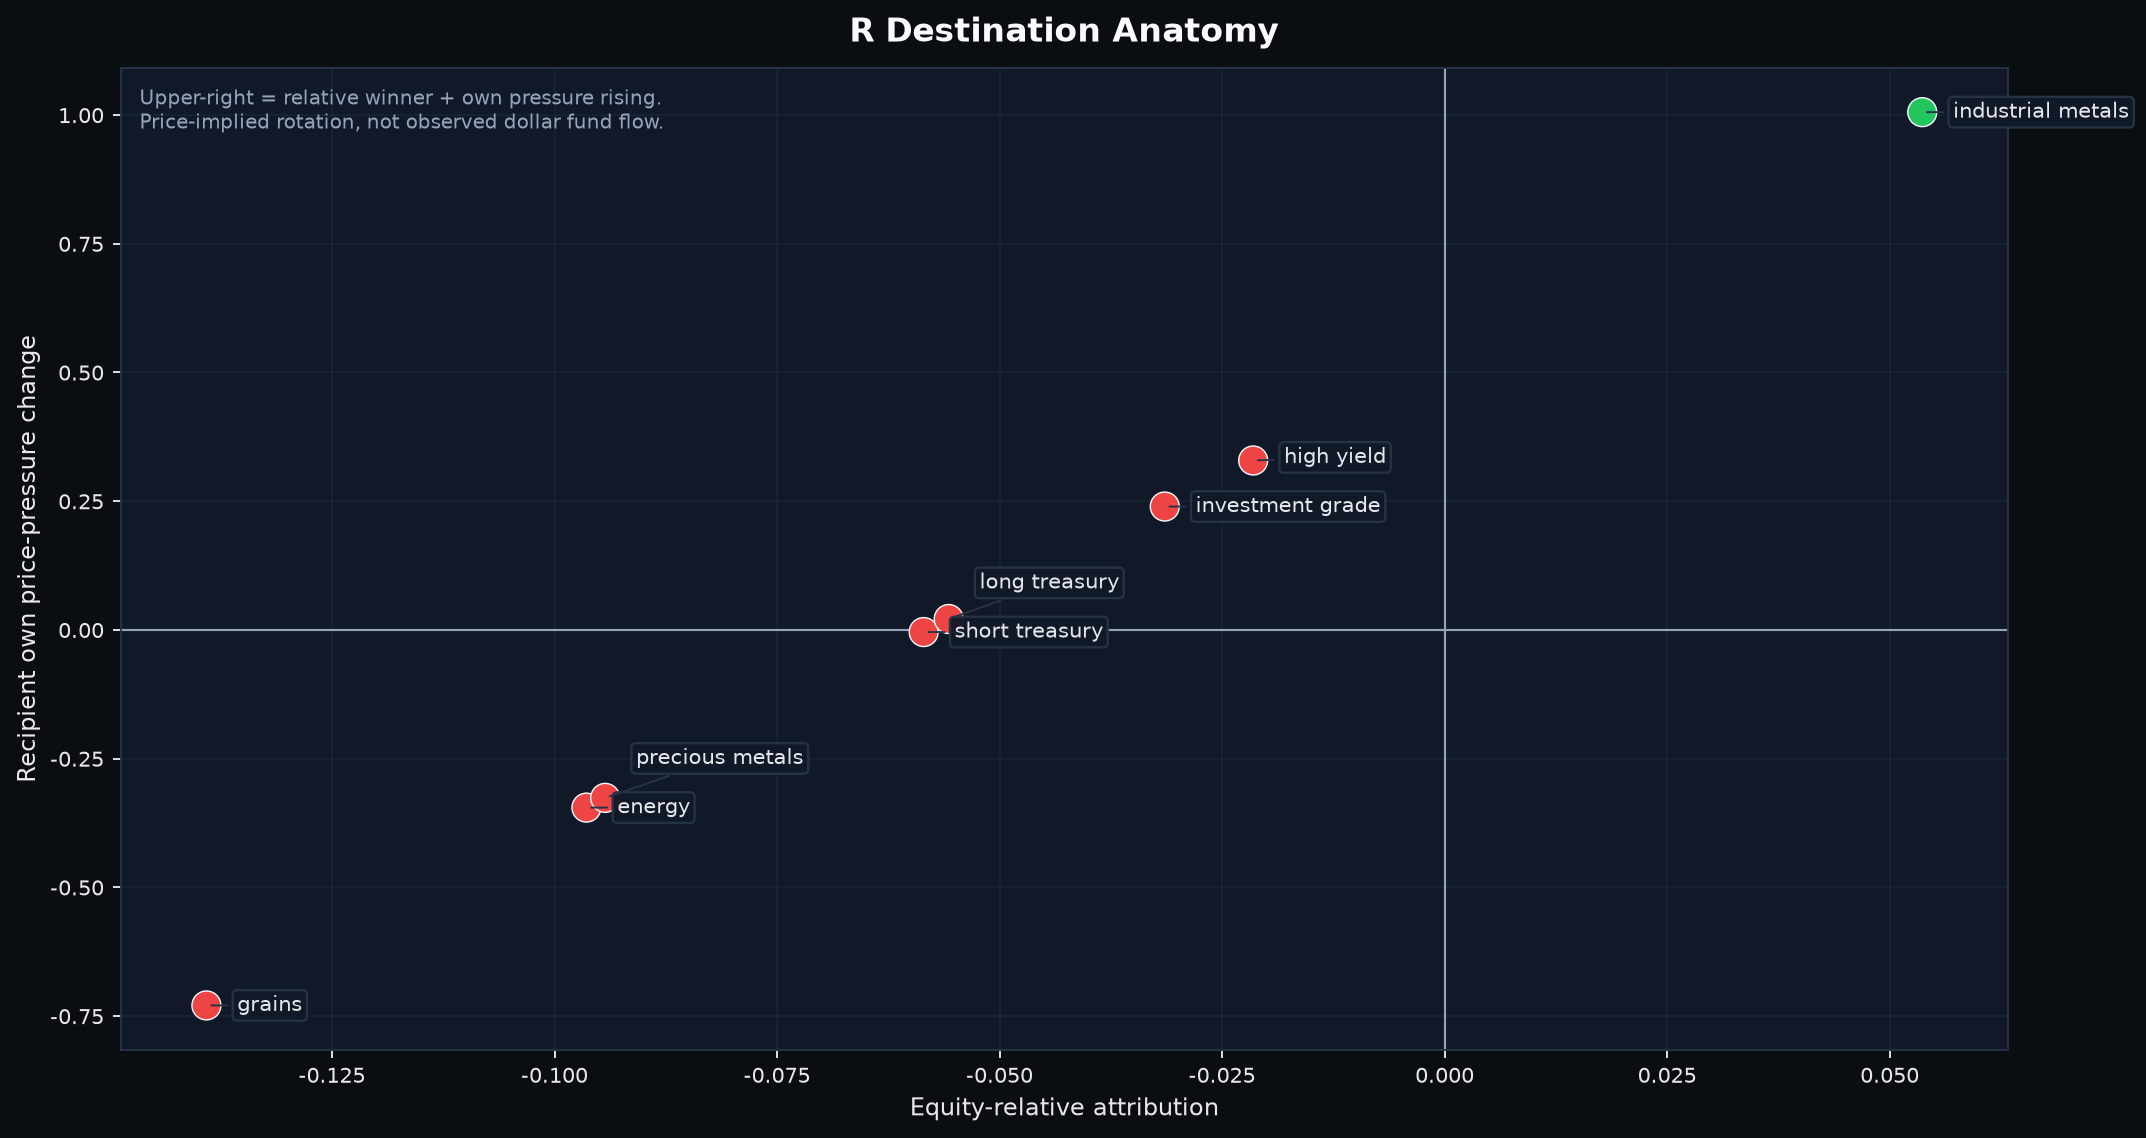
The coupling decomposition reinforces that caution. Over 20 trading days the positive contribution to K came primarily from industrial metals (+0.014), energy (+0.012) and precious metals (+0.012), while the equity node contributed -0.006. Moderate coupling is therefore not evidence that every asset class is synchronizing around an equity-led risk-off move. It is a common-mode increase whose recent positive contributors are concentrated in real assets.
Weekly futures positioning is current on its normal release schedule but still lagged. The latest CFTC report is September 15, three trading days before this market close. Across covered sleeves, the weekly positioning comparison is directionally inconsistent with the newer price-implied R rotation: the aggregate confirmation score is negative and industrial-metals positioning in particular does not confirm the current price destination. That is useful counterevidence, but the three-day lag means it should be treated as soft, backward-looking context rather than a same-day veto.
4. Leadership rotated toward software and digital infrastructure - but the top ranks are conflicted
| Bull rank | Sector | Bear-risk rank | Balance state | Representative tickers | Public read |
|---|---|---|---|---|---|
| #1 | Enterprise Software & IT Services | #5 | Two Sided Conflict | WDAY, NET, ZS, GRAB, SNOW, CRWV, APLD | Enterprise AI/data platforms; security; AI cloud/data-center |
| #2 | Asset Management & Capital Markets | #2 | Two Sided Conflict | WULF, CRCL, RIOT, BMNR, HOOD, IREN, HUT | Digital financial infrastructure; crypto-sensitive compute/data centers |
| #3 | Industrial Machinery, Automation & Instruments | #3 | Two Sided Conflict | SMR, BE, VRT, COHR, FPS, GEV, PH | Advanced nuclear; power and data-center equipment |
| #4 | Oil & Gas Upstream & Services | #8 | Bull Dominant | FANG, EQT, RIG, PBR, XOM, SLB, DVN | Upstream producers and oilfield services |
| #5 | Consumer Services, Leisure & Hospitality | #27 | Bull Dominant | CMG, ABNB, CCL, MAR, EXPE, SBUX, RCL | Travel, lodging, restaurants and leisure |
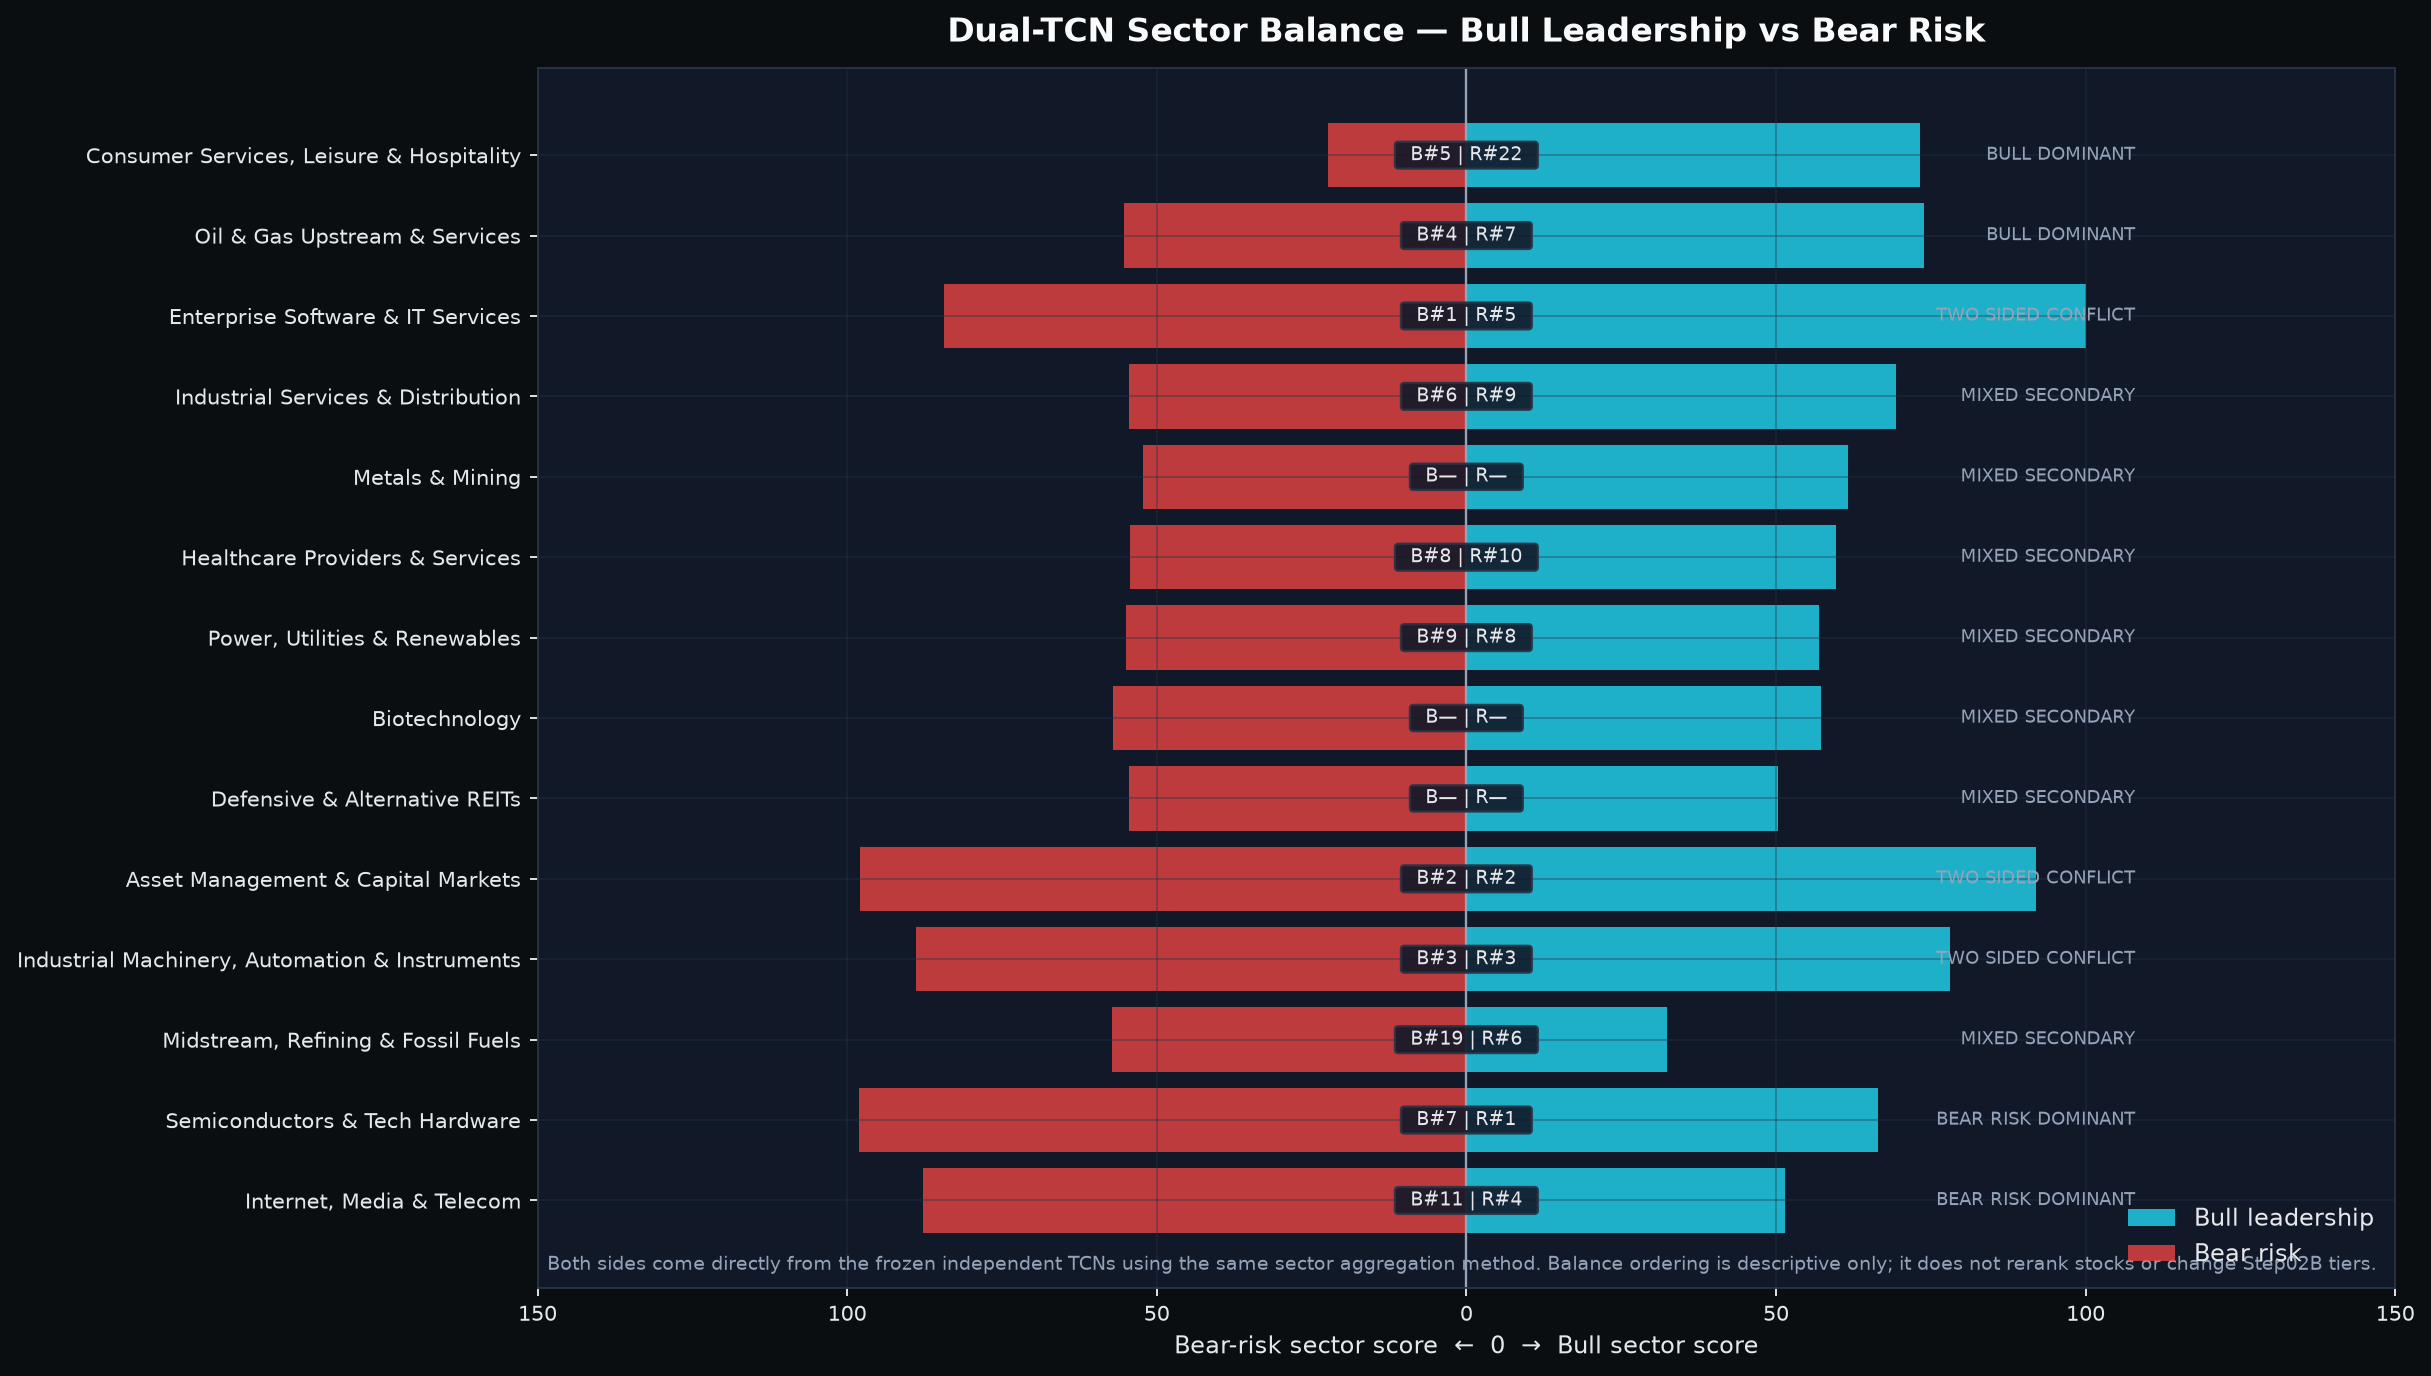
The change from the recent history is material. On September 14, industrial machinery and semiconductors occupied the top two Bull slots. By September 18, Enterprise Software & IT Services had moved to #1 and Asset Management & Capital Markets to #2; semiconductors had dropped out of the Top 5, while oil and consumer services entered. This is not a claim about dollar flows. It is a change in the cross-sectional ranking and composition of current short-horizon signals.
| Sector | Leading subcluster(s) | Key names | Economic linkage | Quant / price-support confirmation | Why now / public mechanism | Strongest counterevidence |
|---|---|---|---|---|---|---|
| Enterprise Software & IT Services | Enterprise AI/data platforms; security; AI cloud/data-center | SNOW, ORCL, CRWV, ZS, FIG, APLD | Shared enterprise AI spend and compute/security stack | SNOW, ORCL, CRWV, APLD, ZS and FIG are in the final support set; CRWV is still 5.6% below MA20 and FIG 10.1% below. | Snowflake product revenue +37%; Oracle IaaS +121%; Zscaler ARR +25%; Figma AI adoption; APLD contracted AI-factory capacity. | Bear-risk #5; leadership is broad in count but still two-sided, and several names have incomplete trend repair. |
| Asset Management & Capital Markets | Digital financial infrastructure; crypto-sensitive compute/data centers | RIOT, WULF, CRCL | Crypto market infrastructure plus power-rich compute capacity | RIOT, WULF and CRCL are support-confirmed; RIOT/WULF are well above MA20. | Circle Arc mainnet; Riot and TeraWulf long-duration AI data-center contracts. | Bear-risk #2 with six Bear Top30 names; crypto beta and high rates keep the sector conflicted. |
| Industrial Machinery, Automation & Instruments | Advanced nuclear; power and data-center equipment | SMR, BE, VRT, COHR | Power scarcity and physical infrastructure for data centers/industrial load | SMR is support-confirmed but 11.7% below MA20; sector has only one Bull Top30 versus two Bear Top30. | NuScale reports commercialization/supply-chain progress and continuing TVA discussions. | Bear-risk #3 and weak trend geometry in SMR prevent a clean sector-wide confirmation. |
| Oil & Gas Upstream & Services | Upstream producers and oilfield services | FANG, EQT, RIG, XOM, SLB | Direct commodity-price and upstream cash-flow exposure | Bull-dominant sector state; no final selected stock comes from this sector. | Public market reporting showed crude still above $100 at the close, consistent with stronger upstream economics. | High oil also raises inflation/growth risk, and no support-confirmed final stock provides stock-level transmission. |
| Consumer Services, Leisure & Hospitality | Travel, lodging, restaurants and leisure | CMG, ABNB, CCL, MAR, EXPE, SBUX, RCL | Consumer services and discretionary travel demand | Bull #5 with Bear-risk #27, the cleanest balance state of the Top5; no final selected stock. | No single article-date-safe catalyst explains the full group; strength is treated as a cross-sectional rotation rather than a single-news story. | High rates and energy costs can squeeze discretionary demand; no support-confirmed final stock confirms the sector signal. |
Enterprise Software is broad in count but not clean in balance. Snowflake’s September 2 results showed product revenue of $1.49 billion, up 37% year over year, with RPO up 30%; Oracle reported Q1 cloud revenue up 62% and IaaS revenue up 121%, alongside 850 MW of added data-center capacity. Zscaler’s latest results show 25% revenue and ARR growth, and Figma reported 48% revenue growth with AI-credit monetization and broad agent adoption. Those facts support a real enterprise-AI spend mechanism. But current price confirmation is uneven: CRWV is 5.6% below MA20 and FIG 10.1% below, even though both recently confirmed structural support. That keeps the sector in the “two-sided” category rather than converting the public narrative into a blanket software call.
Asset Management & Capital Markets is even more internally conflicted. In the quantitative taxonomy it contains crypto-sensitive and digital-infrastructure names. Circle launched Arc mainnet on September 16 with more than 100 institutional/ecosystem builders and more than $74 billion of USDC in circulation. Riot has 241 MW of contracted critical IT capacity across AI tenants, while TeraWulf disclosed a 20-year Anthropic lease for roughly 401 MW. These public facts explain why RIOT/WULF/CRCL can move together around a digital-infrastructure theme, but Bear-risk rank #2 warns against treating the sector as clean leadership.
Industrial machinery is a smaller but economically important power leg. NuScale continues to advance commercialization readiness, supply-chain work and discussions toward a TVA power agreement; yet SMR, the only final selected name from the sector, remains 11.7% below MA20. Oil’s Bull-dominant state is consistent with a high commodity-price backdrop, while consumer services have the cleanest Bear-risk rank among today’s Top 5 but no final support-confirmed stock. The combined leadership mix is best classified as multiple sector overlays sharing a high-capex / high-nominal-growth backdrop, not one clean macro risk-on factor.
5. The selected support set is coherent, but trend quality and slow context disagree
| Stock | Sector | Selection tier/role | Bull rank (of 296) | Bear rank (of 296) | Recent structural support | Distance to live support | vs MA5 / MA20 | Slow context |
|---|---|---|---|---|---|---|---|---|
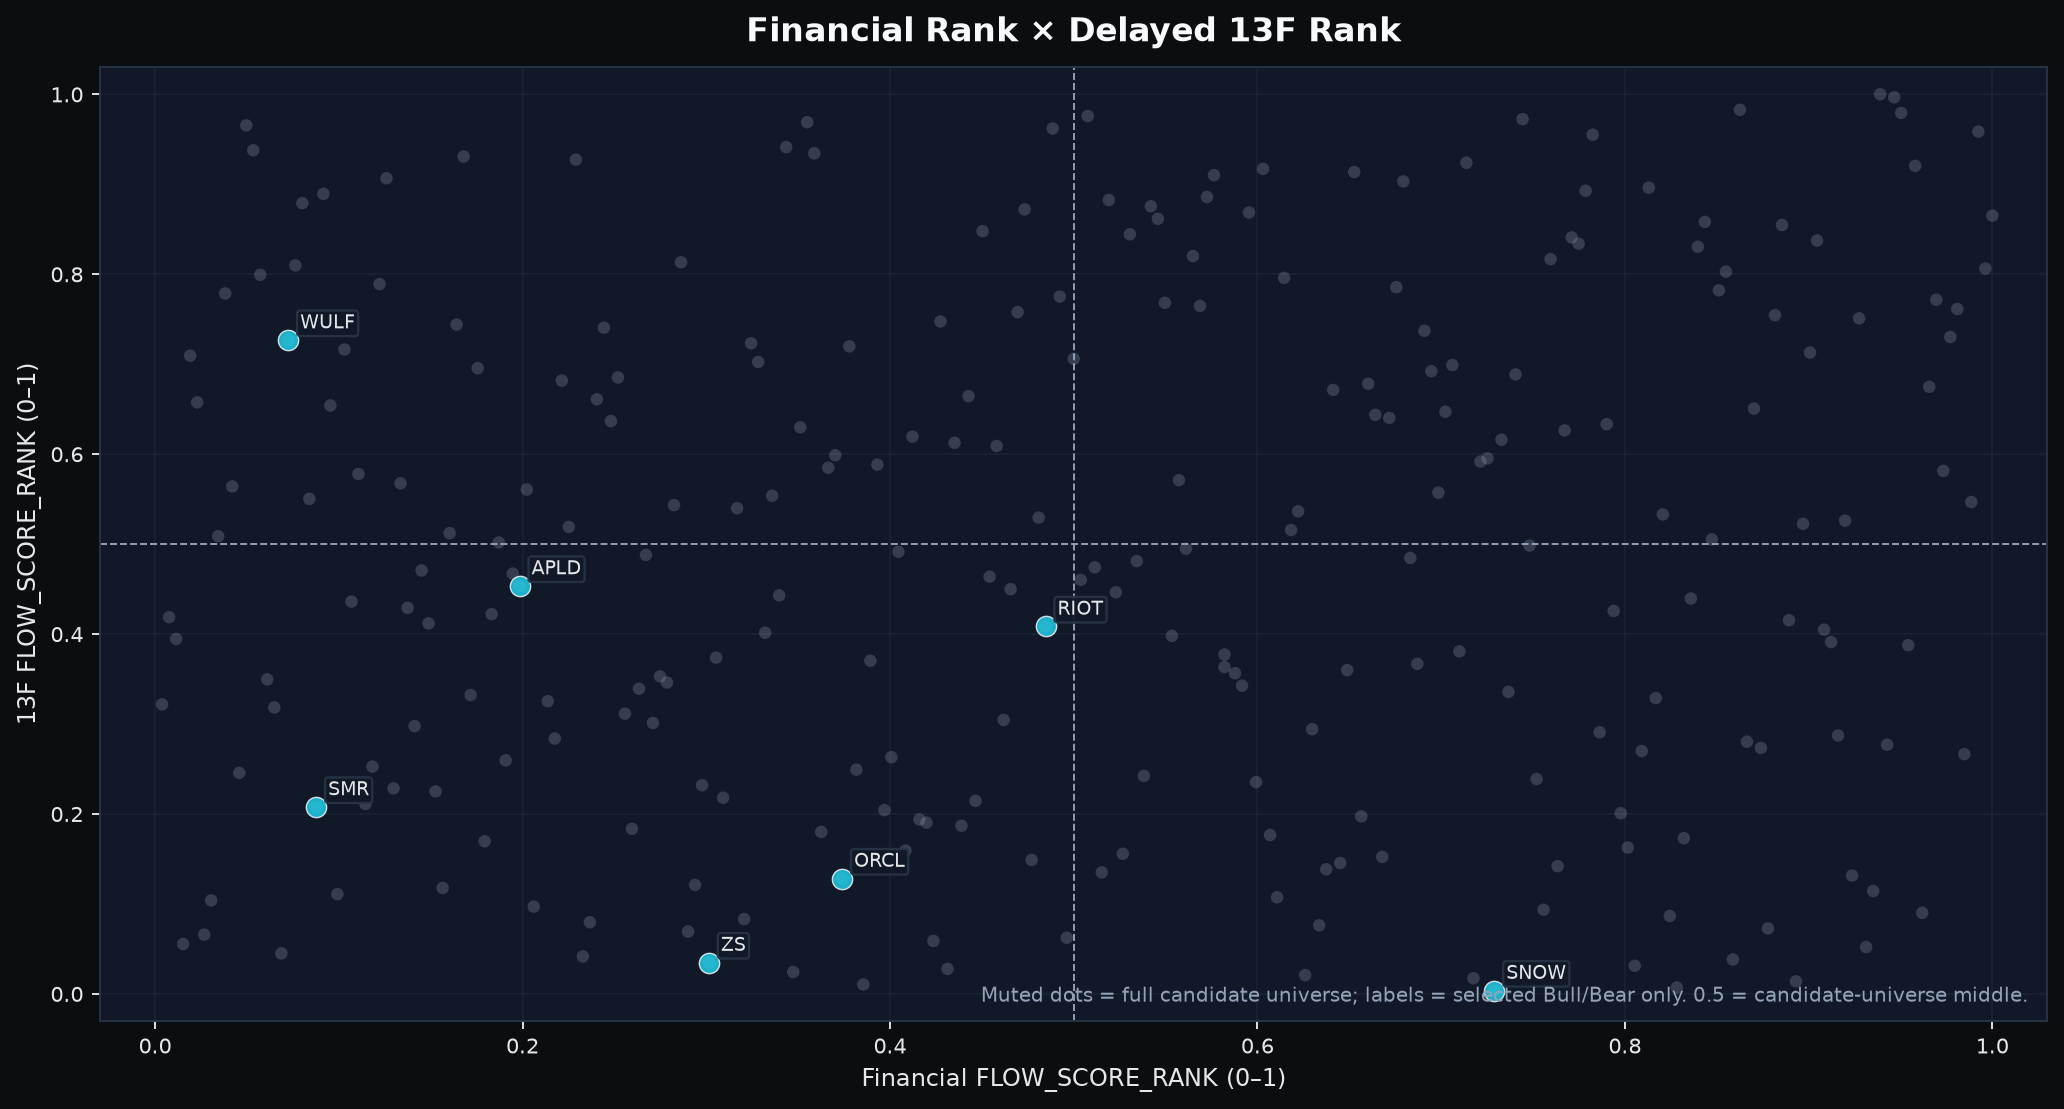
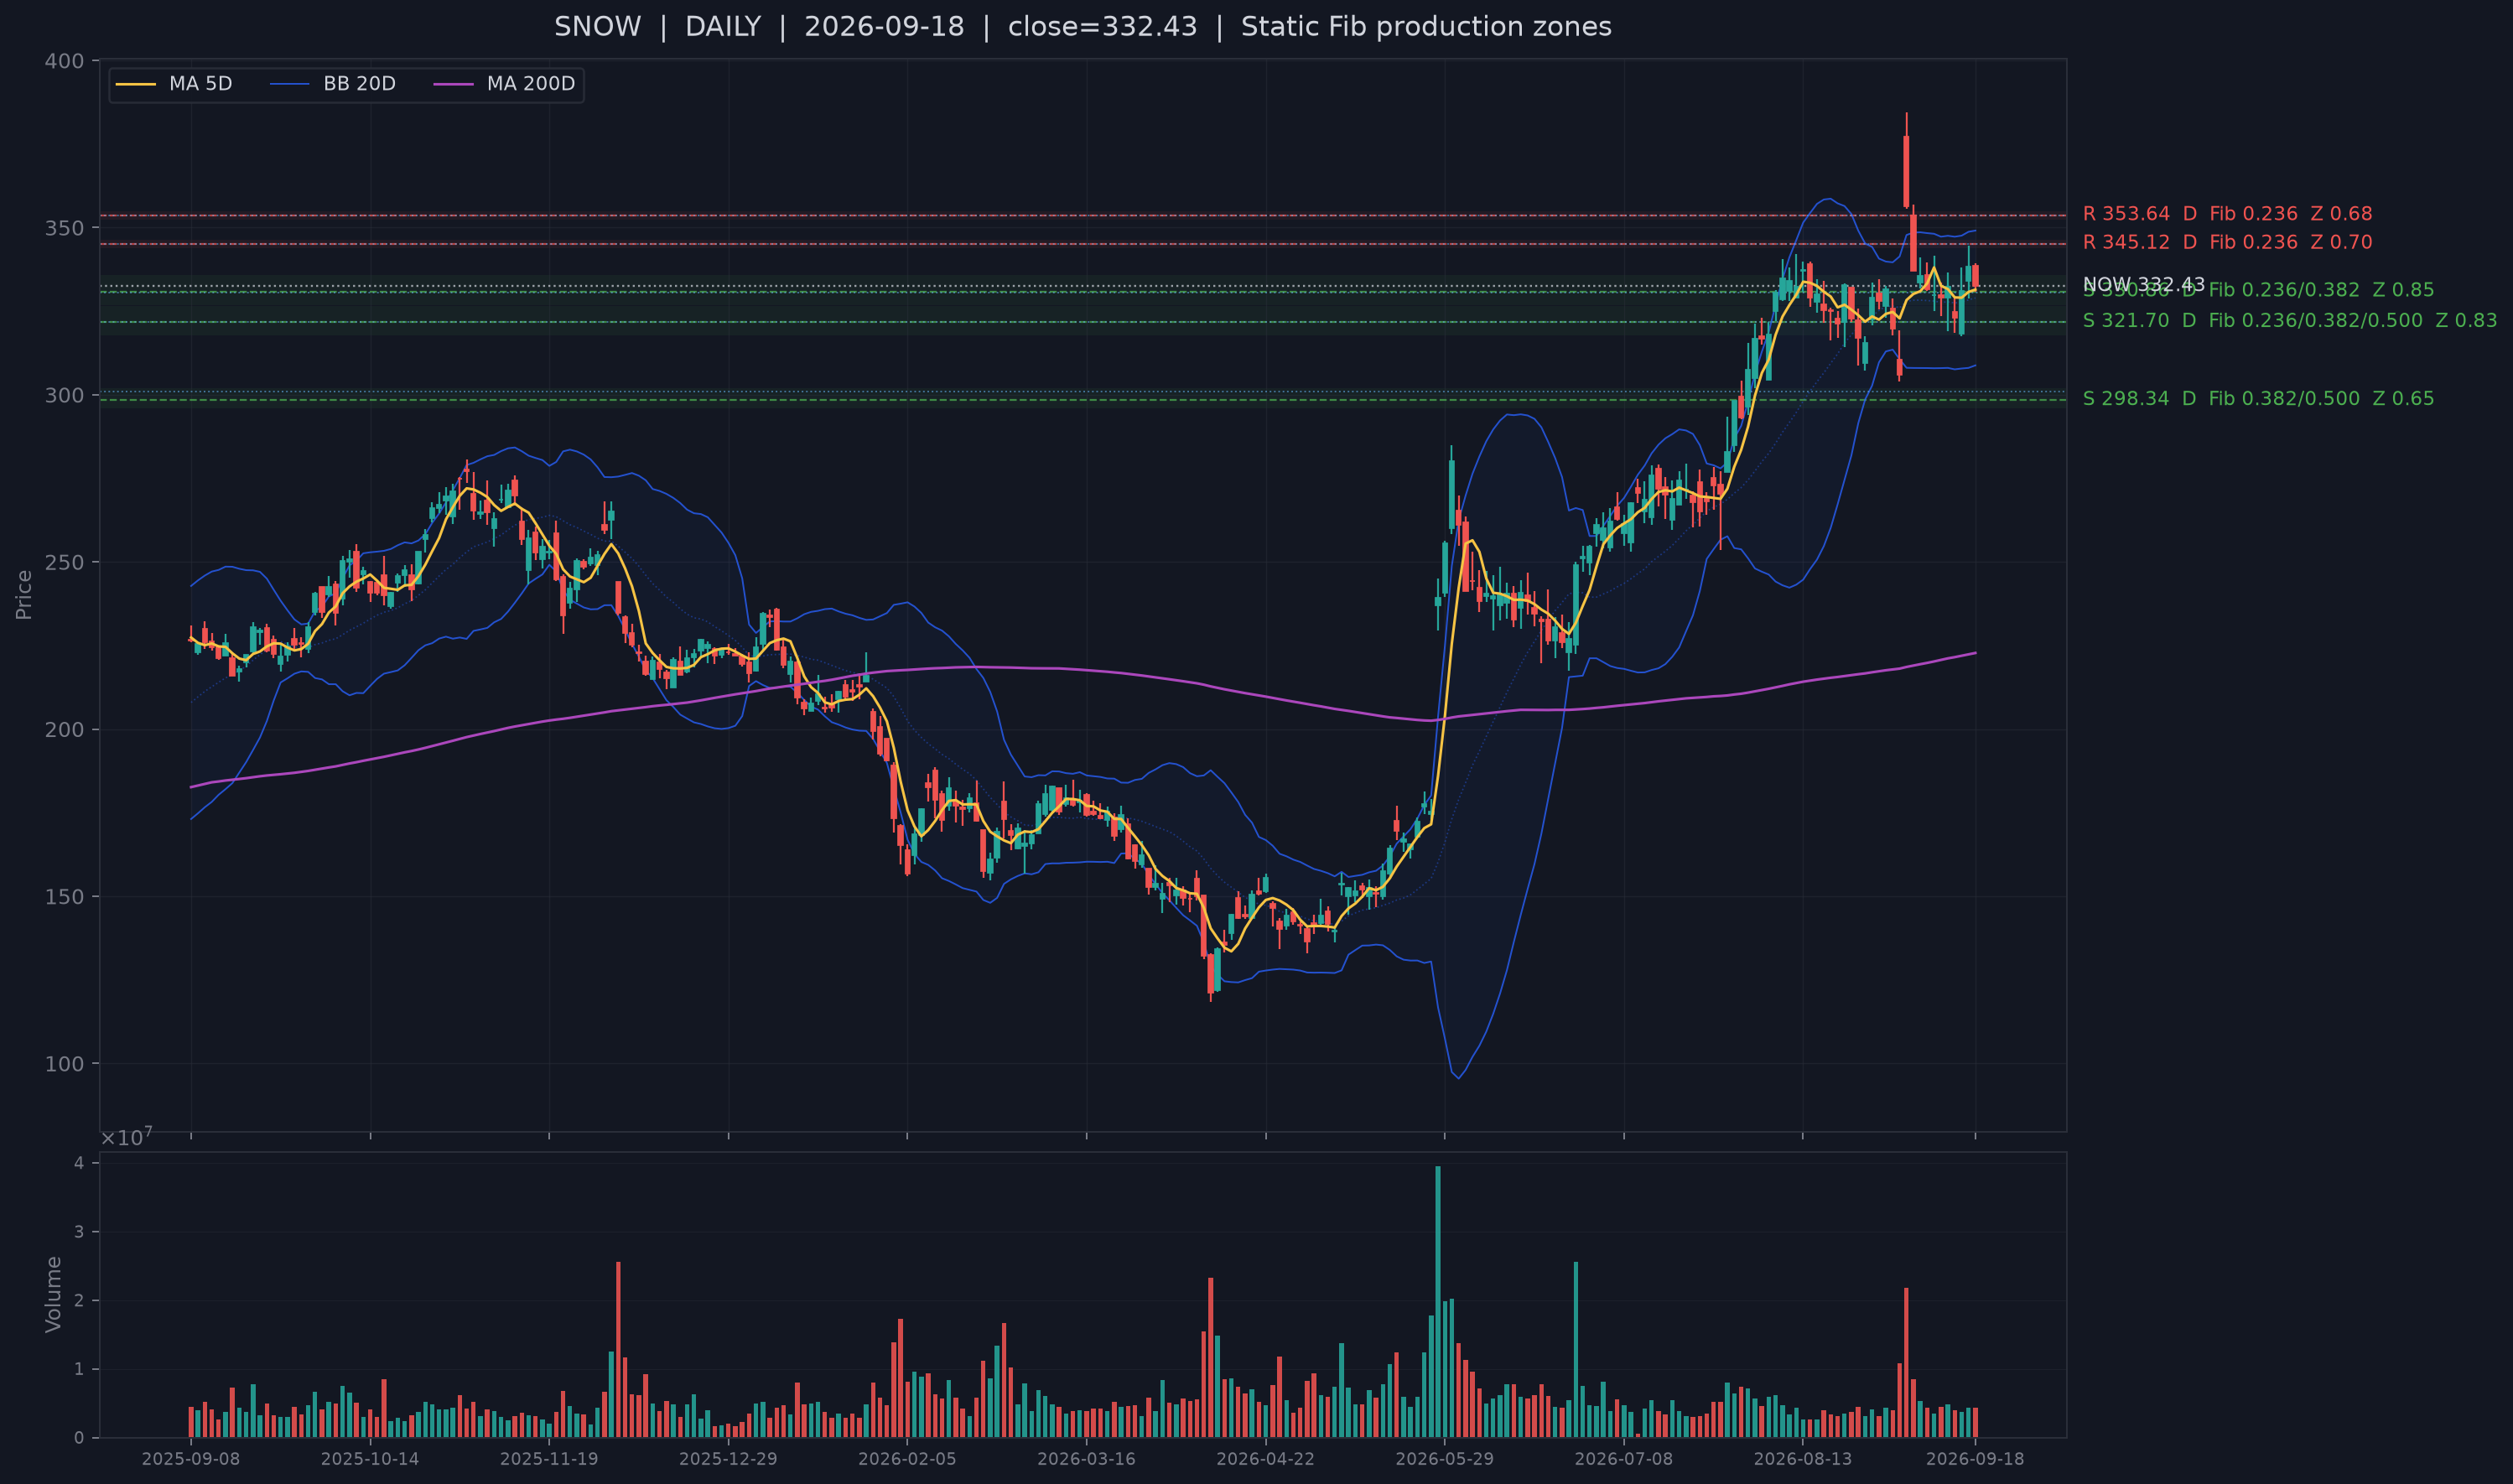
| SNOW | Enterprise Software & IT Services | B Bull screen | #17 | #146 | same-day center reclaim; 1 TD ago | 0.48% / 0.10 ATR | +0.3% / +1.1% | Financial 0.73 / delayed 13F 0.00 |
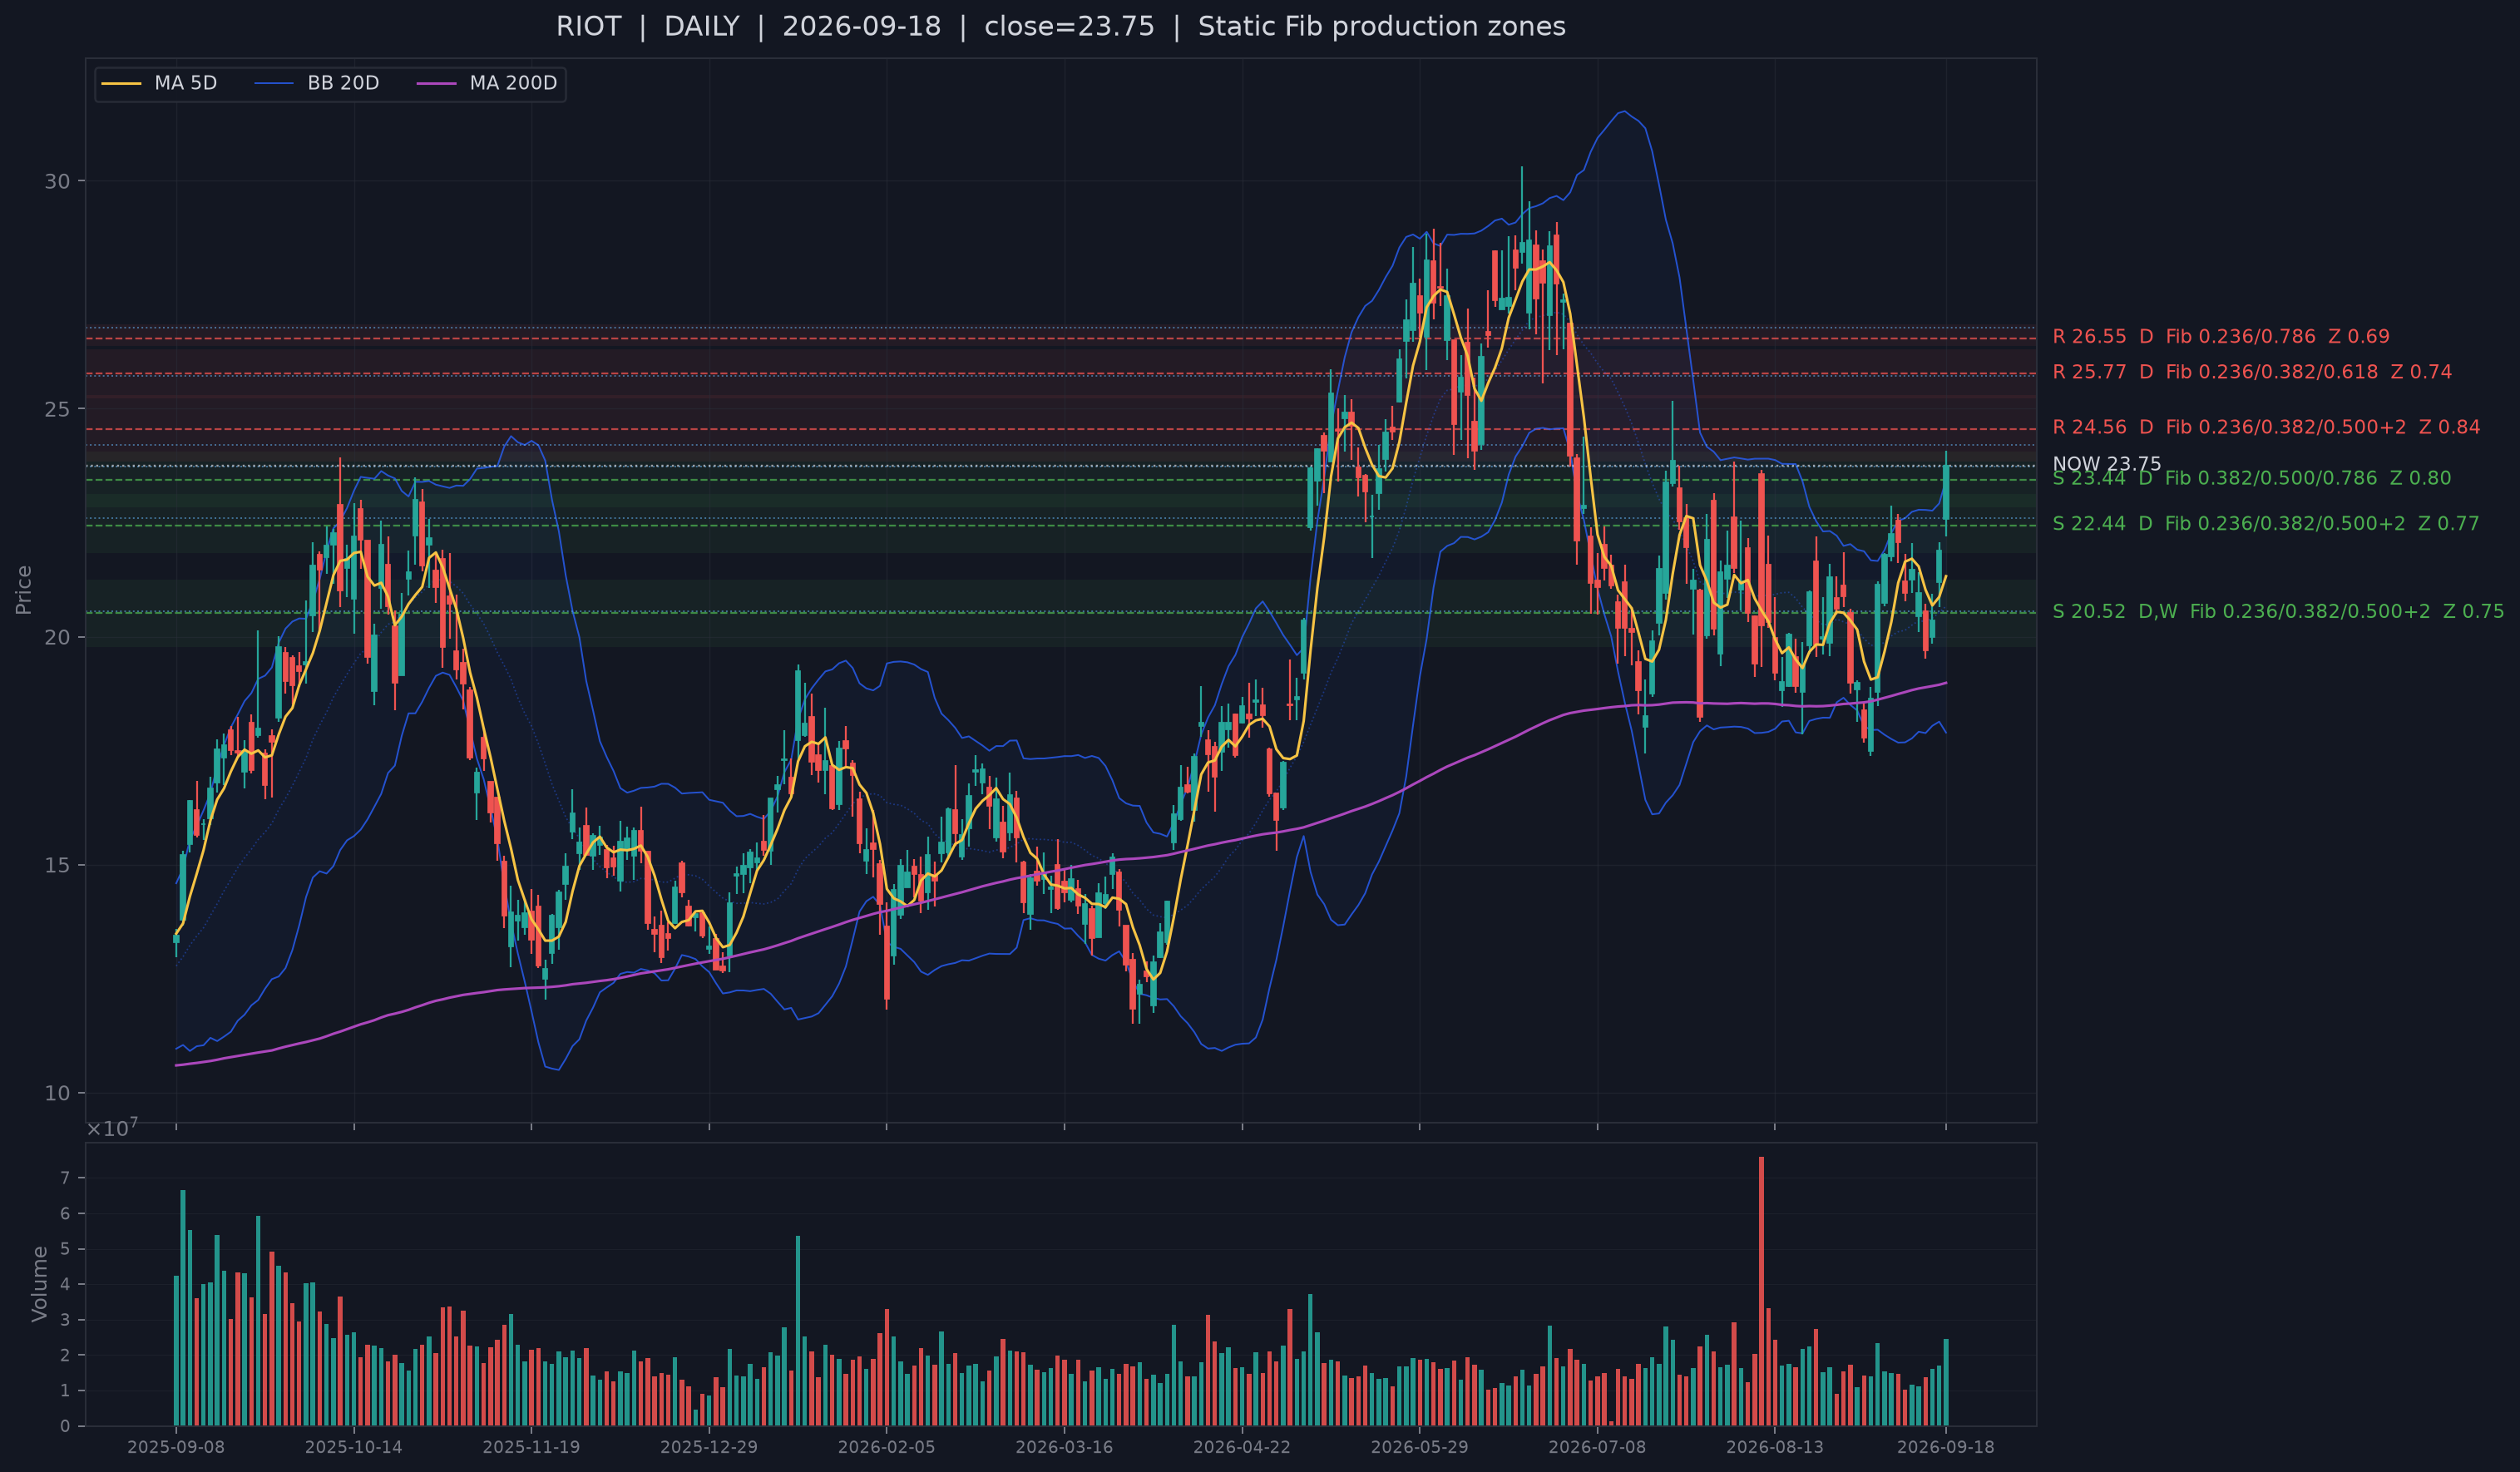
| RIOT | Asset Management & Capital Markets | A+ Bull screen | #15 | #48 | same-day center reclaim; 1 TD ago | 1.32% / 0.19 ATR | +11.4% / +14.9% | Financial 0.48 / delayed 13F 0.41 |
| ORCL | Enterprise Software & IT Services | B Bull screen | #25 | #128 | same-day center reclaim; 1 TD ago | 1.08% / 0.21 ATR | +1.6% / -1.2% | Financial 0.37 / delayed 13F 0.13 |
| CRWV | Enterprise Software & IT Services | B Bull screen | #18 | #73 | same-day center reclaim; 0 TD ago | 1.72% / 0.24 ATR | -0.4% / -5.6% | slow context unavailable |
| APLD | Enterprise Software & IT Services | B Bull screen | #21 | #44 | same-day center reclaim; 1 TD ago | 2.17% / 0.32 ATR | +10.8% / +7.3% | Financial 0.20 / delayed 13F 0.45 |
| WULF | Asset Management & Capital Markets | A+ Bull screen | #8 | #66 | same-day center reclaim; 0 TD ago | 3.62% / 0.48 ATR | +7.9% / +6.5% | Financial 0.07 / delayed 13F 0.73 |
| ZS | Enterprise Software & IT Services | A Bull screen | #9 | #33 | same-day center reclaim; 1 TD ago | 2.51% / 0.50 ATR | +1.5% / +10.1% | Financial 0.30 / delayed 13F 0.03 |
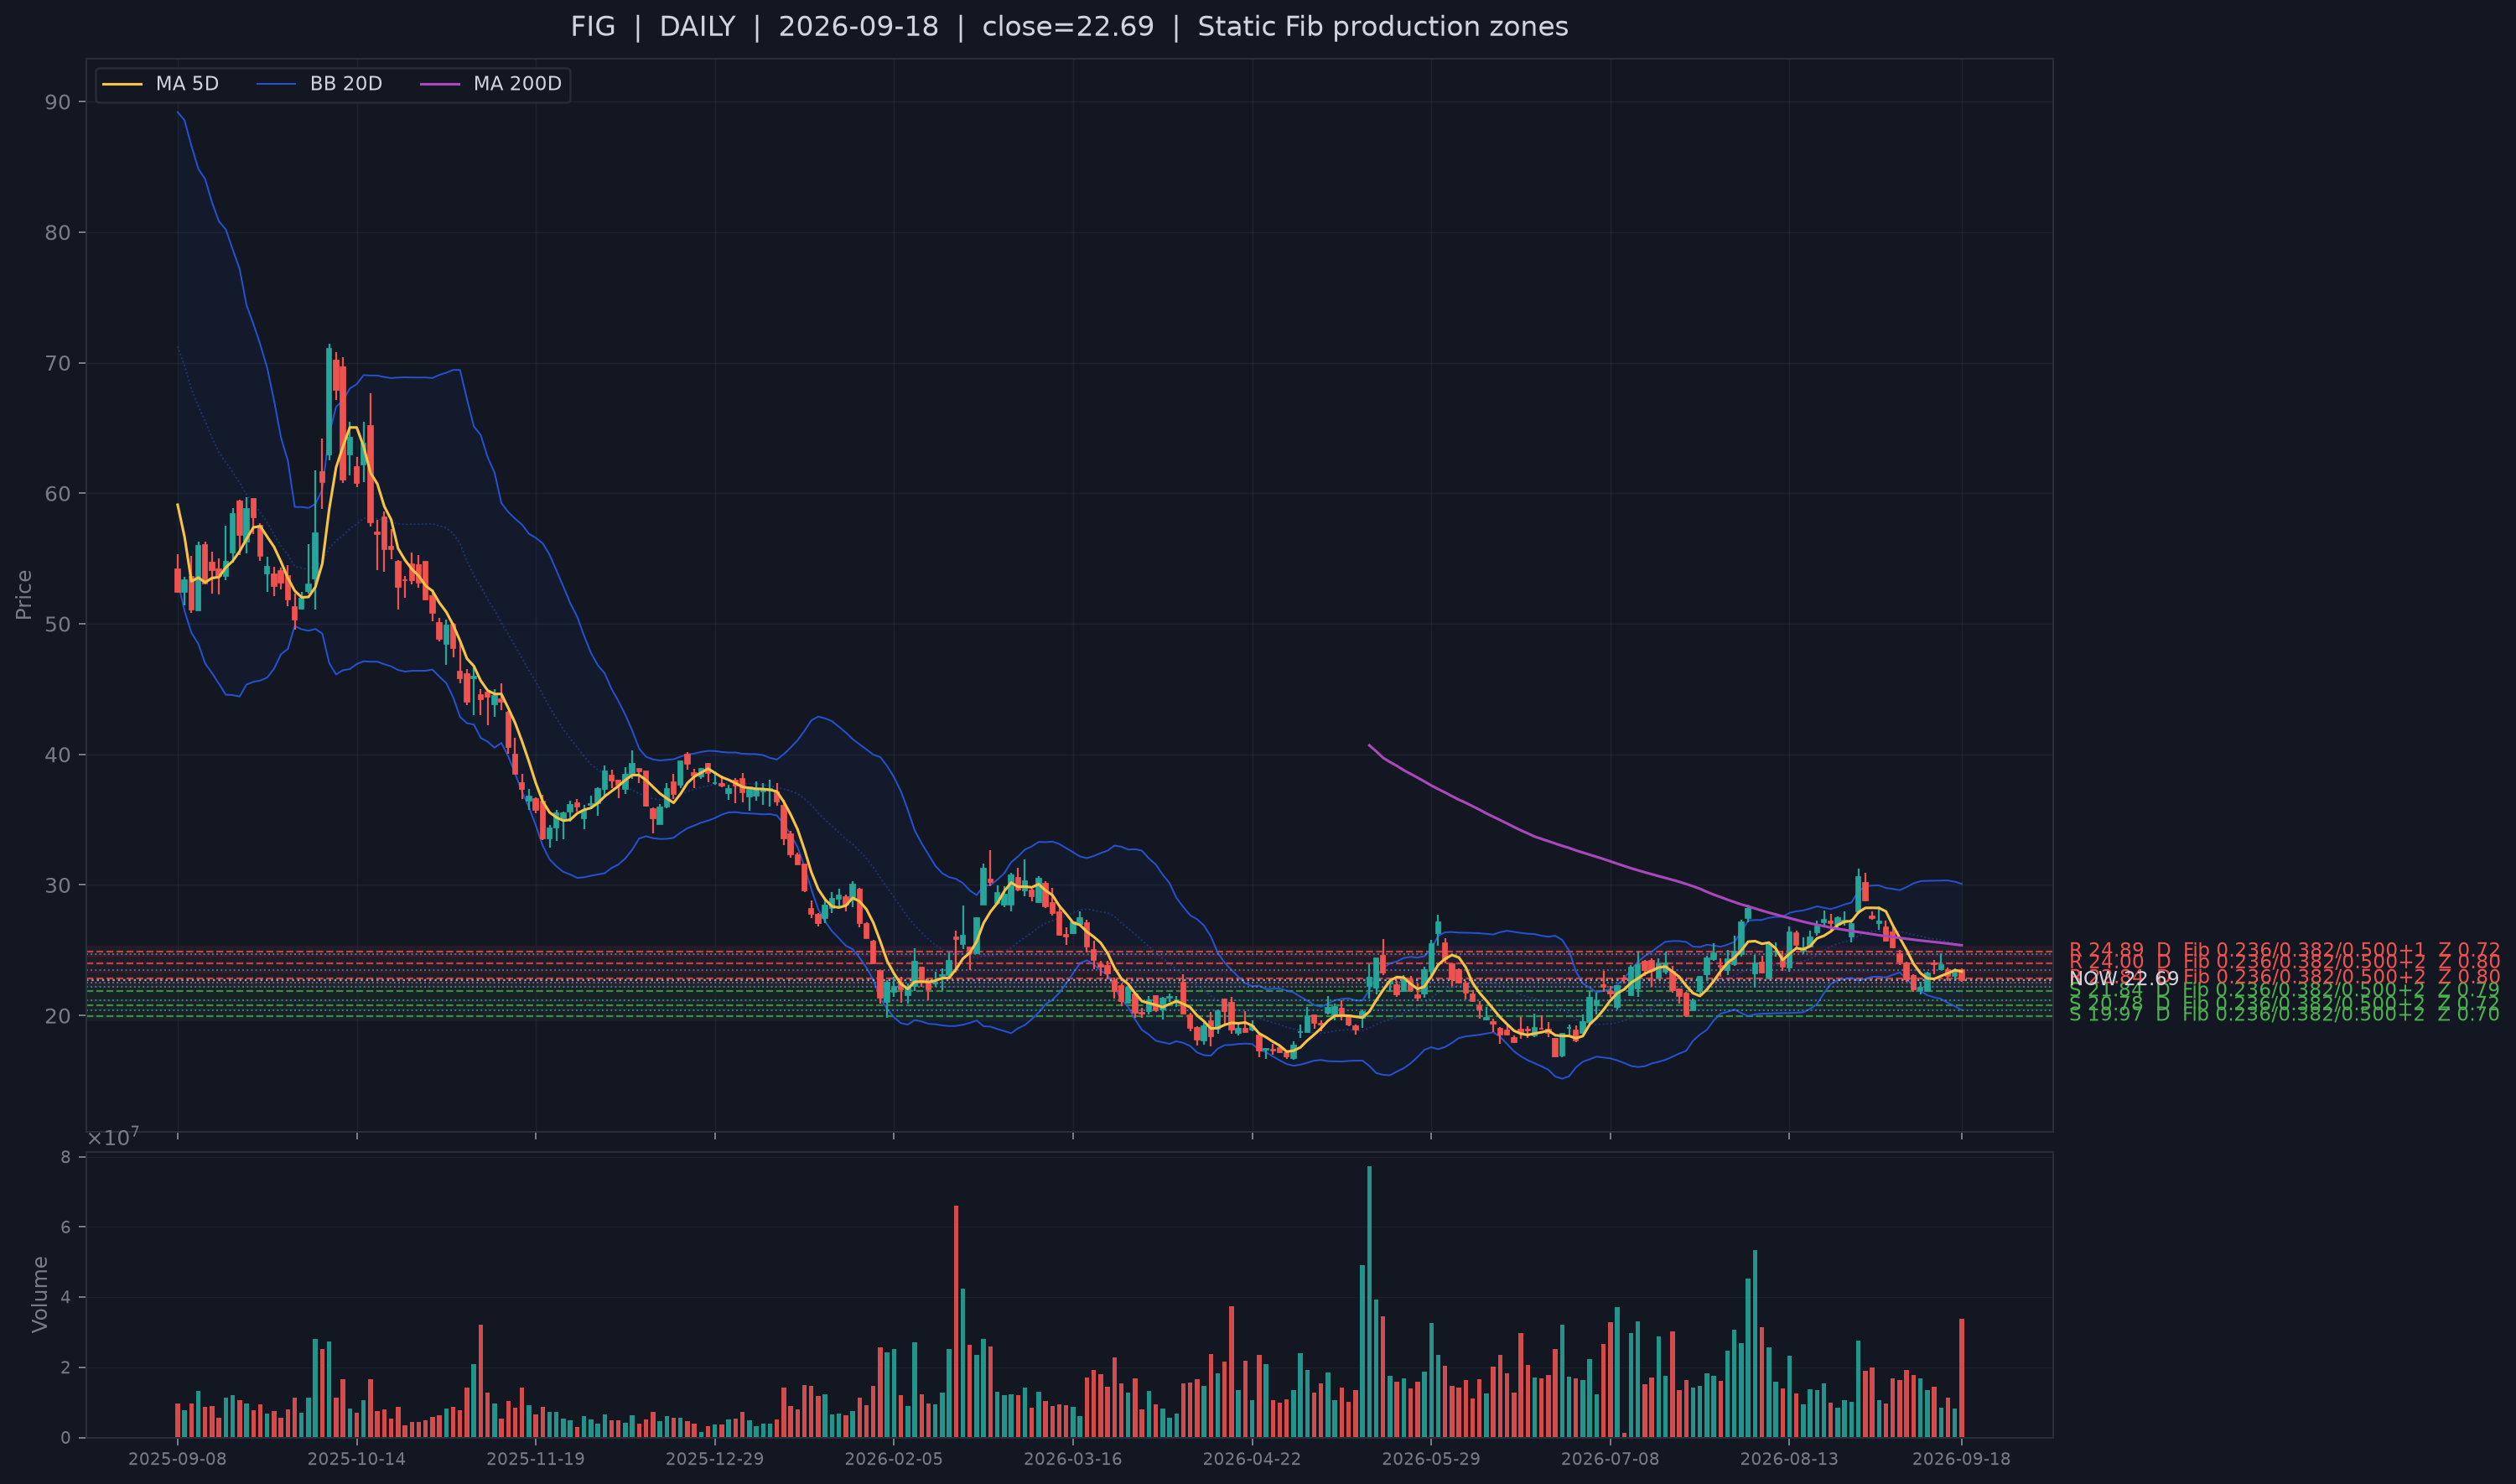
| FIG | Enterprise Software & IT Services | B Bull screen | #28 | #117 | bearish wick, next-day center reclaim; 1 TD ago | 3.87% / 0.56 ATR | -2.9% / -10.1% | 13F 0.38; financial n/a |
| CRCL | Asset Management & Capital Markets | A Bull screen | #13 | #34 | same-day center reclaim; 0 TD ago | 4.85% / 0.61 ATR | +4.0% / +0.4% | slow context unavailable |
| SMR | Industrial Machinery, Automation & Instruments | A Bull screen | #3 | #43 | same-day center reclaim; 3 TD ago | 6.00% / 0.63 ATR | -2.8% / -11.7% | Financial 0.09 / delayed 13F 0.21 |
Slow-context disagreements are information, not overrides
The slow layers are most useful where they disagree. SNOW is the sharpest example: its financial-context rank is 0.73, but delayed institutional-holdings context is only 0.003. WULF points the opposite way, with a weak Financial rank of 0.07 and a much stronger delayed-holdings rank of 0.73. ZS is weak in both slower ranks (0.30 / 0.03) despite being 10.1% above MA20. RIOT is closer to the middle in both layers. None of those slow observations changes the support-based order; they simply show where current price/support evidence is or is not corroborated by slower information.
The first stock contrast is enterprise data/AI demand with very different trend quality. SNOW is #1 in the support order and only 0.10 ATR from its current support center, while sitting modestly above MA20. Its September quarter showed 37% product-revenue growth. ORCL is also close to support and has extraordinary public cloud-infrastructure growth, but remains 1.2% below MA20. CRWV confirmed support on September 18 itself, yet is still 5.6% below MA20. Those differences matter: public AI demand can explain the mechanism, but it cannot upgrade incomplete price repair into completed trend confirmation.
The second contrast is power-rich digital infrastructure. RIOT and WULF are both above MA20 by 14.9% and 6.5% respectively, while remaining within the current support-distance limit because their live structural zones have moved higher. Riot’s long-duration AI leases and TeraWulf’s Anthropic contract make the compute/power mechanism concrete. APLD is adjacent to the same theme through 1.41 GW of contracted critical IT load across its lease portfolio, but its slower financial context is weaker. CRCL adds financial-market infrastructure rather than physical data-center capacity; the September 16 Arc launch is a fresh company-specific catalyst, not a reason to rerank it above the upstream support order.
The third contrast is support confirmation without trend repair. FIG passed a bearish-wick / next-day center-reclaim pattern, yet remains 10.1% below MA20. Its public Q2 results showed 48% revenue growth and broad AI feature adoption, so the business narrative is not the missing ingredient. Price transmission is. SMR is similar at the opposite end of the support list: recent support is still valid, but price is 11.7% below MA20 and its slow context is weak. These names are useful controls because they prevent the support framework from being mistaken for a generic momentum screen.
Across all ten names, the evidence hierarchy is unchanged: recent structural support and current proximity come first; MA geometry shows whether that support has transmitted into trend; slow financial and delayed holdings context can confirm or challenge; public facts explain economic mechanisms. A strong public story, a strong 13F rank, or a strong financial rank cannot rescue a broken support state, and none can change the final stock order.
6. What would change the 3-10 day thesis
Base case - moderate confidence: Nasdaq-led price resilience can continue through a selective enterprise-AI, digital-infrastructure and power theme, but the market is less forgiving than the headline indices suggest. Breadth is weak, new-low damage is rising, and the final hour left all three order-flow axes below neutral. The selected stock set is therefore a conditional support thesis, not a broad market endorsement.
Constructive confirmation: the next session should reclaim 50 early in Aggressor Flow, Depth Pressure and Alignment and keep that reclaim beyond the opening impulse. Breadth should move toward balance, new-low damage should stabilize rather than accelerate, and the S&P should regain MA20 while Nasdaq holds its stronger geometry. At the stock level, current support zones should hold and the weaker trend cases - especially CRWV, FIG and SMR - should begin closing their MA20 gaps.
Strongest counterevidence: the top three Bull sectors are all two-sided, the Fed has tightened into elevated inflation, Treasury yields and oil remain high, CFTC positioning does not confirm the newest cross-asset rotation, and new-low damage is already rising. The thesis becomes materially weaker if those macro/market stresses meet expanding large-decline breadth and cross-sectional volatility.
Bearish falsifier: another close with all three order-flow axes below neutral, accompanied by further 20-day/252-day new-low expansion, a sharp rise in the share of stocks down 3% or more, higher cross-sectional volatility and a loss of current structural support across the selected set. That combination would turn today’s narrow resilience into evidence of propagation rather than selection.
What not to infer: the current evidence does not identify institutional accumulation/distribution, buyer or seller exhaustion, or observed sector-to-sector dollar flows. Cross-asset R and sector ranks are price-implied relative states. Delayed 13F and weekly CFTC data are not same-day activity.
Sources
- Federal Reserve Board - Federal Reserve issues FOMC statement (2026-09-16).
- Reuters - S&P 500, Nasdaq advance, turning the page on a tumultuous week (2026-09-18).
- Snowflake / SEC exhibit - Snowflake Reports Financial Results for the Second Quarter of Fiscal 2027 (2026-09-02).
- Oracle - Oracle Announces Q1 Results Driven by Triple Digit Growth in Cloud Infrastructure Revenues (2026-09-10).
- Zscaler - Zscaler investor relations - Fiscal Q4 2026 results (2026-09-03).
- Figma - Figma Announces Second Quarter 2026 Financial Results (2026-08-05).
- Circle - Circle Launches Arc Mainnet, an Economic Operating System for the Internet (2026-09-16).
- Riot Platforms - Riot Platforms Reports Second Quarter 2026 Financial Results and Strategic Highlights (2026-08-10).
- TeraWulf - TeraWulf Reports Second Quarter 2026 Results (2026-08-05).
- NuScale Power - NuScale Power Reports Second Quarter 2026 Results (2026-08-05).
- Applied Digital - Applied Digital Signs 210 MW Lease at Delta Forge 2 (2026-06-08).
Methodology note
Market Layers is an independent quantitative research publication focused on the U.S. equity market. The process is data first and narrative second: quantitative observations define the research questions, and public company/government reporting is used to test mechanisms and counterevidence. The upside/downside models are independent ranking screens rather than literal probabilities. The selected stock set is narrowed by recent structural support confirmation; price geometry, financial statements, delayed institutional-holdings filings and public catalysts remain confirmation or counterevidence and do not override the systematic order. This research is designed for 3-10 trading-day swing setups; the signals and conclusions may not transfer to intraday trading or longer-horizon investing. This material is for informational and research purposes only and does not constitute investment advice.