Late-Day Order Flow Broke Below Neutral as AI Infrastructure Support Stayed Selective
Index price held better than breadth, but all three market-wide order-flow axes closed below neutral after late deterioration. Support-confirmed leadership stayed concentrated in AI connectivity, power, cooling, grid and compute infrastructure rather than broad risk-on participation.
This research is designed for 3-10 trading-day swing setups. The signals and conclusions may not transfer to intraday trading or longer-horizon investing.
Key takeaway
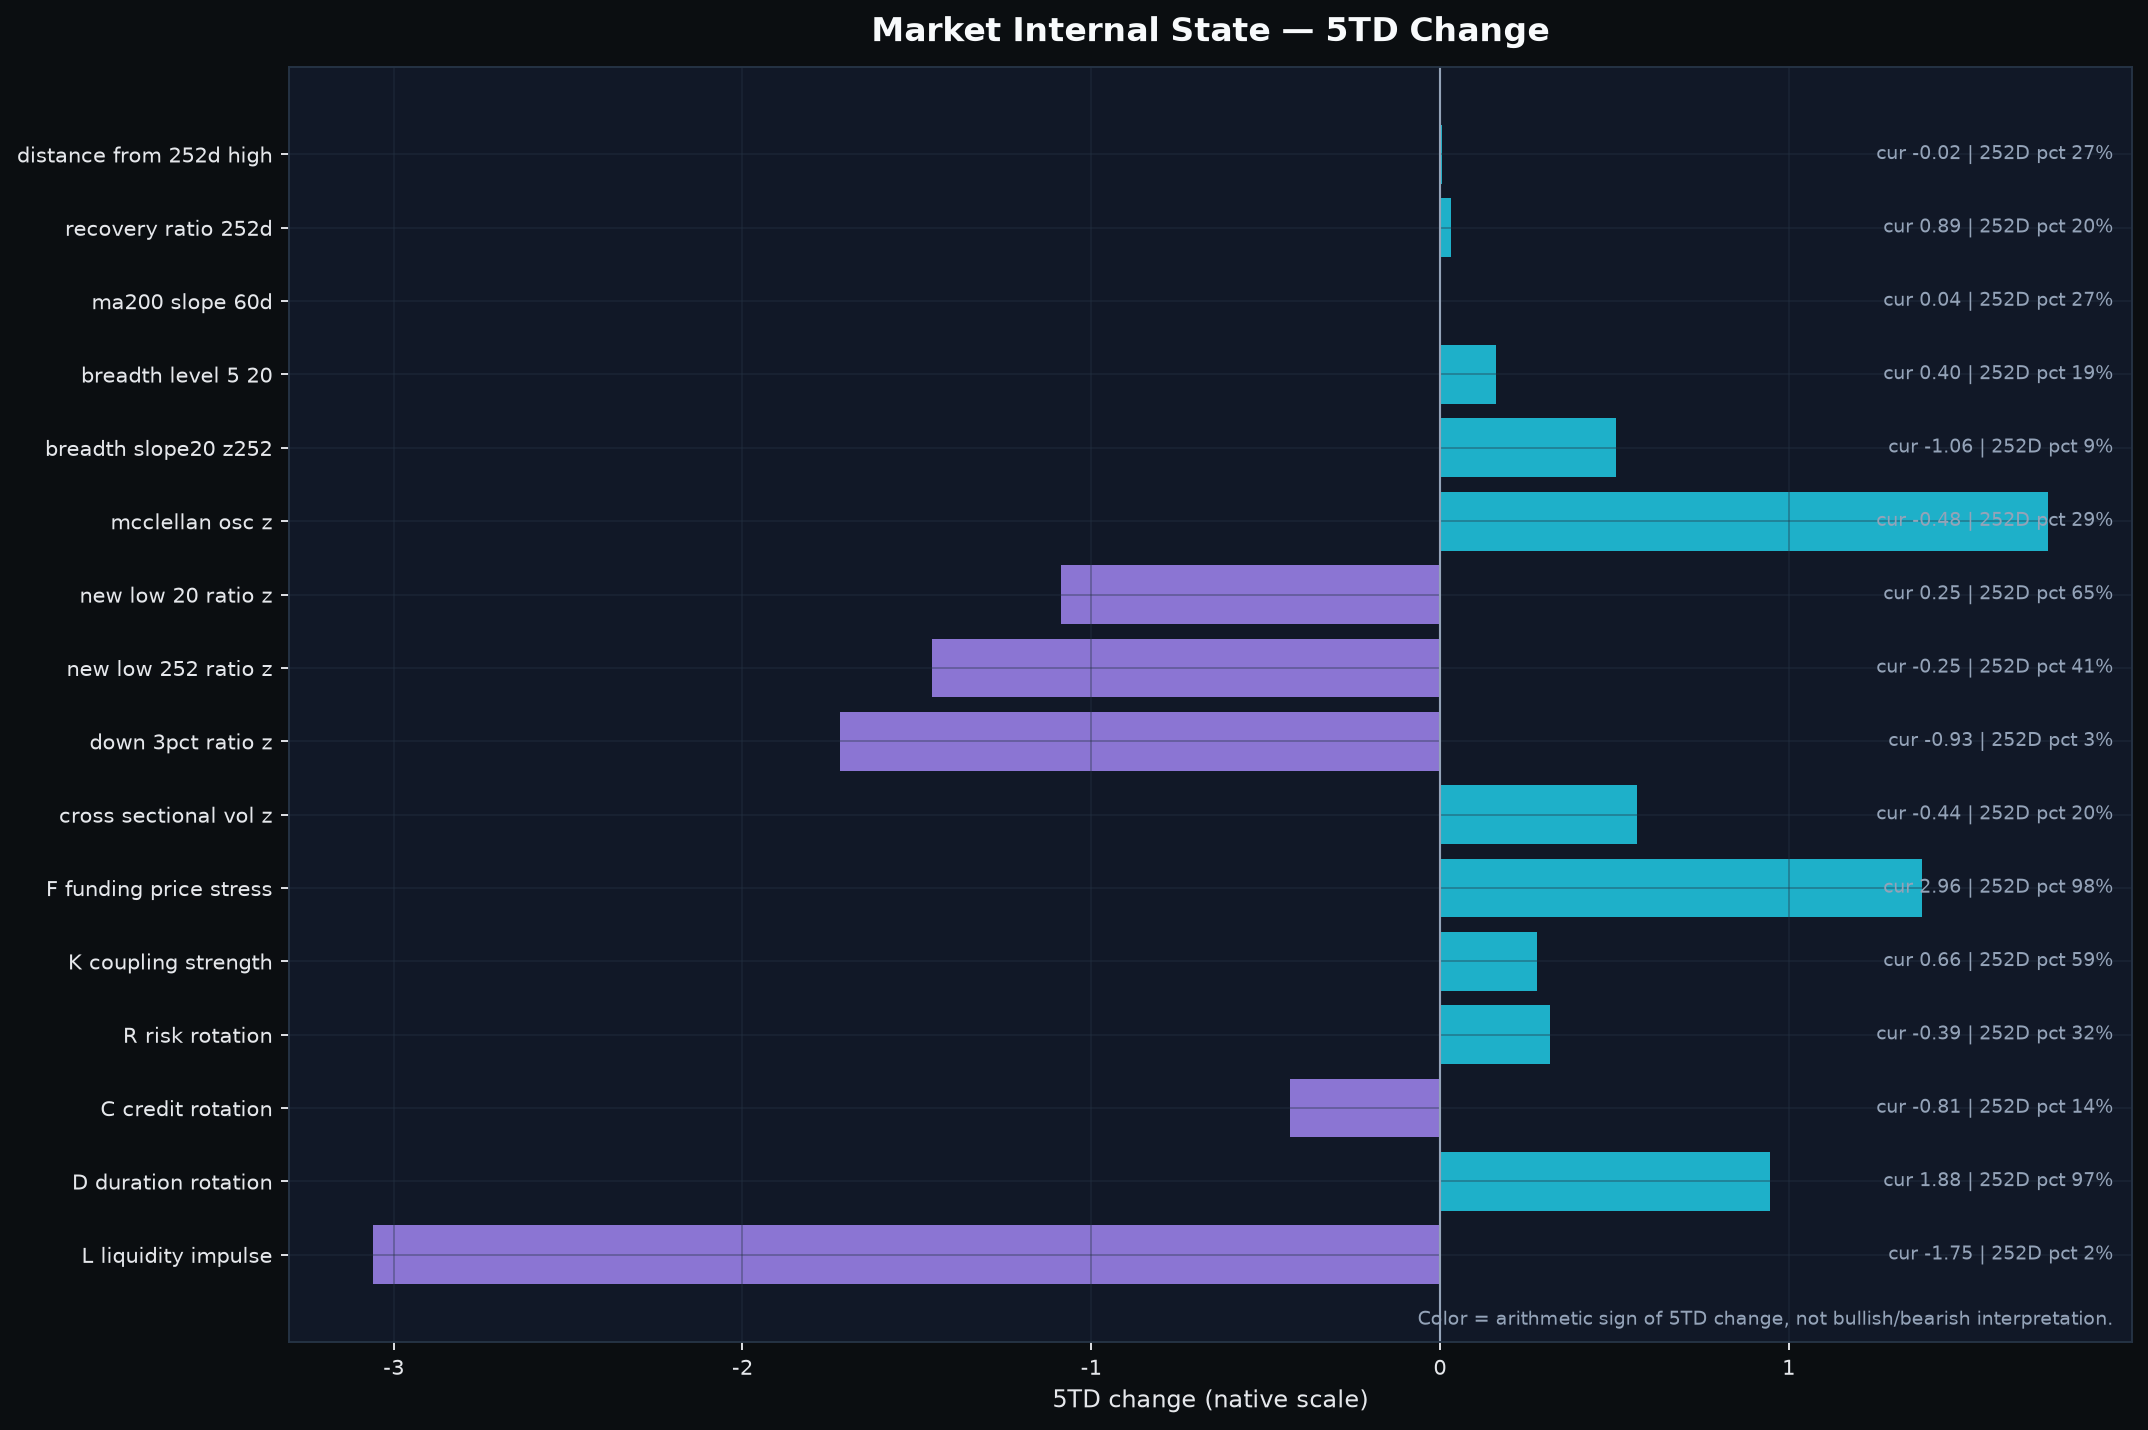
Index price held up better than the market's internal state, and that gap is now the main decision problem. The S&P 500 finished 0.36% above its 5-day average but 0.27% below its 20-day average, while the Nasdaq Composite finished 0.91% above its 5-day and 0.66% above its 20-day average. That looks materially better than the breadth layer: only 0.398 of the tracked universe was above its short moving-average blend, with the 20-day breadth slope at -1.06 z. The important offset is that downside damage has not spread with the weak participation. New-low and large-decline measures remain near or below their historical norms rather than behaving like a broad liquidation.
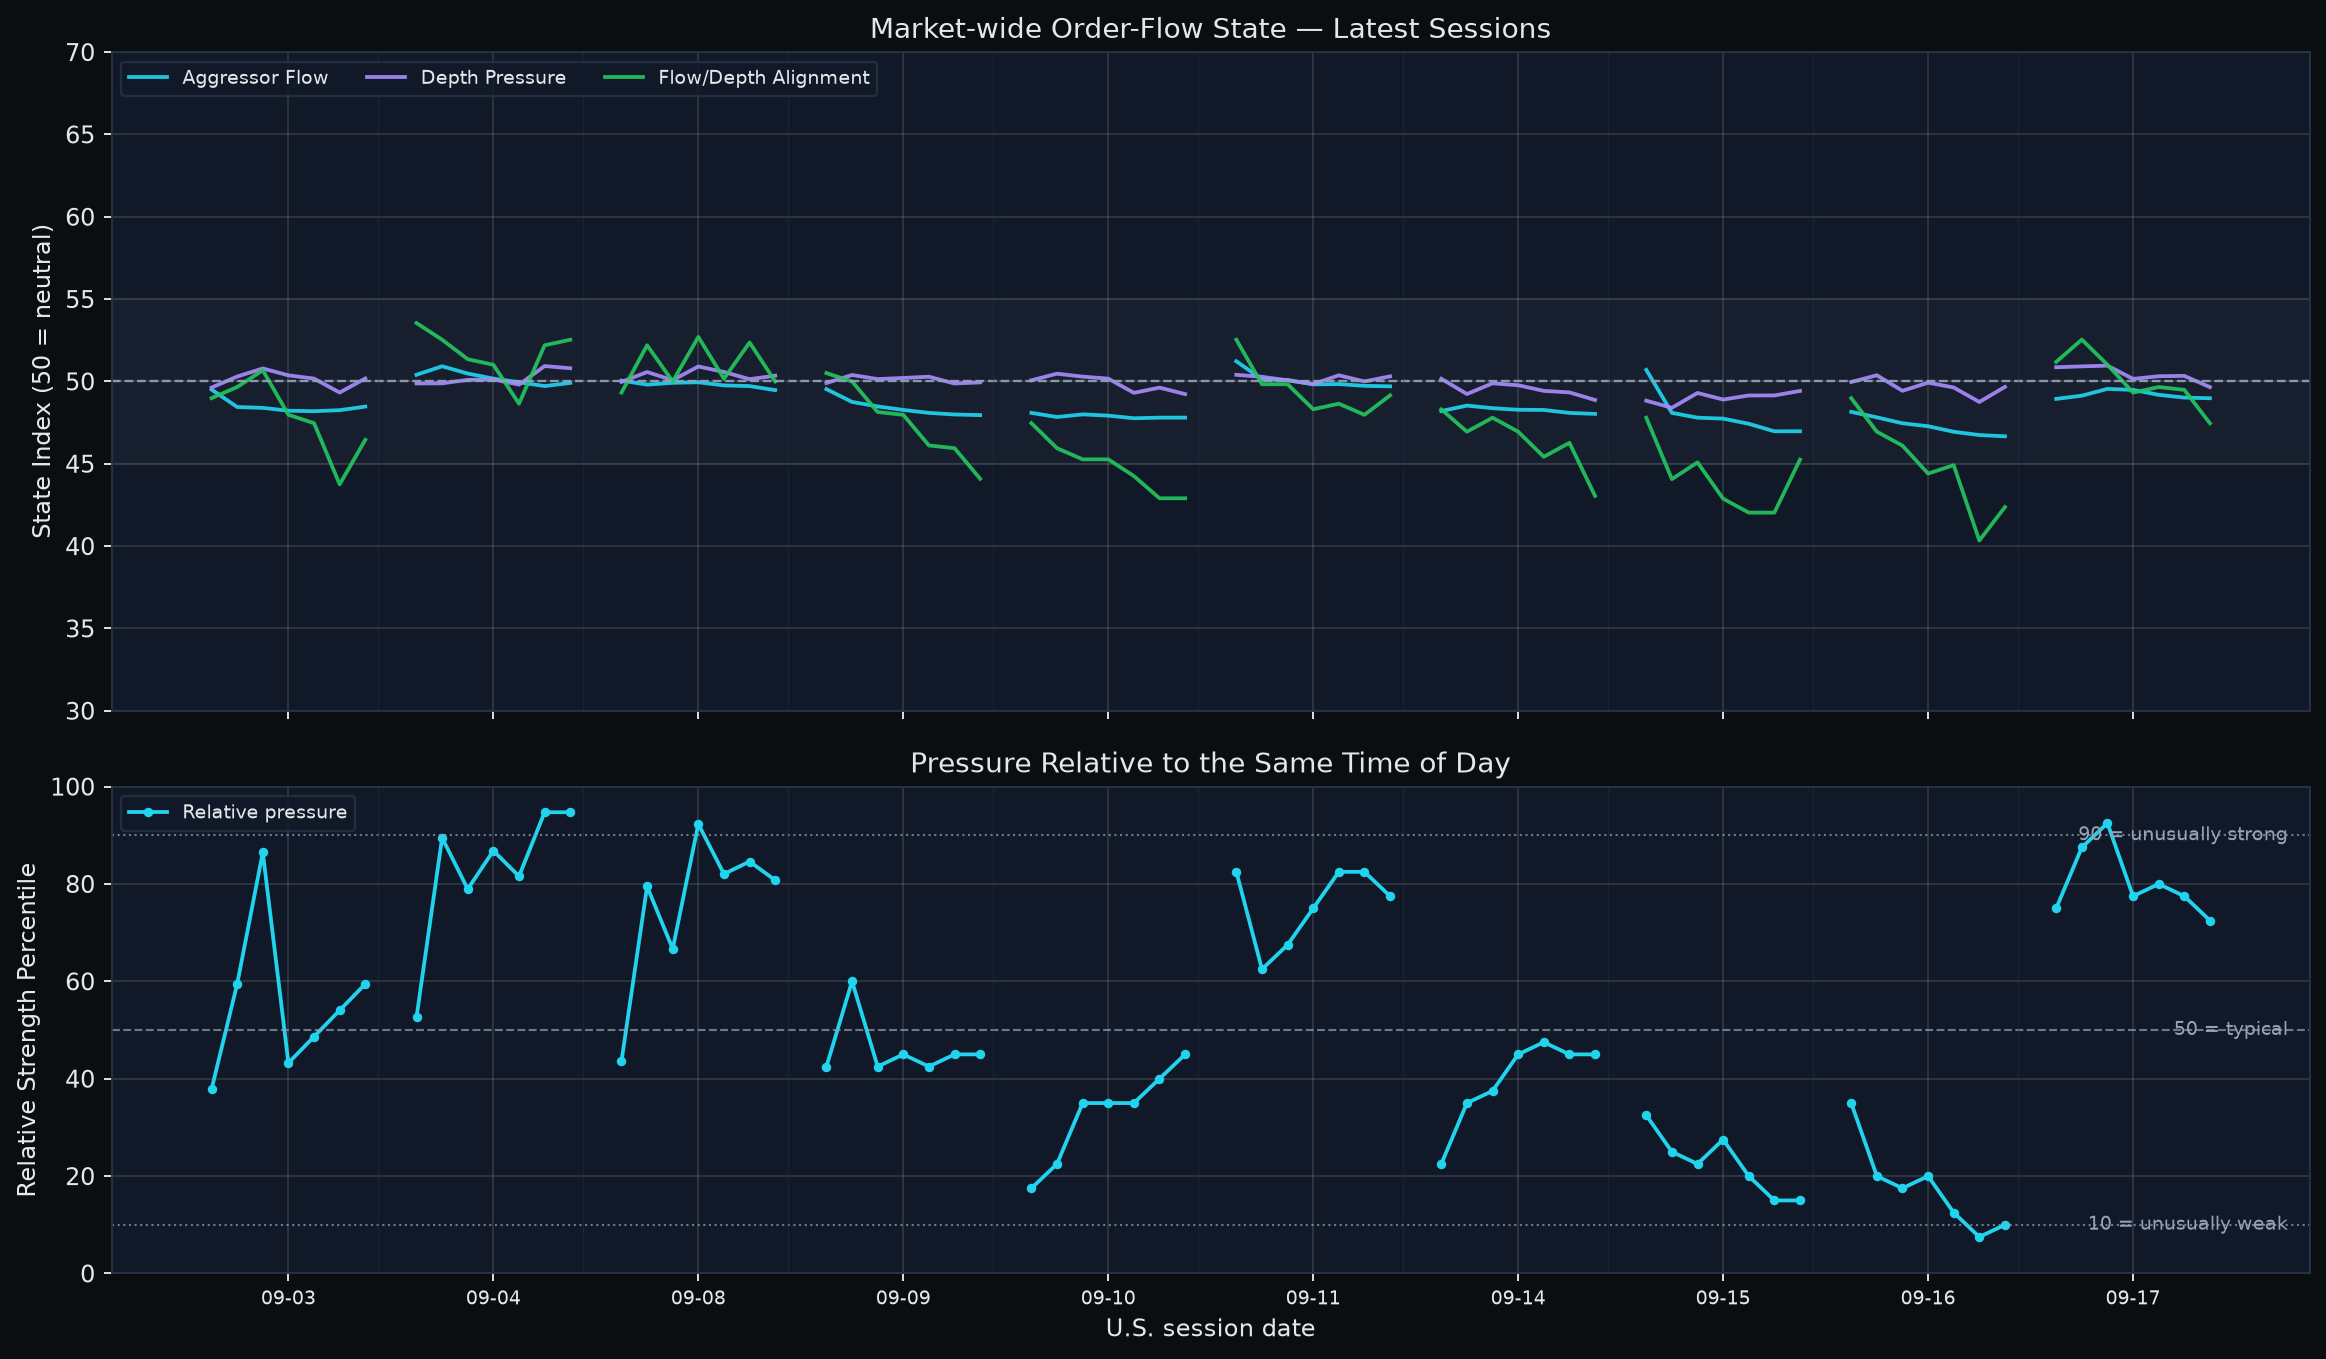
The intraday order-flow path makes the caution more concrete. Aggressor Flow never reached the 50 neutral line. Depth Pressure stayed above 50 for six of seven observations but lost neutral into the close, and Flow/Depth Alignment fell from 52.5 early to 47.5 at the close. In the final hour, Depth Pressure fell 0.68 points and Alignment fell 2.03 points; Bull-aligned breadth fell while Bear-aligned and sell-absorption-compatible breadth rose. This was late deterioration below neutral, not a repair attempt. All three axes closed below 50, so a constructive reset now requires an early and sustained reclaim rather than another short-lived opening bid.
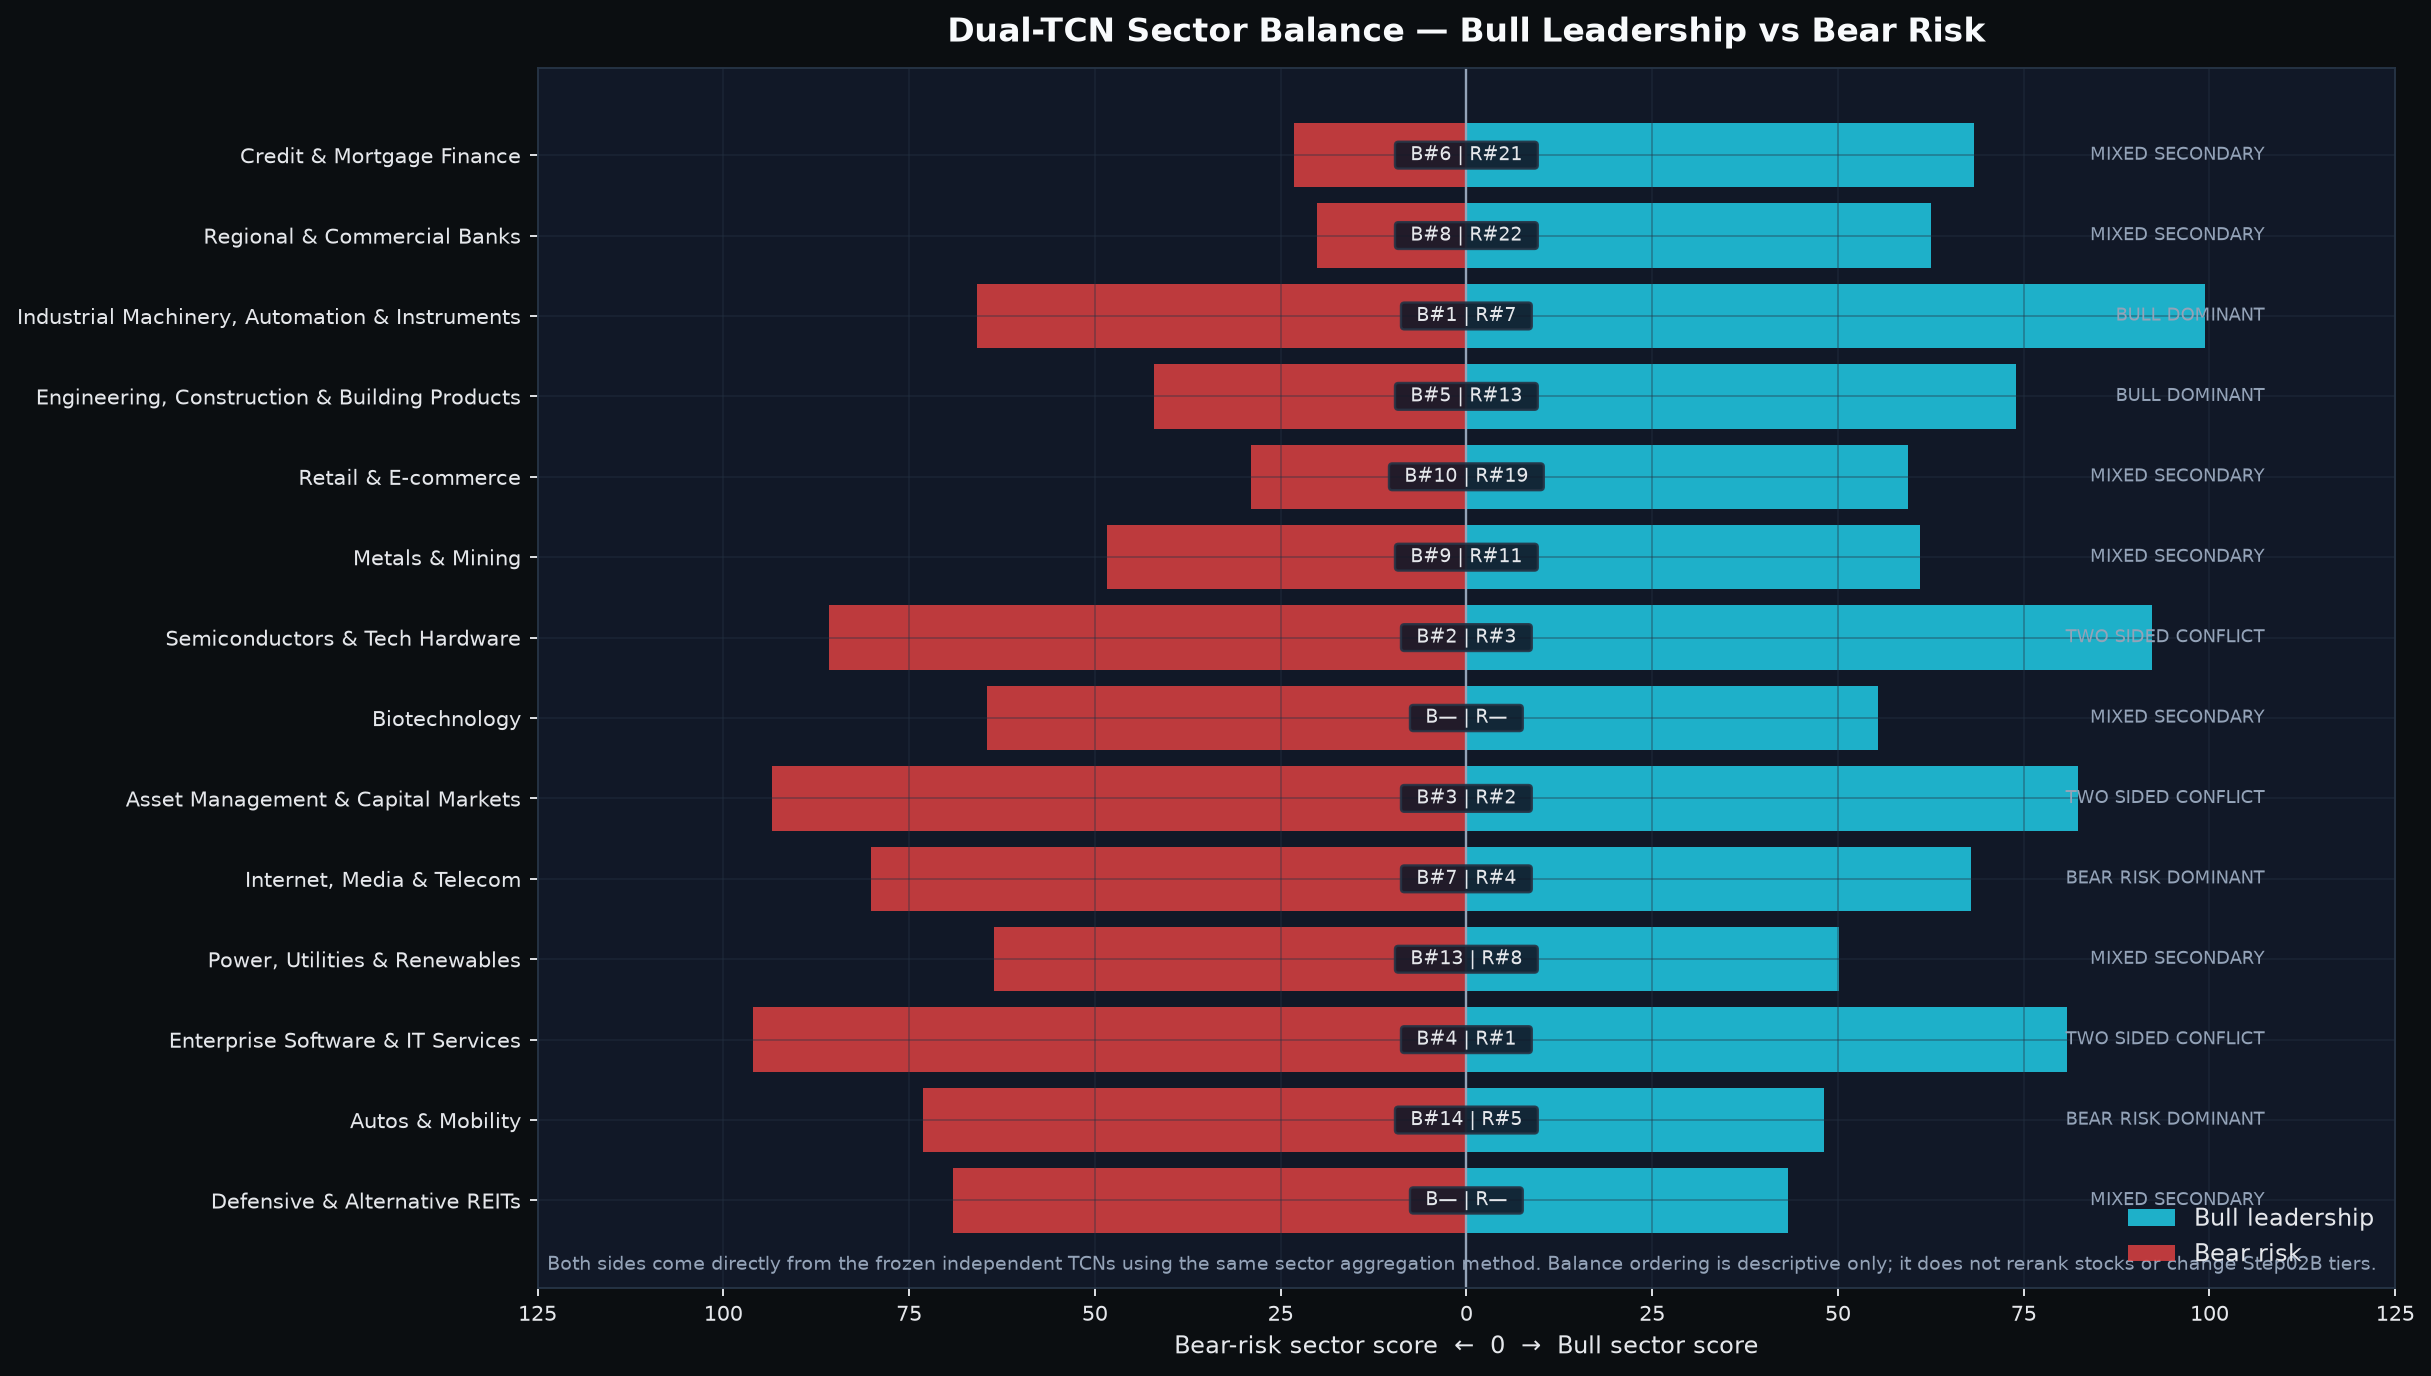
Yet the same session's equal-weight basket still gained 0.23% from open to close and broad downside damage stayed contained. That contradiction keeps the base case away from a synchronized risk-off call. Instead, leadership has become more selective and more physically tied to AI infrastructure: industrial machinery moved to Bull rank #1, semiconductors are #2, and the support-confirmed stock set clusters around optical/network connectivity, storage, data-center power/cooling, grid equipment and compute campuses. The public mechanism is real - EIA expects record U.S. electricity generation in 2026-27 with data centers and manufacturing driving demand growth - but three of the Bull Top 5 sectors are simultaneously high in Bear-risk concentration. The thesis is therefore constructive only at the selected-support level, not as a broad market endorsement.
How to read today's indicators
| Indicator | Scale / reference | Reader interpretation |
|---|---|---|
| Market-wide order-flow state | Three component indices; 50 = neutral | Aggressor Flow, Depth Pressure and Flow/Depth Alignment answer different questions. Read confirmation/divergence across the three; they are not probabilities. |
| Same-time order-flow percentile | 0-100; 50 = same-time historical median | 90 is unusually strong and 10 unusually weak for that intraday slot. Historical context, not event probability. |
| Flow x depth state breadth | Cross-sectional percentages | Bull/Bear aligned show joint direction; absorption states describe compatible divergence only, not proven actor intent. |
| Market breadth | 0-1; practical balance ~0.50 | Above 0.50 means broader participation. Direction/slope show participation improving/fading. |
| z-score | 0 = historical mean | |z| around 1 is notable and |z| around 2 unusual; standardized distance, not probability. |
| Historical percentile | 0-100; 50 = median | 90+ is historically elevated; not event probability. |
| FLOW_SCORE_RANK | 0-1; 0.50 = median | 0.80+ is relatively strong slow context; context, not a standalone entry signal. |
| Financial / 13F price divergence | Approximately -1 to +1; 0 = little gap | Positive means slow context is ahead of price; negative means price is ahead. +/-0.20 and +/-0.50 are reader bands only, not learned thresholds. |
| Expected next-session range | Non-directional high-low amplitude | Pair with the same-day cross-sectional percentile; it is not an upside target. |
1. Price improved, but participation still has to catch up
| Layer | Current reading | Interpretation | What would strengthen / weaken it |
|---|---|---|---|
| Index price | S&P vs MA5 +0.36%, vs MA20 -0.27%; Nasdaq vs MA5 +0.91%, vs MA20 +0.66% | Price has repaired faster than the participation layer. | Stronger if both indexes hold/reclaim short averages with improving breadth; weaker if the rebound loses MA5 while internals stay soft. |
| Breadth | 0.398; 20-day slope -1.06 z | Participation remains below the practical 0.50 balance area despite a 5-day improvement. | Needs continued rise toward/through 0.50, not just index-level resilience. |
| Downside damage | 20-day new-low z +0.25; 252-day new-low z -0.25; stocks down 3%+ z -0.93; cross-sectional vol z -0.44 | Weak breadth has not become broad liquidation. | A simultaneous rise in new lows, large-decline breadth and dispersion would materially worsen the thesis. |
| Structural warning | Systemic-warning percentile 94.0%; structural-watch percentile 92.8% | Historically elevated configuration, but these are score percentiles, not crash probabilities. | Needs current propagation evidence before being treated as an active selloff regime. |
This is the first important distinction of the day: weak breadth and elevated structural memory are not the same thing as current damage propagation. The market can remain vulnerable while still producing a selective rally. That is what the price/breadth split currently allows. It also defines the falsifier: if the weak participation begins to generate expanding new lows, more 3% decliners and higher cross-sectional volatility at the same time that index price loses the short averages, the “selective but intact” interpretation no longer fits.
2. The closing problem is now a state problem, not just a slope problem
| ET | Aggressor | Depth | Alignment | Same-time pct. | Bull aligned | Bear aligned | Buy absorp. | Sell absorp. | EW bar |
|---|---|---|---|---|---|---|---|---|---|
| 09:30 | 48.9 | 50.9 | 51.2 | 75.0 | 19.3% | 16.9% | 20.7% | 8.8% | -0.29% |
| 10:30 | 49.1 | 50.9 | 52.5 | 87.5 | 16.9% | 11.9% | 19.3% | 13.6% | +0.05% |
| 11:30 | 49.5 | 51.0 | 51.0 | 92.5 | 16.3% | 14.2% | 19.7% | 14.9% | +0.24% |
| 12:30 | 49.5 | 50.2 | 49.3 | 77.5 | 15.6% | 16.9% | 16.6% | 13.9% | -0.05% |
| 13:30 | 49.2 | 50.3 | 49.7 | 80.0 | 15.9% | 16.6% | 15.6% | 14.9% | +0.10% |
| 14:30 | 49.0 | 50.3 | 49.5 | 77.5 | 14.9% | 15.9% | 19.7% | 12.9% | -0.09% |
| 15:30 | 49.0 | 49.7 | 47.5 | 72.5 | 12.9% | 18.0% | 16.9% | 15.6% | -0.02% |
The morning initially looked better than the close. Alignment improved from 51.2 at 09:30 to 52.5 at 10:30 and the same-time percentile reached 92.5 by 11:30. But Aggressor Flow stayed below 50 at every checkpoint. By midday, Alignment had slipped under neutral, and the final hour reinforced rather than repaired the late-window weakness. Depth moved from 50.34 to 49.66, Alignment from 49.49 to 47.46, Bull-aligned breadth from 14.9% to 12.9%, and Bear-aligned breadth from 15.9% to 18.0%. Sell-absorption-compatible breadth also rose 2.7 percentage points in the final bar.
The absolute state matters more than describing a downward slope. Aggressor closed 1.02 points below neutral, Depth 0.34 below, and Alignment 2.54 below. Because none of the three axes finished above 50, there is no completed state repair to preserve. The next session inherits a high repair burden: a constructive read needs an early reclaim across the weak axes, persistence after the opening hour, and confirmation from Bull-aligned breadth and equal-weight price/breadth/damage. A brief opening bounce that leaves Alignment and Aggressor below 50 would not meet that burden.
There is still counterevidence to an aggressive bearish interpretation. The equal-weight basket gained 0.23% from open to close, the same-time percentile finished at 72.5 rather than collapsing into an unusually weak historical slot, and damage measures remained calm. In other words, the order-flow state deteriorated without yet forcing a broad price break. That makes the next-session reclaim test more informative than extrapolating the final-hour decline into a deterministic forecast.
3. Cross-asset pressure is a headwind, but not a synchronized risk-off confirmation
| Cross-asset layer | Current reading | Public-safe read |
|---|---|---|
| Discount-rate / funding-price stress | +2.96 z; +1.38 z over 5 trading days; 98th historical percentile | Financial pricing has tightened sharply enough to raise the hurdle for high-duration equities. |
| Liquidity impulse | -1.75 z; -3.06 z over 5 trading days; ~2nd percentile | A materially negative liquidity impulse is a second macro headwind. |
| Duration preference | +1.88 z; 97th percentile | Longer-duration Treasury exposure has strengthened on a relative basis. |
| Credit risk appetite | -0.81 z | Credit preference is not providing a clean risk-on confirmation. |
| Cross-asset coupling | +0.66 z | Coupling is only moderate; the major sleeves are not yet moving as one crisis mode. |
The key here is sequencing. Tight financial pricing and a negative liquidity impulse can pressure long-duration equities before the equity tape breaks, but they are not sufficient by themselves to declare synchronized risk-off. The current coupling state is moderate, current damage is subdued, and the market is still near its 252-day high. The base case therefore treats cross-asset conditions as a confirmation burden on the selective equity thesis: leadership needs to keep producing real price support despite a less forgiving macro backdrop.
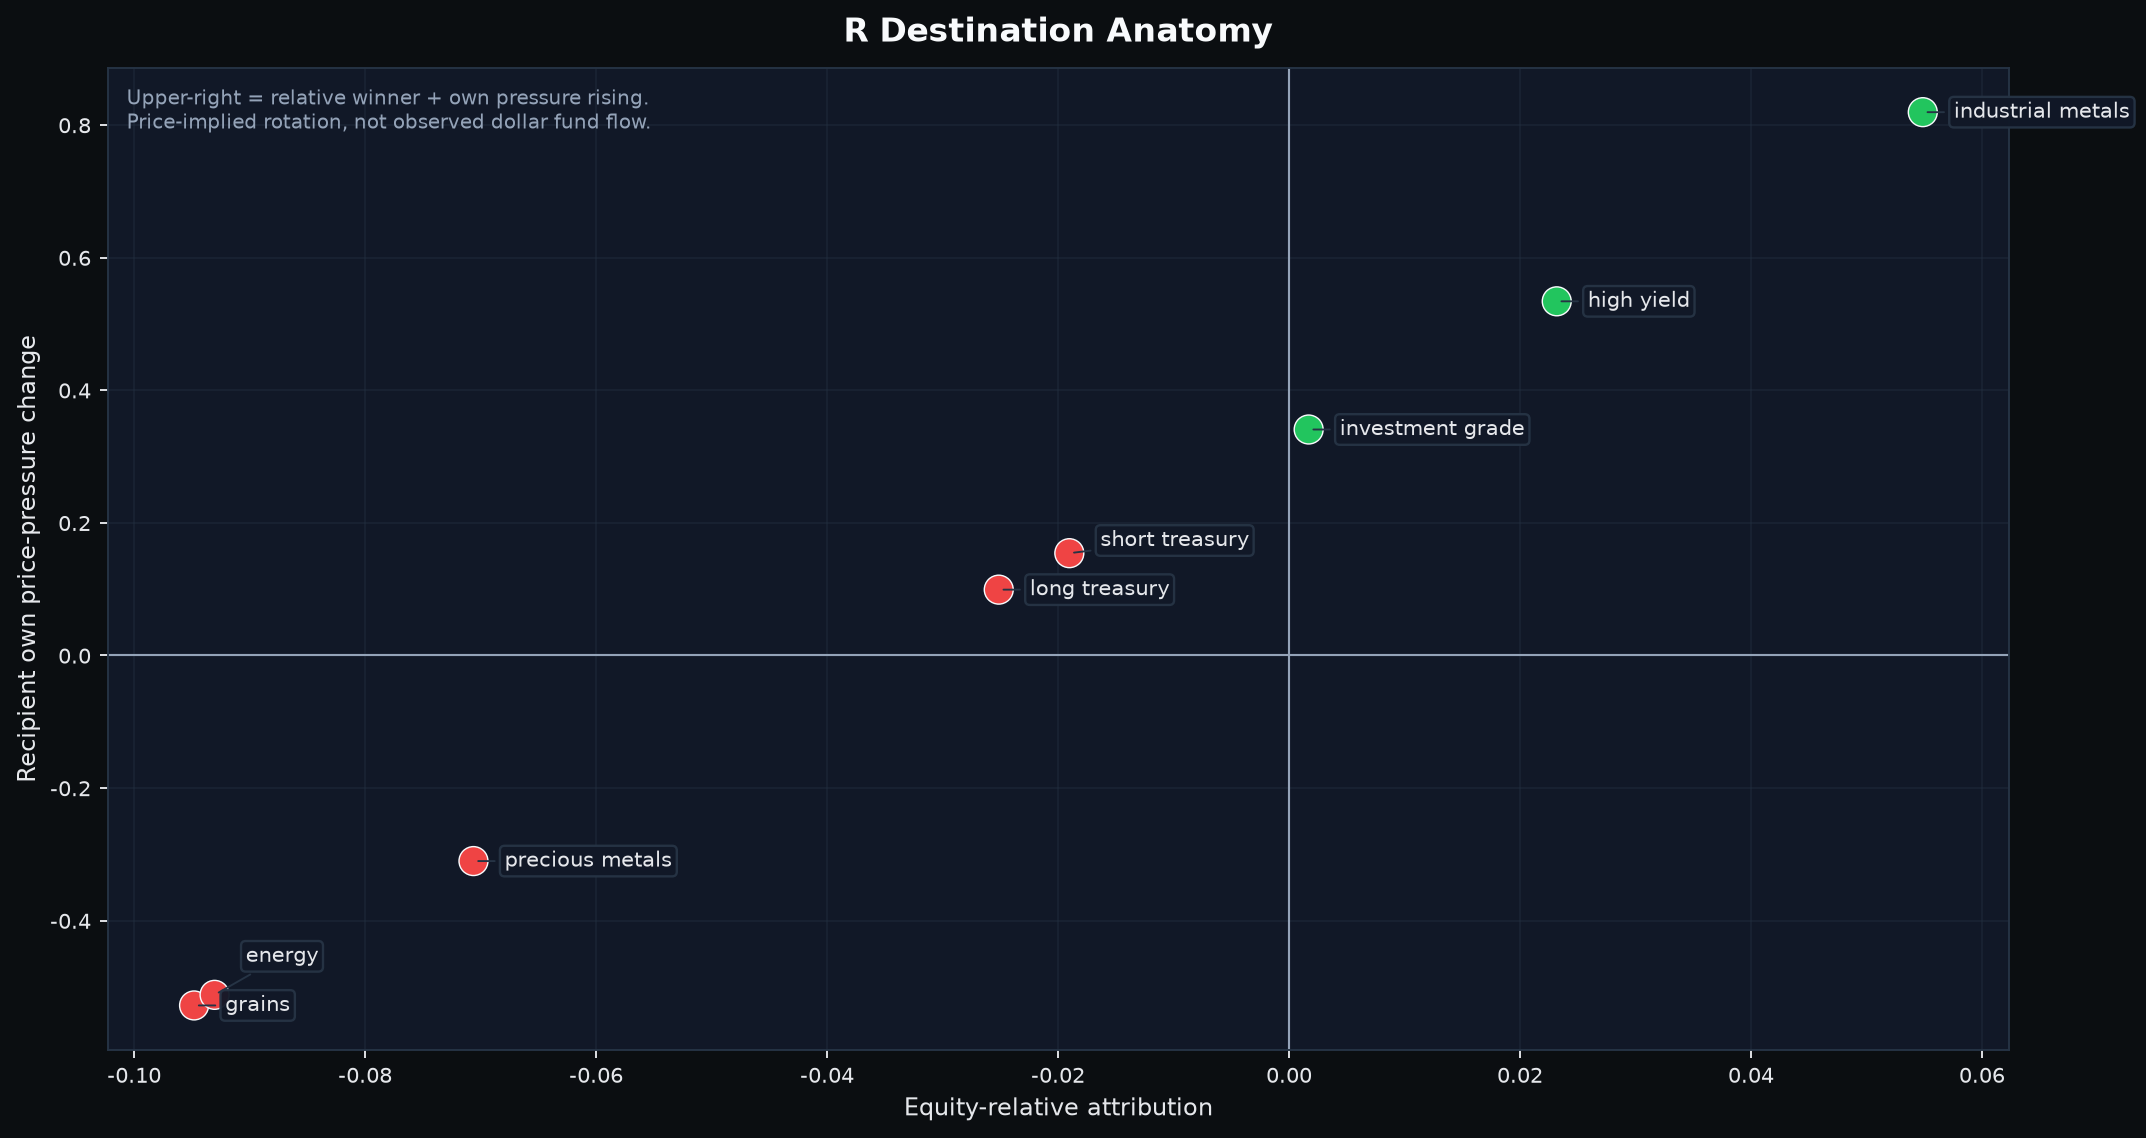
These are not contradictory measures: duration preference describes the current relative state, while R destination anatomy asks which sleeves account for the change in relative preference over the last 20 trading days.
The 20-trading-day destination anatomy makes that distinction more concrete. Industrial metals are the strongest positive relative-price destination: their R-gap contribution is +0.055 while their own-pressure change is +0.82. High Yield is also an active positive destination (+0.023 contribution; +0.53 own pressure), even though the separate current credit-risk-appetite state is weak. Long Treasuries are not the primary destination: their R-gap contribution is -0.025 and their allocation change is essentially flat at -0.003. The commodity complex is not moving as one block either - industrial metals are positive while precious metals, energy and grains have negative own-pressure changes. R is a relative-price pressure decomposition, not observed dollar flow; the message is selective, non-classical repricing rather than a textbook flight into Treasuries.
Coupling tells a similar story when decomposed by node. Over 20 trading days, K increased by +0.030, but the largest positive contributions came from industrial metals (+0.013), energy (+0.013) and precious metals (+0.010); the equity node contributed -0.008 in the opposite direction. In other words, the moderate rise in cross-asset common movement is being pulled more by real-asset/commodity nodes than by an equity-led common mode. That weakens the case for reading current coupling as synchronized equity-led risk-off.
CFTC lag note: the latest positioning snapshot is dated September 8, 2026. It is current under the normal weekly release schedule, but it predates this September 17 market close by 7 trading days. Among the sleeves covered by that snapshot, positioning direction is aligned with the price-implied rotation, but the aggregate confirmation is only soft. It is therefore lagged positioning context rather than same-day evidence and is too stale to adjudicate the newest move strongly.
4. Leadership moved toward the physical AI stack - but three of five leaders are two-sided
| Bull rank | Sector | Bear-risk rank | Balance state | Representative names | Public read |
|---|---|---|---|---|---|
| 1 | Industrial Machinery, Automation & Instruments | 8 | Bull-dominant | COHR, GEV, FPS, VRT, BE, SMR, CMI | Power, cooling, grid and photonics form a coherent physical-infrastructure cluster. |
| 2 | Semiconductors & Tech Hardware | 3 | Two-sided conflict | LITE, AXTI, SMTC, AAOI, STX, WDC, CRDO | Strong AI interconnect/storage participation, but substantial downside-risk concentration remains. |
| 3 | Asset Management & Capital Markets | 2 | Two-sided conflict | HUT, WULF, IREN, RIOT, KKR, MARA, BMNR | The label is economically mixed: selected names increasingly overlap AI-cloud/data-center infrastructure while crypto beta remains material. |
| 4 | Enterprise Software & IT Services | 1 | Two-sided conflict | CIFR, CRWV, APLD, SNOW, ORCL, INTU, MDB | The selected expression is narrow and infrastructure-heavy rather than broad software strength. |
| 5 | Engineering, Construction & Building Products | 17 | Bull-dominant | PWR, JHX, LEN, CARR, JCI, CRH | Grid/buildout exposure is constructive at sector level, but no name is in the current selected support set. |
The temporal change is useful but should not be mistaken for observed dollar flow. Industrial machinery moved from #5 on September 16 to #1 on September 17, semiconductors moved from #1 to #2, and engineering/construction entered the Bull Top 5. That composition shift is consistent with a market looking beyond compute chips toward the bottlenecks around power delivery, cooling, grid capacity and network links.
Economic anatomy of the Bull Top 5
| Sector | Leading subcluster(s) | Key names | Economic linkage | Quant / price-support confirmation | Why now / public mechanism | Strongest counterevidence |
|---|---|---|---|---|---|---|
| Industrial Machinery, Automation & Instruments | Photonics; data-center power/cooling; grid equipment | COHR, VRT, GEV | AI compute requires optical links, dense power delivery, cooling and grid connection. | All three are in the selected support set, 0.21-0.23 ATR from live S1. | EIA sees data centers/manufacturing driving electricity demand; Vertiv is explicitly expanding behind-the-meter/time-to-power capability; Coherent reports exceptional AI optical demand. | VRT remains 6.4% below its 20-day average and SMR is a top-10 Bear-risk name inside the broader sector. |
| Semiconductors & Tech Hardware | AI fabric/connectivity; optics; storage | ALAB, CRDO, LITE, STX | Scaling AI clusters increases high-speed interconnect, optical and storage requirements. | Four selected names are only 0.02-0.10 ATR from live S1. | Astera reported 104% Y/Y Q2 revenue growth with AI fabric/connectivity strength; Credo launched 1.6T AI-network optics; Coherent cites the copper-to-optics transition. | Sector Bear-risk rank is #3; CRDO is still 12.2% below MA20 and STX 3.2% below MA20. |
| Asset Management & Capital Markets | AI cloud/data-center operators inside a crypto-sensitive cohort | IREN, RIOT | Power-rich sites can be redeployed from mining toward contracted AI compute and data-center capacity. | IREN and RIOT are 0.28 and 0.30 ATR from live S1, respectively. | IREN reported $4B contracted ARR for 2026 AI-cloud capacity; Riot disclosed 241 MW of contracted critical IT capacity across AI tenants. | Bear-risk rank is #2 and the sector still contains heavily crypto-sensitive names; the economic cluster is narrower than the label. |
| Enterprise Software & IT Services | AI-factory / HPC data-center infrastructure | APLD | APLD's economics are data-center leasing and power-dense compute infrastructure rather than conventional software. | APLD is the only selected name; 0.35 ATR from live S1 and above MA20. | Applied Digital disclosed a 210 MW, 15-year AI-factory lease and a multi-campus contracted portfolio. | Sector Bear-risk rank is #1 and support confirmation is concentrated in one selected name. |
| Engineering, Construction & Building Products | Transmission, electrical construction, building systems | PWR, CARR, JCI, CRH | Higher load growth requires grid upgrades and physical project execution. | Bull-dominant sector, Bear-risk rank #17; no selected-support name. | EIA forecasts record generation and rising commercial/industrial electricity demand. | The lack of a selected support-confirmed stock means the sector signal has not yet translated into the current stock set. |
The public facts line up with the cluster, but they do not remove the two-sided structure. EIA's September outlook expects U.S. electricity generation to rise 2.2% to a record 4,368 BkWh in 2026 and electricity sales to rise almost 2%, citing data centers and manufacturing as important drivers. Vertiv's September 2 deal adds microgrid controls, on-site generation orchestration and behind-the-meter architecture specifically to shorten time-to-power for data centers. Coherent's August quarter showed $2.05 billion of revenue, up 34% year over year, while management linked demand to the shift from copper toward optical connectivity in AI data centers. These facts explain why power and connectivity can cluster together economically; they do not prove every stock in those sectors is in a clean uptrend.
5. Ten selected stocks: support is real, trend quality is not uniform
| Stock | Sector | Selection role | Bull rank | Bear rank | Recent S1 confirmation | Distance to live S1 | vs MA5 / MA20 | Slow context |
|---|---|---|---|---|---|---|---|---|
| ALAB | Semiconductors & Tech Hardware | B Bull screen | #29 / 297 | #75 / 297 | same-day S1 center reclaim; 1 TD ago | 0.13% / 0.02 ATR | +7.6% / +3.0% | Positive |
| STX | Semiconductors & Tech Hardware | A+/A Bull screen | #10 / 297 | #73 / 297 | next-day S1 center reclaim after bearish wick; 1 TD ago | 0.61% / 0.10 ATR | +0.5% / -3.2% | Positive |
| CRDO | Semiconductors & Tech Hardware | A+/A Bull screen | #13 / 297 | #114 / 297 | same-day S1 center reclaim; 1 TD ago | 0.90% / 0.10 ATR | +6.1% / -12.2% | Mixed |
| LITE | Semiconductors & Tech Hardware | A+/A Bull screen | #3 / 297 | #156 / 297 | same-day S1 center reclaim; 1 TD ago | 0.78% / 0.10 ATR | +1.2% / -0.4% | Mixed |
| COHR | Industrial Machinery, Automation & Instruments | A+/A Bull screen | #7 / 297 | #174 / 297 | same-day S1 center reclaim; 1 TD ago | 1.66% / 0.21 ATR | +3.6% / +3.8% | Positive |
| VRT | Industrial Machinery, Automation & Instruments | B Bull screen | #24 / 297 | #146 / 297 | next-day S1 center reclaim after bearish wick; 0 TD ago | 1.37% / 0.21 ATR | -0.2% / -6.4% | Positive |
| GEV | Industrial Machinery, Automation & Instruments | A+/A Bull screen | #15 / 297 | #159 / 297 | same-day S1 center reclaim; 1 TD ago | 1.08% / 0.23 ATR | +1.3% / -0.7% | Positive |
| IREN | Asset Management & Capital Markets | B Bull screen | #16 / 297 | #103 / 297 | same-day S1 center reclaim; 1 TD ago | 2.10% / 0.28 ATR | +1.3% / +4.5% | Positive |
| RIOT | Asset Management & Capital Markets | B Bull screen | #17 / 297 | #58 / 297 | same-day S1 center reclaim; 0 TD ago | 2.21% / 0.30 ATR | +4.8% / +6.6% | Positive |
| APLD | Enterprise Software & IT Services | B Bull screen | #18 / 297 | #116 / 297 | same-day S1 center reclaim; 0 TD ago | 2.52% / 0.35 ATR | +5.4% / +0.6% | Mixed |
Slower-context divergences: confirmation does not rescue price structure
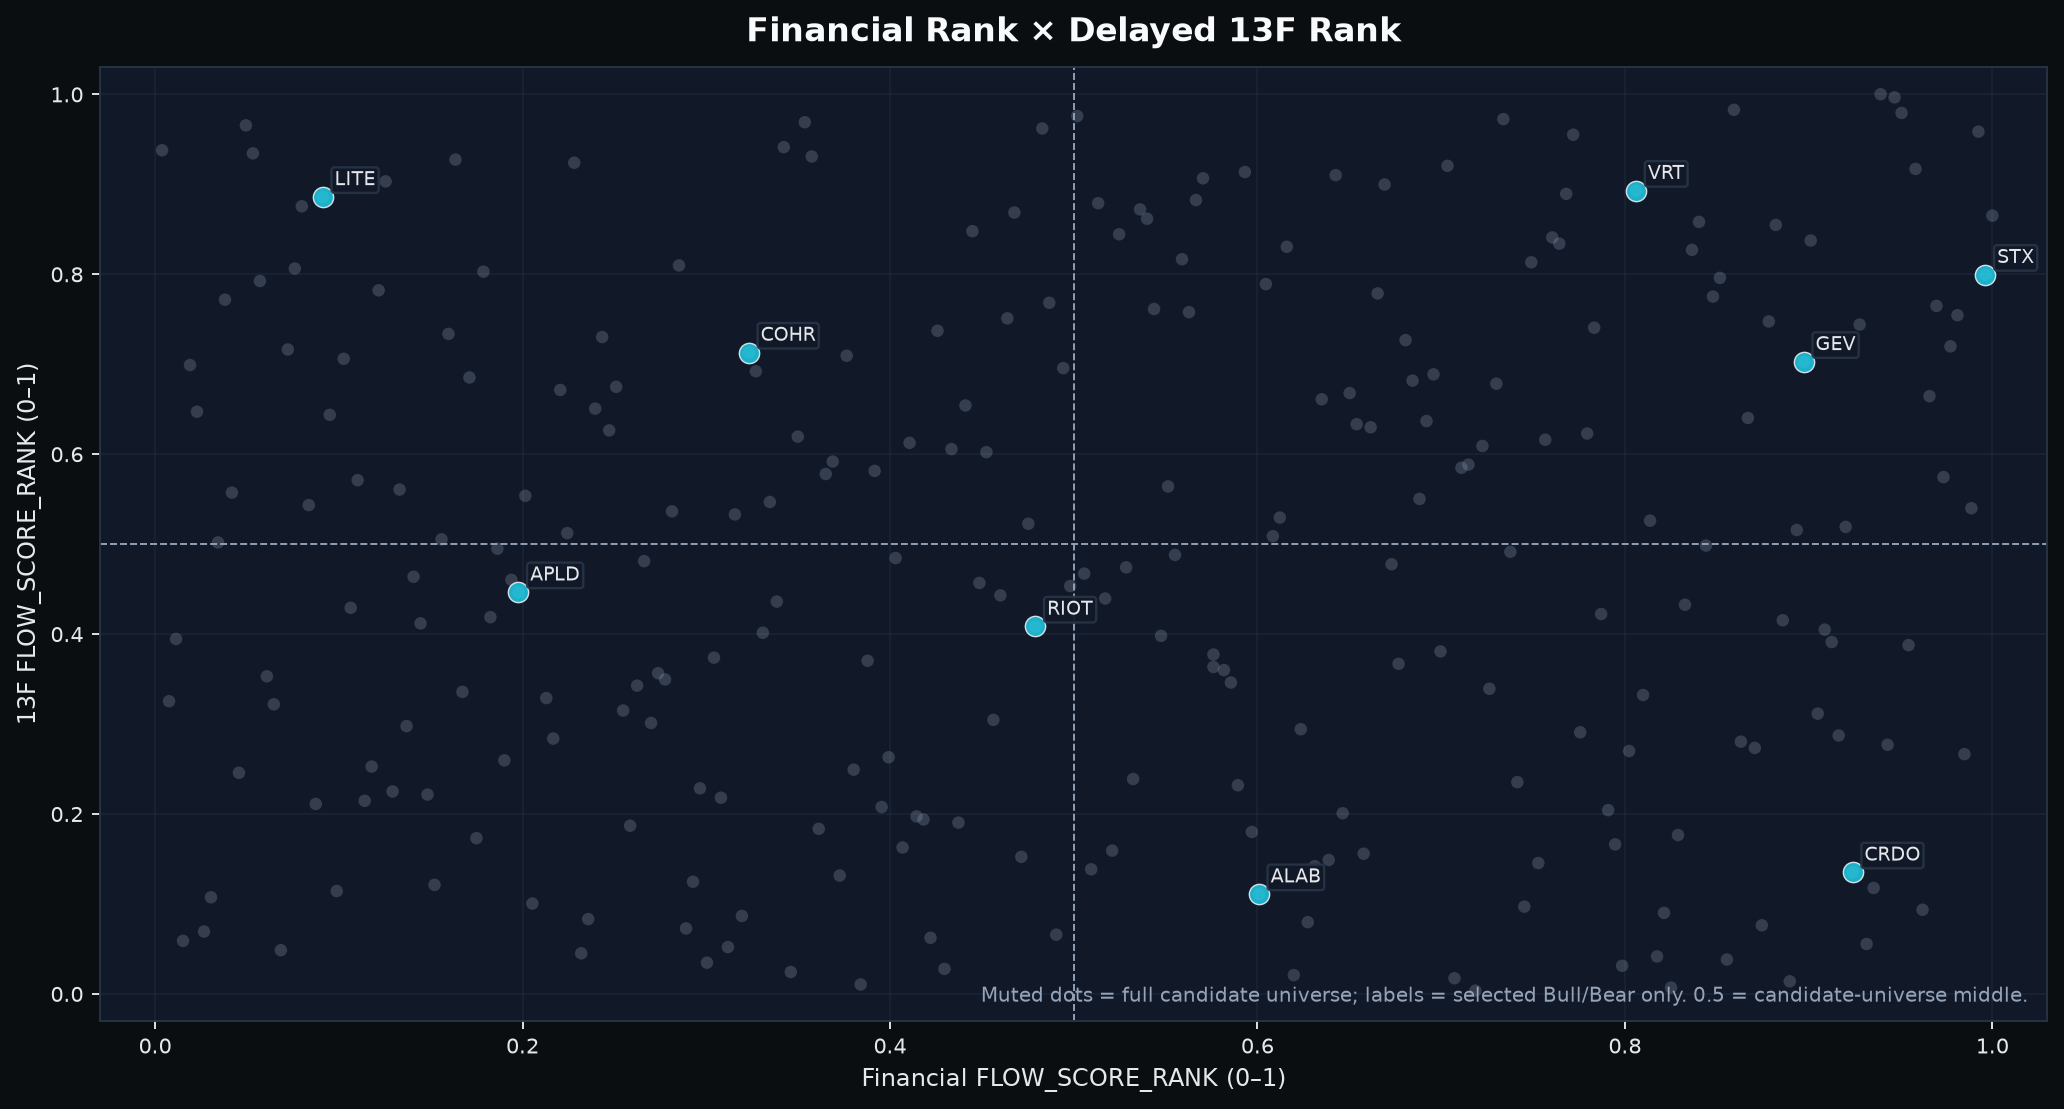
The slower Financial and delayed-13F layers are most useful when they disagree. STX (Financial 1.00; delayed 13F 0.80), VRT (0.81; 0.89) and GEV (0.90; 0.70) are the cleanest both-strong cases. But VRT still sits 6.4% below MA20 and STX 3.2% below MA20. Their slow context supports the business/ownership backdrop; it does not convert fresh structural support into completed medium-term trend repair.
CRDO and LITE show the opposite disagreement patterns. CRDO has a strong Financial rank of 0.92 but a weak delayed-13F rank of 0.13, with delayed-holdings price divergence at -0.11. LITE reverses that structure: Financial rank 0.09 versus delayed-13F 0.89, while its Financial price divergence is -0.17. ALAB's delayed-13F rank is only 0.11 despite very close live support, and APLD's Financial rank is 0.20. These are not reranking inputs. Preserving the disagreement prevents a strong narrative in one slow layer from hiding counterevidence in another.
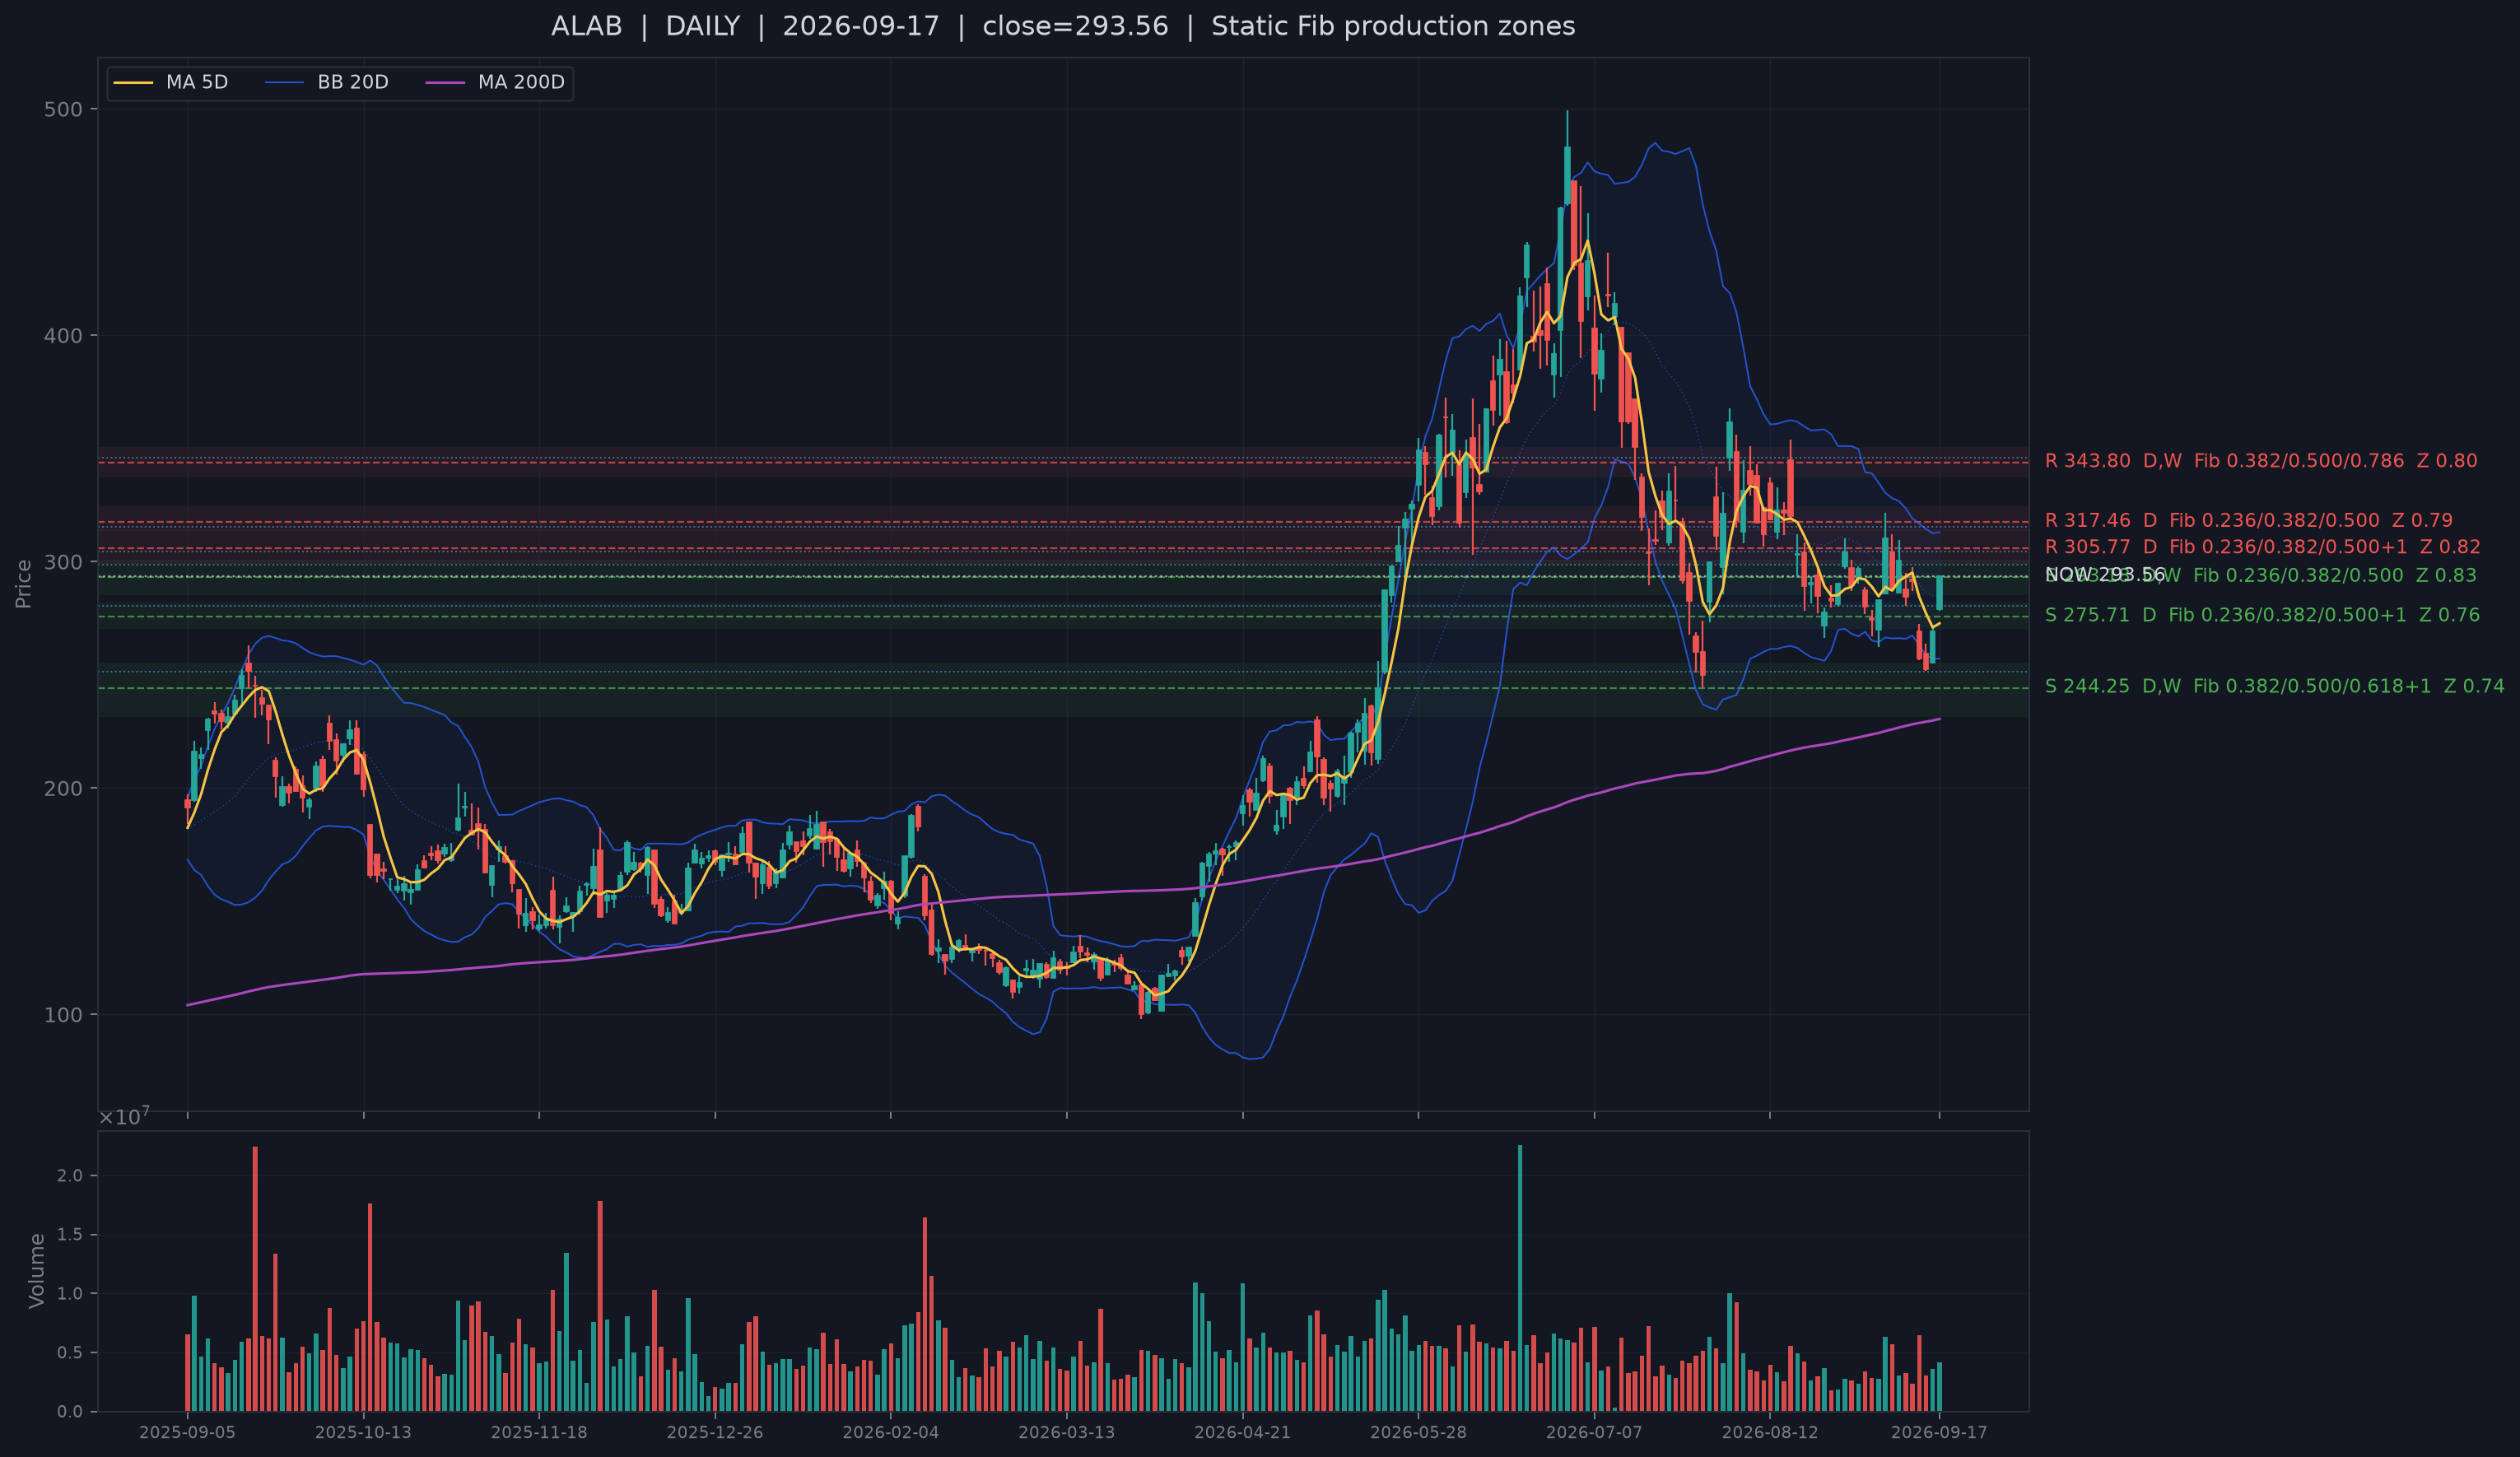
The table is deliberately ordered by the upstream selection sequence and is not reranked by news. The first cluster is AI connectivity/storage. ALAB is only 0.02 ATR from its current live S1 center and remains above both short averages. Astera's August results showed revenue of $392.4 million, up 104% year over year, with growth across AI fabrics and signal conditioning. CRDO and LITE add the optical/network layer; Credo's September 15 1.6T transceiver launch is fresh evidence that the bandwidth and reliability problem remains commercially active. STX is different: support has reclaimed, but price is still 3.2% below MA20, so storage demand does not yet equal full trend repair.
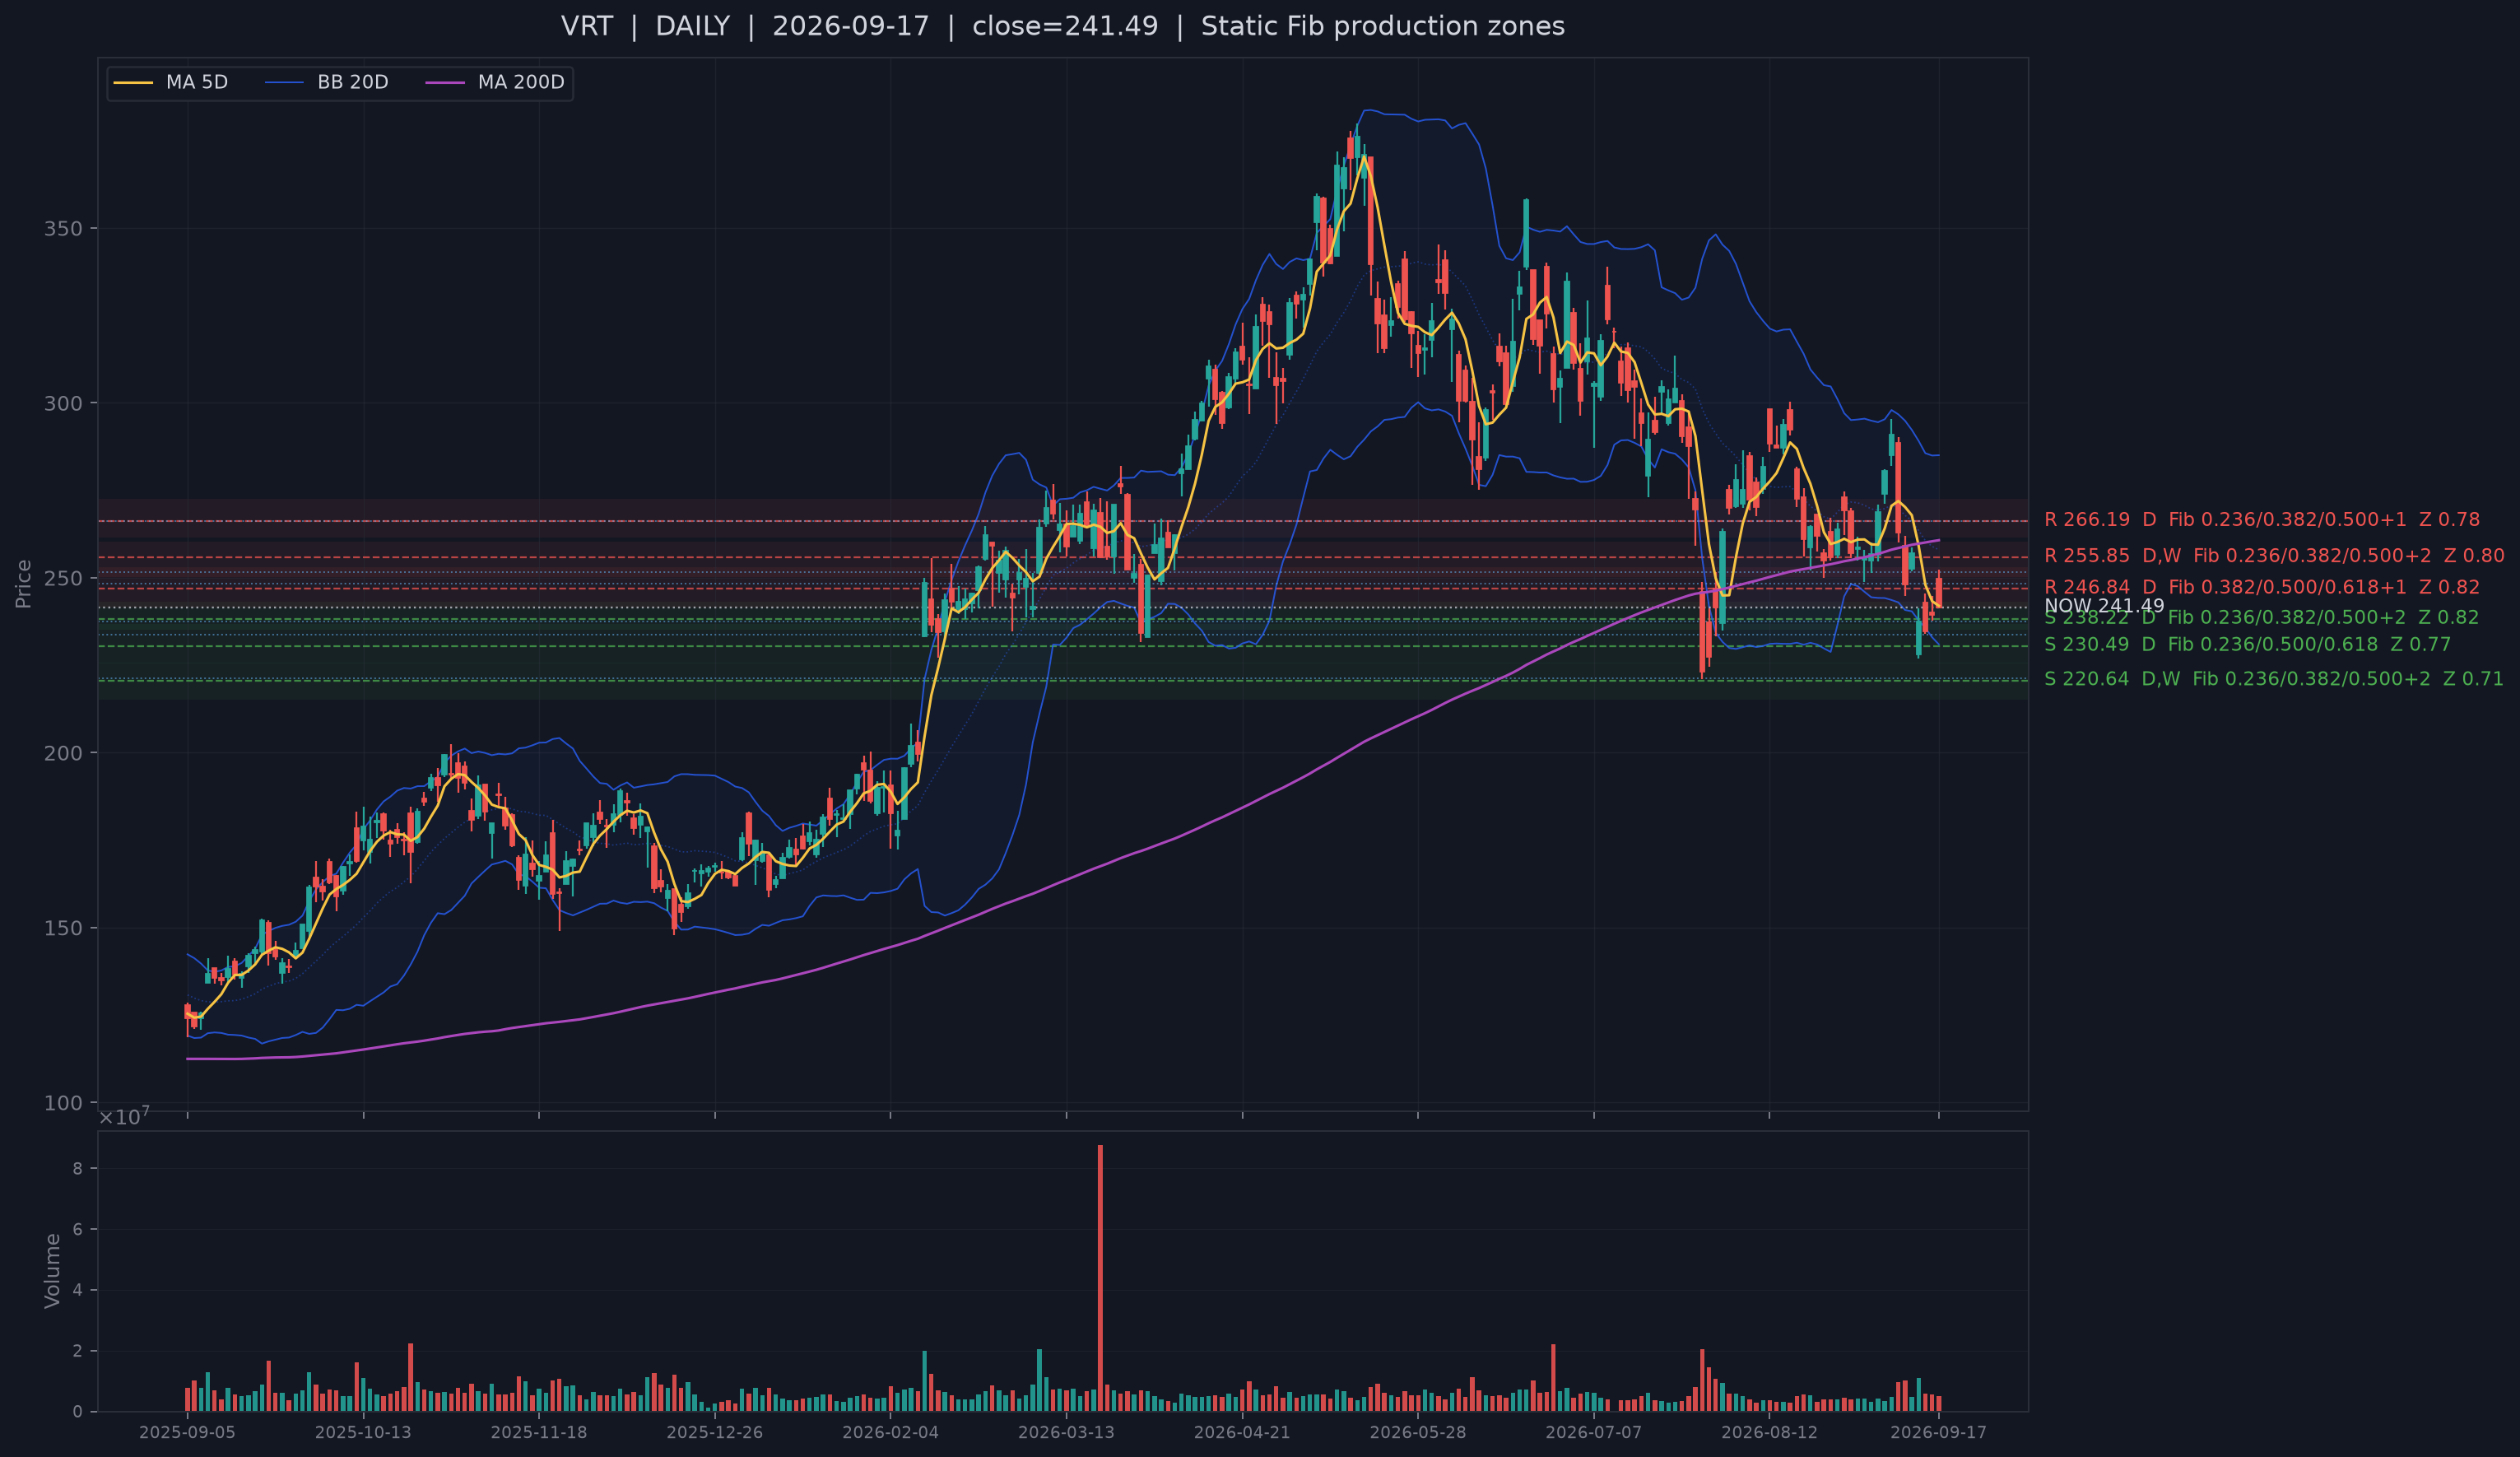
The second cluster is power, cooling, grid and photonics. COHR is the cleanest current price confirmation among the three, above both MA5 and MA20 and 0.21 ATR from live S1. GEV sits just under MA20 but has a positive slower financial/holdings context. As the slow-context comparison above shows, VRT has unusually strong confirmation from both slower layers and a fresh next-day center reclaim after a bearish wick on September 17, yet remains 6.4% below MA20. That is exactly why the framework separates recent structural support from trend geometry: support and slower context can both be valid while the broader trend still needs repair.
The third cluster crosses conventional sector labels: power-rich compute campuses. IREN and RIOT sit in Asset Management & Capital Markets in the quantitative taxonomy, while APLD sits in Enterprise Software & IT Services, but the public business mechanism overlaps. IREN reported $4 billion of contracted ARR for 2026 AI-cloud capacity and describes a vertically integrated stack of power, data centers, compute and software. Riot disclosed 241 MW of contracted critical IT capacity across two AI tenants, including a 20-year 191 MW lease. Applied Digital's 210 MW Delta Forge 2 agreement is a 15-year take-or-pay lease. The common denominator is access to power and the ability to turn it into contracted compute capacity.
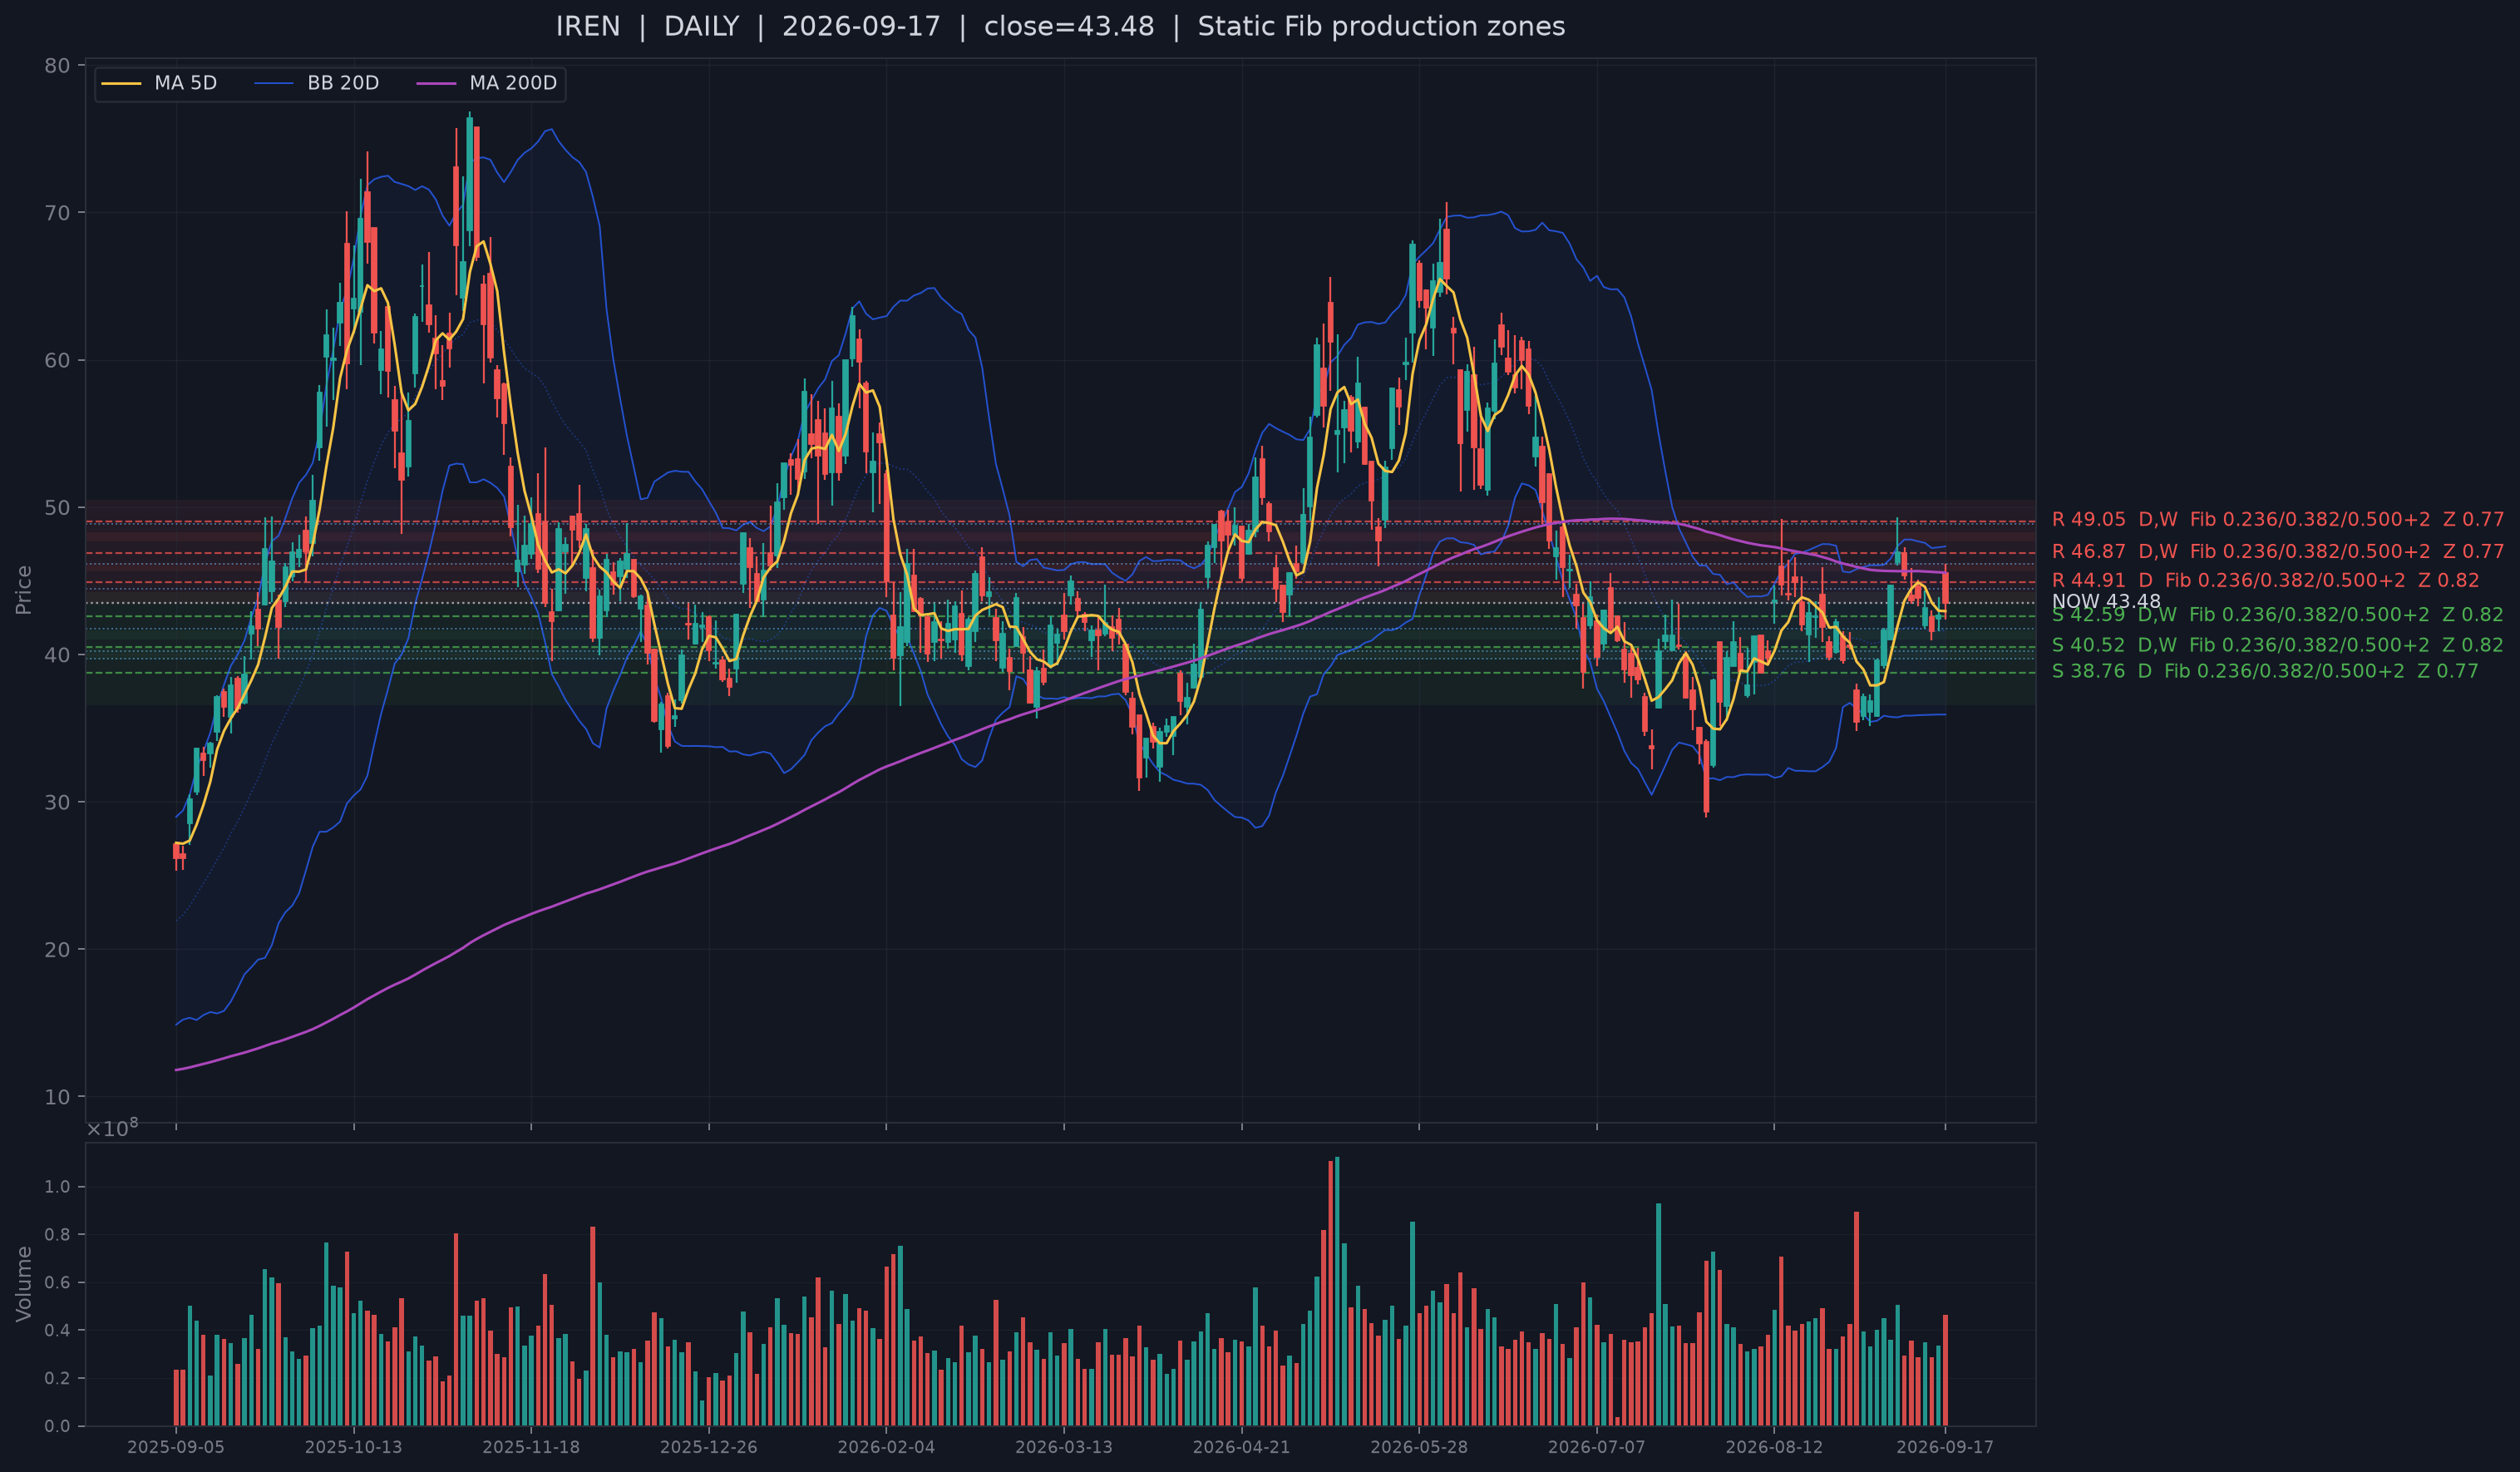
This cluster also shows why slower context must stay subordinate to current support. IREN lacks current financial-statement context in the bundle but has positive delayed holdings context; APLD has negative financial context but positive delayed holdings context. Those disagreements are useful counterevidence, not reasons to override the stock-selection order. The separate price-path/risk context available for CRDO and GEV is also internally mixed: its recommendation layer is constructive while its energy-side model points short. Both names are therefore treated as neutral secondary context in the audit rather than confirmation or veto.
6. What would change the 3-10 day thesis
Base case: the market remains selectively constructive in AI infrastructure and connectivity, but the broad tape is fragile. Price has repaired more than breadth, current damage is contained, and support-confirmed names are clustering around a coherent physical-demand chain. The opposing evidence is substantial: all three order-flow state axes closed below neutral, breadth remains under 0.40, discount-rate stress is extreme relative to recent history, and three of the Bull Top 5 sectors are two-sided.
Constructive confirmation: the next session should reclaim 50 early in Aggressor Flow, Depth Pressure and Alignment and hold that reclaim beyond the opening impulse. Bull-aligned breadth should stop contracting, equal-weight price should confirm, and market breadth should keep repairing without a rise in downside damage. At the stock level, the selected names should continue to hold their live S1 zones, with the weaker trend cases - especially VRT, STX and CRDO - beginning to repair their MA20 gaps.
Bearish falsifier: another close with the three order-flow axes below neutral becomes more serious if it is joined by expanding new lows, a jump in the share of stocks down 3% or more, higher cross-sectional volatility and a loss of index MA5 support. A broad failure of the live S1 zones across the selected stock set would also invalidate the idea that the infrastructure cluster is absorbing the weak market backdrop.
What not to infer: the current data do not identify institutional accumulation or distribution, do not prove buyer or seller exhaustion, and do not show observed dollar flows between sectors. Sector-rank changes describe composition; cross-asset rotation measures are price-implied relative states. Those distinctions matter most on a day when order-flow, price and sector support are not telling exactly the same story.
Sources
- U.S. Energy Information Administration - EIA expects record electricity generation in 2026 and 2027 (2026-09-09).
- Coherent - Coherent Corp. Reports Fourth Quarter and Full Year Fiscal 2026 Results (2026-08-12).
- Credo - Credo Expands ZeroFlap Portfolio with 224G-Based 1.6T Optical Transceivers (2026-09-15).
- Astera Labs - Astera Labs Reports Second Quarter 2026 Financial Results (2026-08-04).
- Vertiv - Vertiv Announces Agreement to Acquire UtilityInnovation Group to Accelerate Time to Power for AI Data Centers (2026-09-02).
- IREN - IREN Reports FY26 Results (2026-08-27).
- Riot Platforms - Riot Platforms Reports Second Quarter 2026 Financial Results and Strategic Highlights (2026-08-10).
- Applied Digital - Applied Digital Signs 210 MW Lease at Delta Forge 2 (2026-06-08).
Methodology note
Market Layers is an independent quantitative research publication focused on the U.S. equity market. The process is data first and narrative second: quantitative observations define the research questions, and public company/government information is then used to test plausible mechanisms and counterevidence. Stock upside and downside models are independent ranking screens rather than literal probabilities. The selected stock set is narrowed by recent structural support confirmation; slower financial statements, delayed 13F holdings and public catalysts are contextual and do not override that order. This research is designed for 3-10 trading-day swing setups; the signals and conclusions may not transfer to intraday trading or longer-horizon investing. This material is for informational and research purposes only and does not constitute investment advice.