Broader Sector Leadership, Narrower Stock Support as Market Repair Stayed Below Neutral
The Fed hike intensified discount-rate pressure while all three market-wide order-flow axes closed below neutral. Sector leadership broadened into metals, credit and transportation, but the support-confirmed stock set remained concentrated in semiconductors and hardware.
Market as of: September 16, 2026 U.S. close
Trading horizon: 3-10 trading days. This framework tracks state transitions, support confirmation, leadership quality and the observations that would invalidate the current thesis.
Key takeaway
The market weakened further in participation and order flow, but the leadership map broadened faster than the support-confirmed stock list. Both major indexes remain below falling five- and 20-day averages, breadth has fallen to roughly the bottom 5% of its trailing history, and the discount-rate pressure shock is unusually high. Yet synchronized downside propagation is still inactive. That keeps the current state in a structural-warning regime rather than a completed liquidation cascade.
The September 16 sector map broadened: semiconductors moved to #1, while metals, credit/mortgage and transportation entered the Bull Top 5. Yet eight of ten support-confirmed stocks remain in Semiconductors & Tech Hardware. That gap can reflect genuine early broadening, incomplete sector-to-stock transmission, or selective resilience inside a weak tape. With breadth at the 4.8th percentile, all three order-flow axes below neutral and only AAL/RKT extending confirmation beyond hardware, the evidence currently favors incomplete transmission or selective resilience over confirmed broadening.
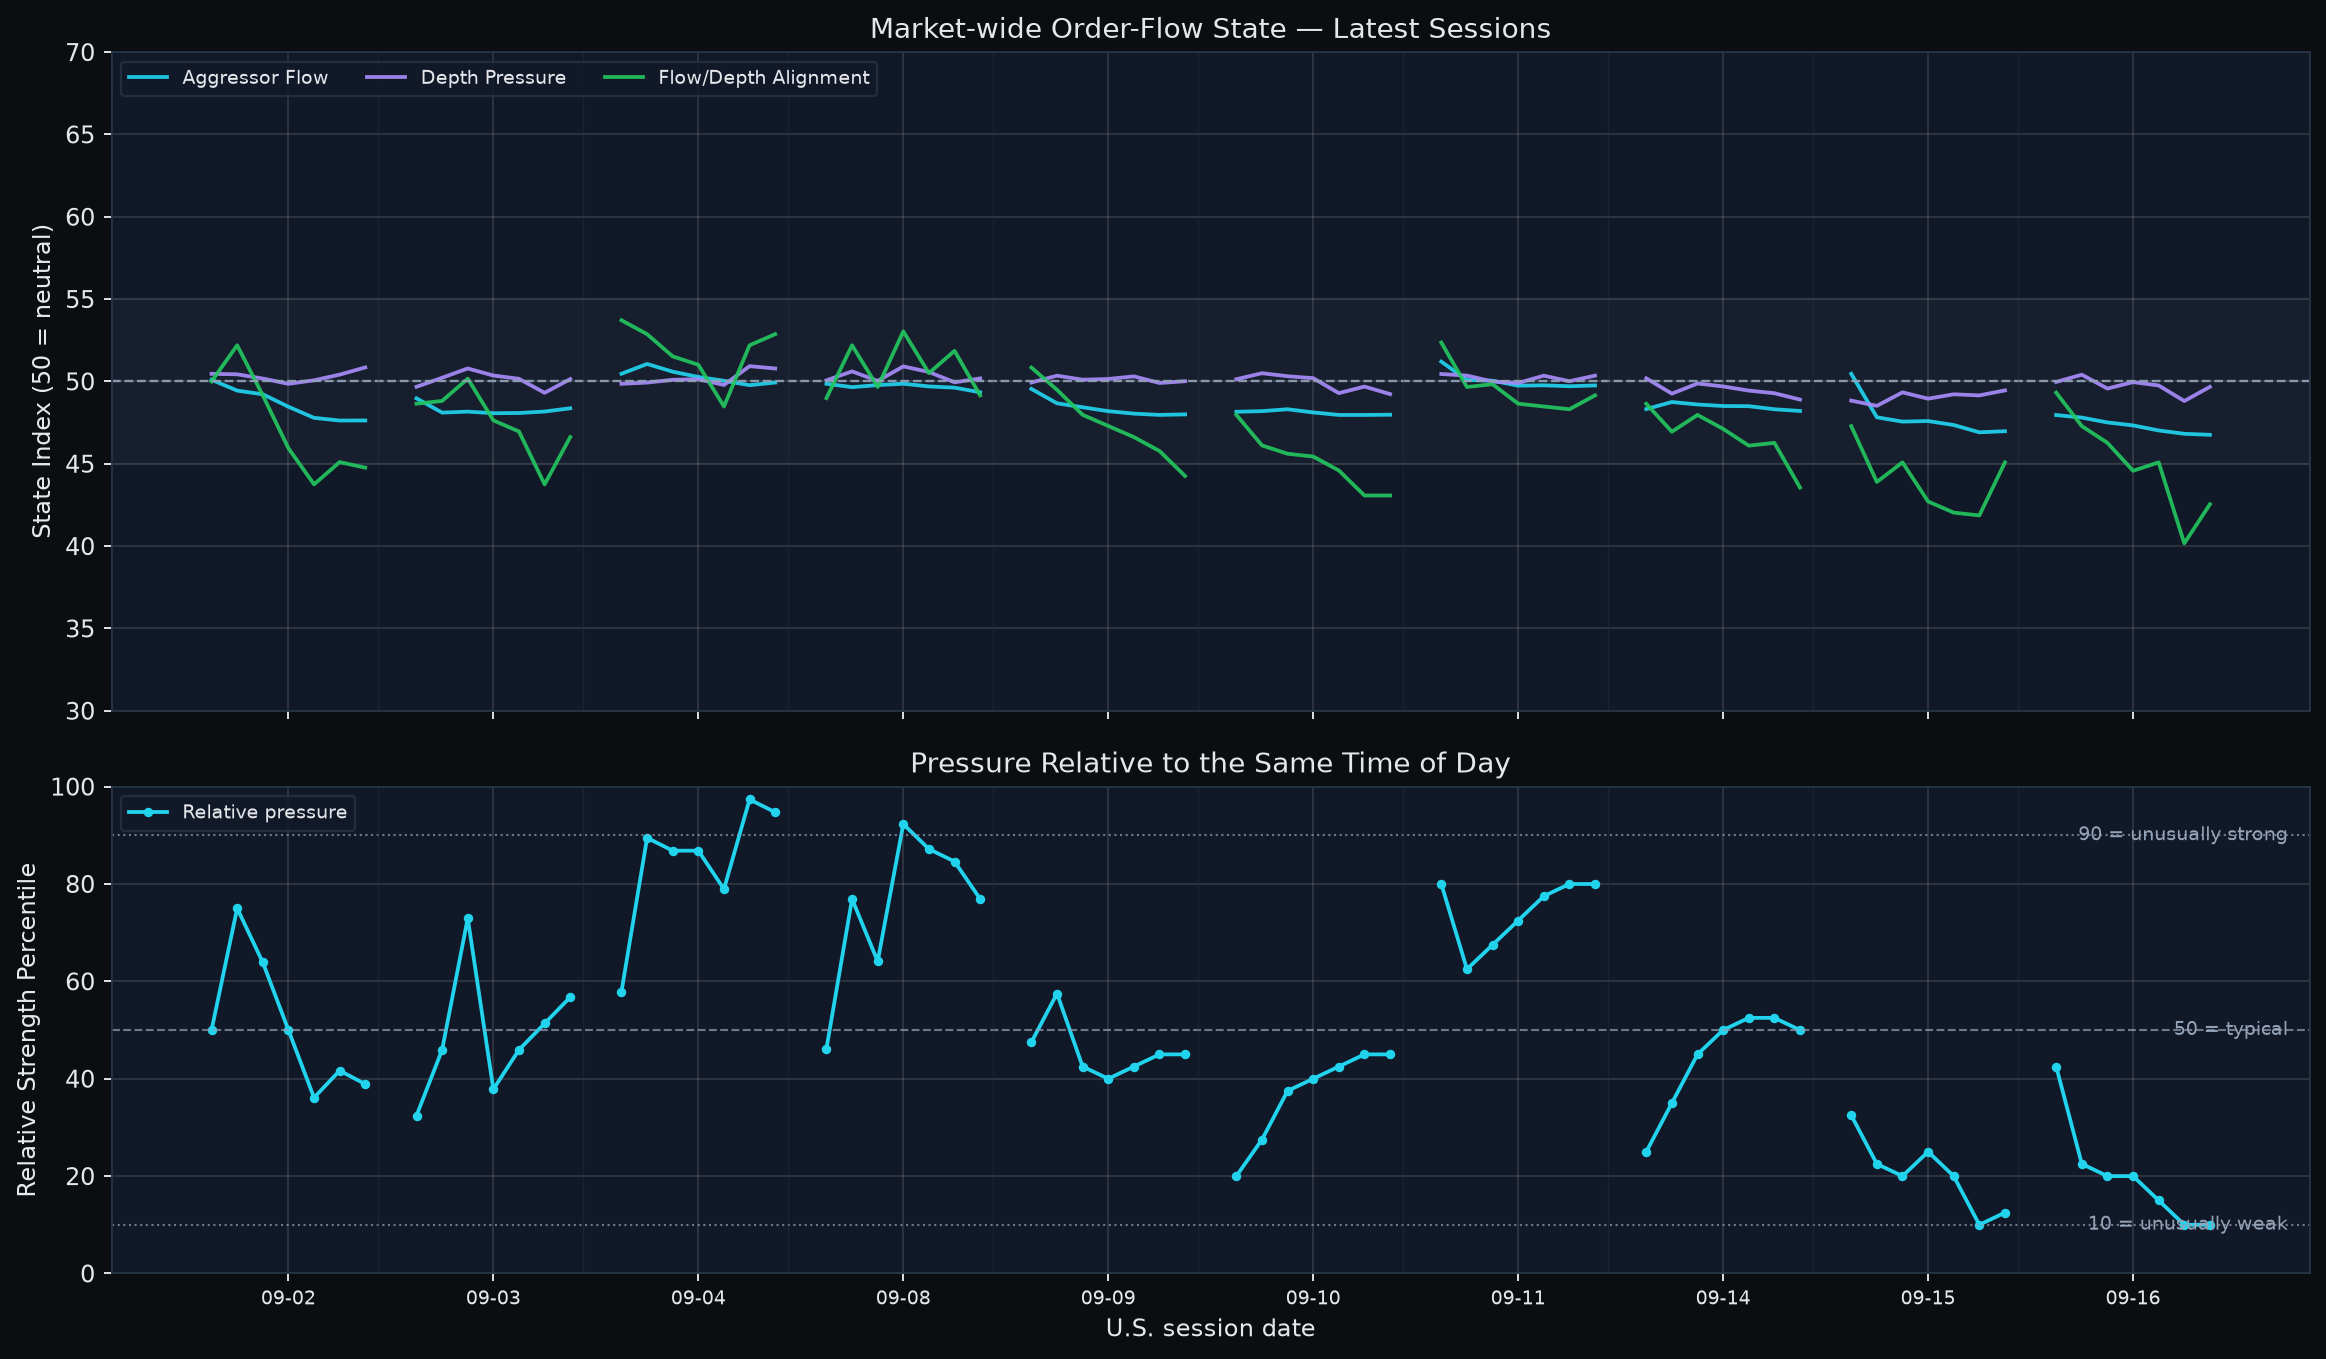
Order flow supports the same caution. All three state axes closed below 50; the final hour repaired Depth Pressure and Flow/Depth Alignment, but Aggressor Flow was essentially flat and the same-time percentile stayed at 10. Because sector rank is relative while market-wide execution is absolute, groups can outrank peers inside a weak tape. The late move reduced immediate pressure but did not validate the wider sector map.
How to read today's indicators
| Indicator | Reader scale | Interpretation |
|---|---|---|
| Market-wide order-flow state | three component indices; 50 = neutral | Aggressor Flow, Depth Pressure and Flow/Depth Alignment answer different questions. Read confirmation/divergence across the three; they are not probabilities. |
| Same-time order-flow percentile | 0-100; 50 = same-time historical median | 90 is unusually strong and 10 unusually weak for that intraday slot. This is historical context, not event probability. |
| Flow x depth state breadth | cross-sectional percentages | Bull/Bear aligned show joint direction; absorption states describe compatible divergence only, not proven actor intent. |
| Market breadth | 0-1; practical balance ~0.50 | Above 0.50 means broader participation. Direction and slope show whether participation is improving or fading. |
| z-score | 0 = historical mean | |z| ~1 is notable and |z| ~2 is unusual. It is standardized distance, not probability. |
| Historical percentile | 0-100; 50 = median | 90+ is historically elevated. A percentile is not an event probability. |
| FLOW_SCORE_RANK | 0-1; 0.50 = median | 0.80+ is relatively strong slow context. It is confirmation/context, not a standalone entry signal. |
| Financial / 13F price divergence | approx. -1 to +1; 0 = little gap | Positive means slow context is ahead of price; negative means price is ahead. +/-0.20 / +/-0.50 are reader bands only, not learned thresholds. |
| Expected next-session range | non-directional high-low amplitude | Always pair the raw estimate with its same-day cross-sectional percentile. It is not an upside target. |
1. Price and breadth remain weak, but downside damage has not synchronized
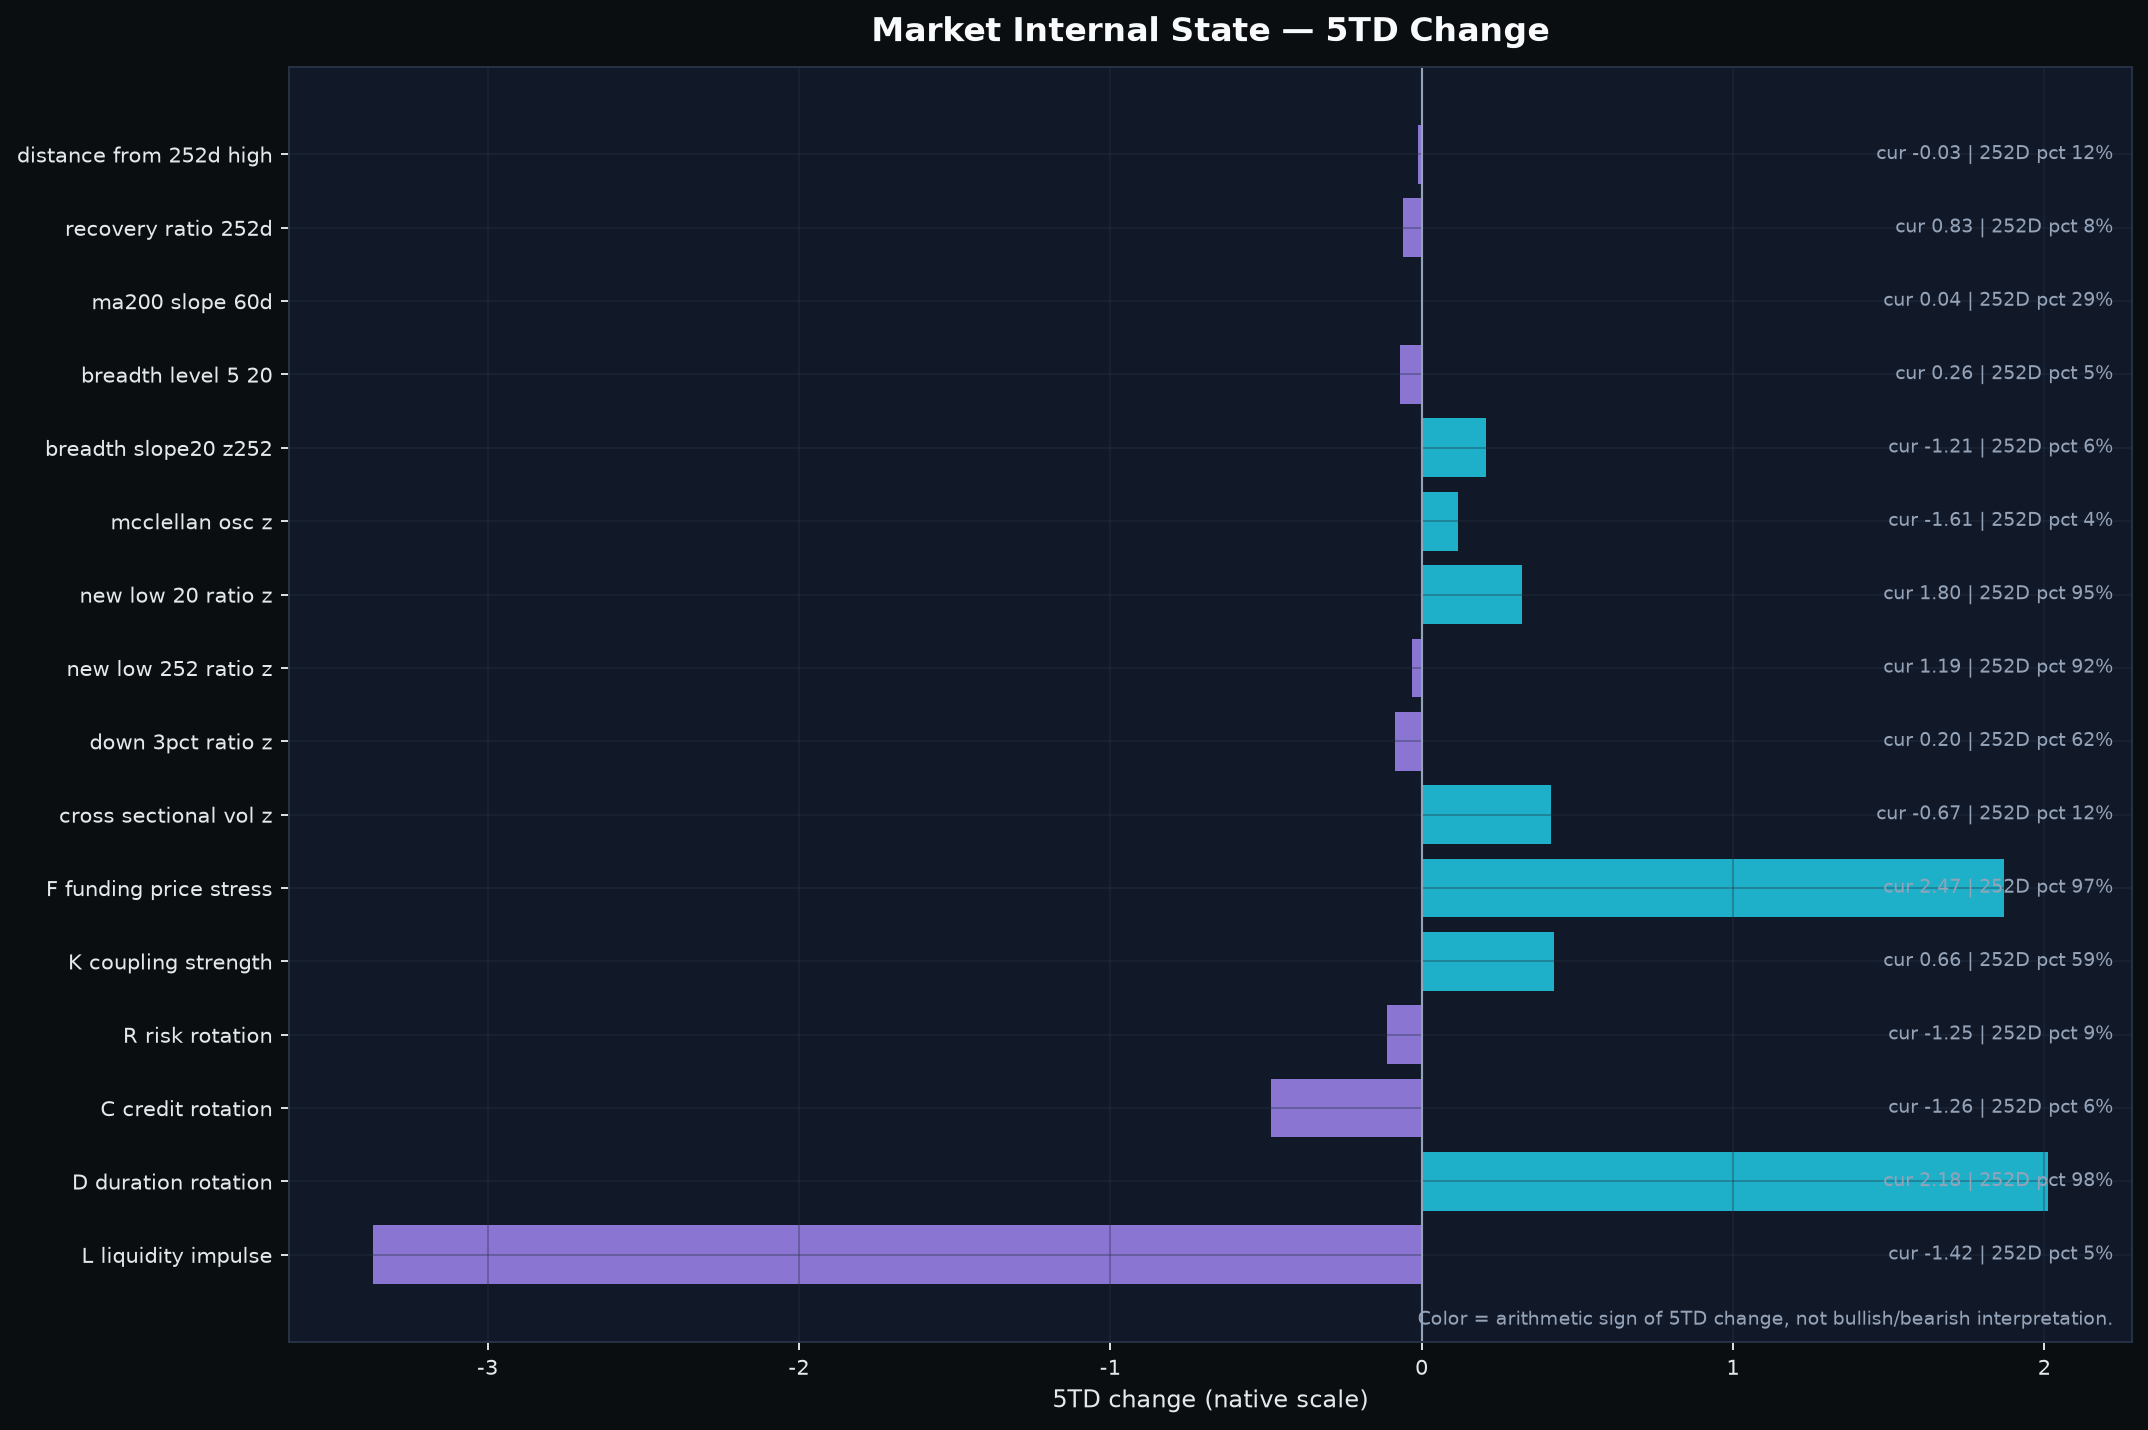
The market is under clear structural pressure, but the evidence still separates persistent weakness from a full damage cascade. The S&P 500 closed 0.65% below its five-day average and 1.44% below its 20-day average; the Nasdaq Composite is also below both. Both short averages are falling. More important, breadth is only 0.261 and sits at the 4.8th percentile of its trailing history after another five-day deterioration.
| Measure | Latest | vs MA5 | vs MA20 | Public read |
|---|---|---|---|---|
| S&P 500 | 7,551.81 | -0.65% | -1.44% | Below falling MA5 and MA20 |
| Nasdaq Composite | 25,978.42 | -0.51% | -1.00% | Below falling MA5 and MA20 |
| Breadth level | 0.261 | -- | -- | 5D change -0.069; 4.8th percentile |
| Discount-rate pressure shock | +2.47 z | -- | -- | 97.2th percentile; tightening pressure elevated |
| 252D new-low pressure, recent 20D max | +1.81 z | -- | -- | Elevated structural damage memory, not a standalone crash signal |
| Cross-sectional-vol 42D spike memory | 4.0 z | -- | -- | Stress memory remains extreme |
| Synchronized risk breadth >= +2z | 0 | -- | -- | Propagation state remains inactive |
Breadth and damage answer different questions. Breadth at 0.261 says participation is already narrow, while inactive synchronized damage says weakness has not yet become indiscriminate liquidation. That also explains how relative sector leadership can broaden without broad stock support: a sector may simply be weakening less than the market. Missing damage synchronization argues against a completed systemic break; extreme-low breadth argues against clean broadening. Breadth stabilization before damage activates would favor selective repricing, while new breadth lows plus synchronized damage would show the broader sector map developing inside a deteriorating market.
2. The final hour repaired the trough, not the market state
September 16 was weaker than a simple late-bounce description suggests. Aggressor Flow opened below neutral at 48.0 and deteriorated through the day. Depth Pressure briefly moved above 50 in the second bar, then slipped back below neutral. Flow/Depth Alignment started near neutral and fell sharply into the afternoon. The same-time percentile compressed from 42.5 at the open to 10 by the final two bars.
| Checkpoint | Aggressor | Depth | Alignment | Same-time pct. | Bull aligned | Bear aligned | Buy absorption | Sell absorption | EW 60m return |
|---|---|---|---|---|---|---|---|---|---|
| 09:30 open | 48.0 | 50.0 | 49.3 | 42.5 | 17.6% | 19.0% | 18.6% | 14.9% | -0.10% |
| 10:30 early | 47.8 | 50.4 | 47.3 | 22.5 | 14.2% | 19.7% | 18.0% | 14.2% | +0.25% |
| 12:30 midday | 47.3 | 50.0 | 44.6 | 20.0 | 10.8% | 21.7% | 19.7% | 15.6% | +0.01% |
| 14:30 late | 46.8 | 48.8 | 40.2 | 10.0 | 5.4% | 25.1% | 17.3% | 13.2% | -1.38% |
| 15:30 close | 46.8 | 49.7 | 42.5 | 10.0 | 8.8% | 23.7% | 18.0% | 8.5% | +0.62% |
The broader late window was deterioration: from 13:30 to the close, Aggressor Flow fell about 0.26 point and Alignment lost about 2.54 points. The final hour then repaired part of that damage. From 14:30 to the close, Aggressor was essentially flat (-0.06), Depth improved +0.86 and Alignment improved +2.37. Bull-aligned breadth rose 3.39 percentage points and Bear-aligned breadth fell 1.36 points, while the final equal-weight bar turned positive.
That final-hour breadth response is more constructive than the state level, but it does not erase the absolute close. Aggressor finished at 46.76, Depth at 49.67 and Alignment at 42.54. The closing neutral-reclaim burdens were therefore 3.24 points for Aggressor, 0.33 for Depth and 7.46 for Alignment. The asymmetry matters: Depth was almost back to neutral, while execution pressure and especially flow/depth agreement remained materially weaker. That is consistent with stabilization at the edge of the market without broad confirmation across the state axes. The correct description is final-hour partial repair without full neutral reclaim, not a repaired market.
The next session inherits a high repair burden, and the sequence matters. Depth above 50 while Aggressor and Alignment remain below neutral would be superficial stabilization. A sustained three-axis reclaim with stronger Bull-aligned breadth and equal-weight price would support genuine state repair. A renewed Depth failure with weaker breadth and synchronized damage would mark a failed repair. Genuine sector broadening should eventually appear in both market-wide execution and a wider set of defended stocks.
3. The Fed hike explains the rate shock, but cross-asset evidence is not one-direction risk-off
The macro backdrop became more restrictive at the same time the internal market state weakened. At 2:00 p.m. EDT the Federal Reserve raised the federal-funds target range by 25 basis points to 3.75%-4.00%. The bundle independently shows a +2.38 z five-day funding-price shock driven by the two-year component, with the latest two-year extreme occurring on September 16. That is a clean coincidence between public policy timing and the private discount-rate-pressure layer, without requiring the article to infer hidden causality from one indicator.
| Cross-asset observation | Current read | Interpretation constraint |
|---|---|---|
| Funding-price shock | +2.38 z over 5TD; 2-year driver | Fresh tightening impulse; still pre-transmission in the current framework |
| Equity relative preference | 20D change -0.274; top recipient industrial metals | Price-implied relative preference, not observed dollar flow |
| Credit risk appetite | latest standardized state -1.26 | Weak credit preference is a macro headwind, but not a same-day flow measure |
| Cross-asset coupling | level z +0.66; 20D change +0.026 | Moderate coupling, not a synchronized panic lockstep |
| CFTC timing | latest report Sep. 8; 6 trading days old | Weekly positioning context only; cannot describe Sep. 16 same-day positioning |
Reuters reported higher Treasury yields, a stronger dollar and an equity reversal after the rate decision. That confirms a restrictive discount-rate backdrop, but not a single synchronized risk-off trade: industrial metals lead the relative-preference map, cross-asset coupling is only moderately elevated, and CFTC data are too delayed to adjudicate September 16. Cross-asset evidence therefore constrains rather than replaces the equity thesis. A sharp rise in coupling, weaker credit preference and propagating equity damage would strengthen the broad-downside case; absent that combination, the macro layer supports caution rather than capitulation.
4. Sector leadership broadened, but the quality of that broadening is uneven
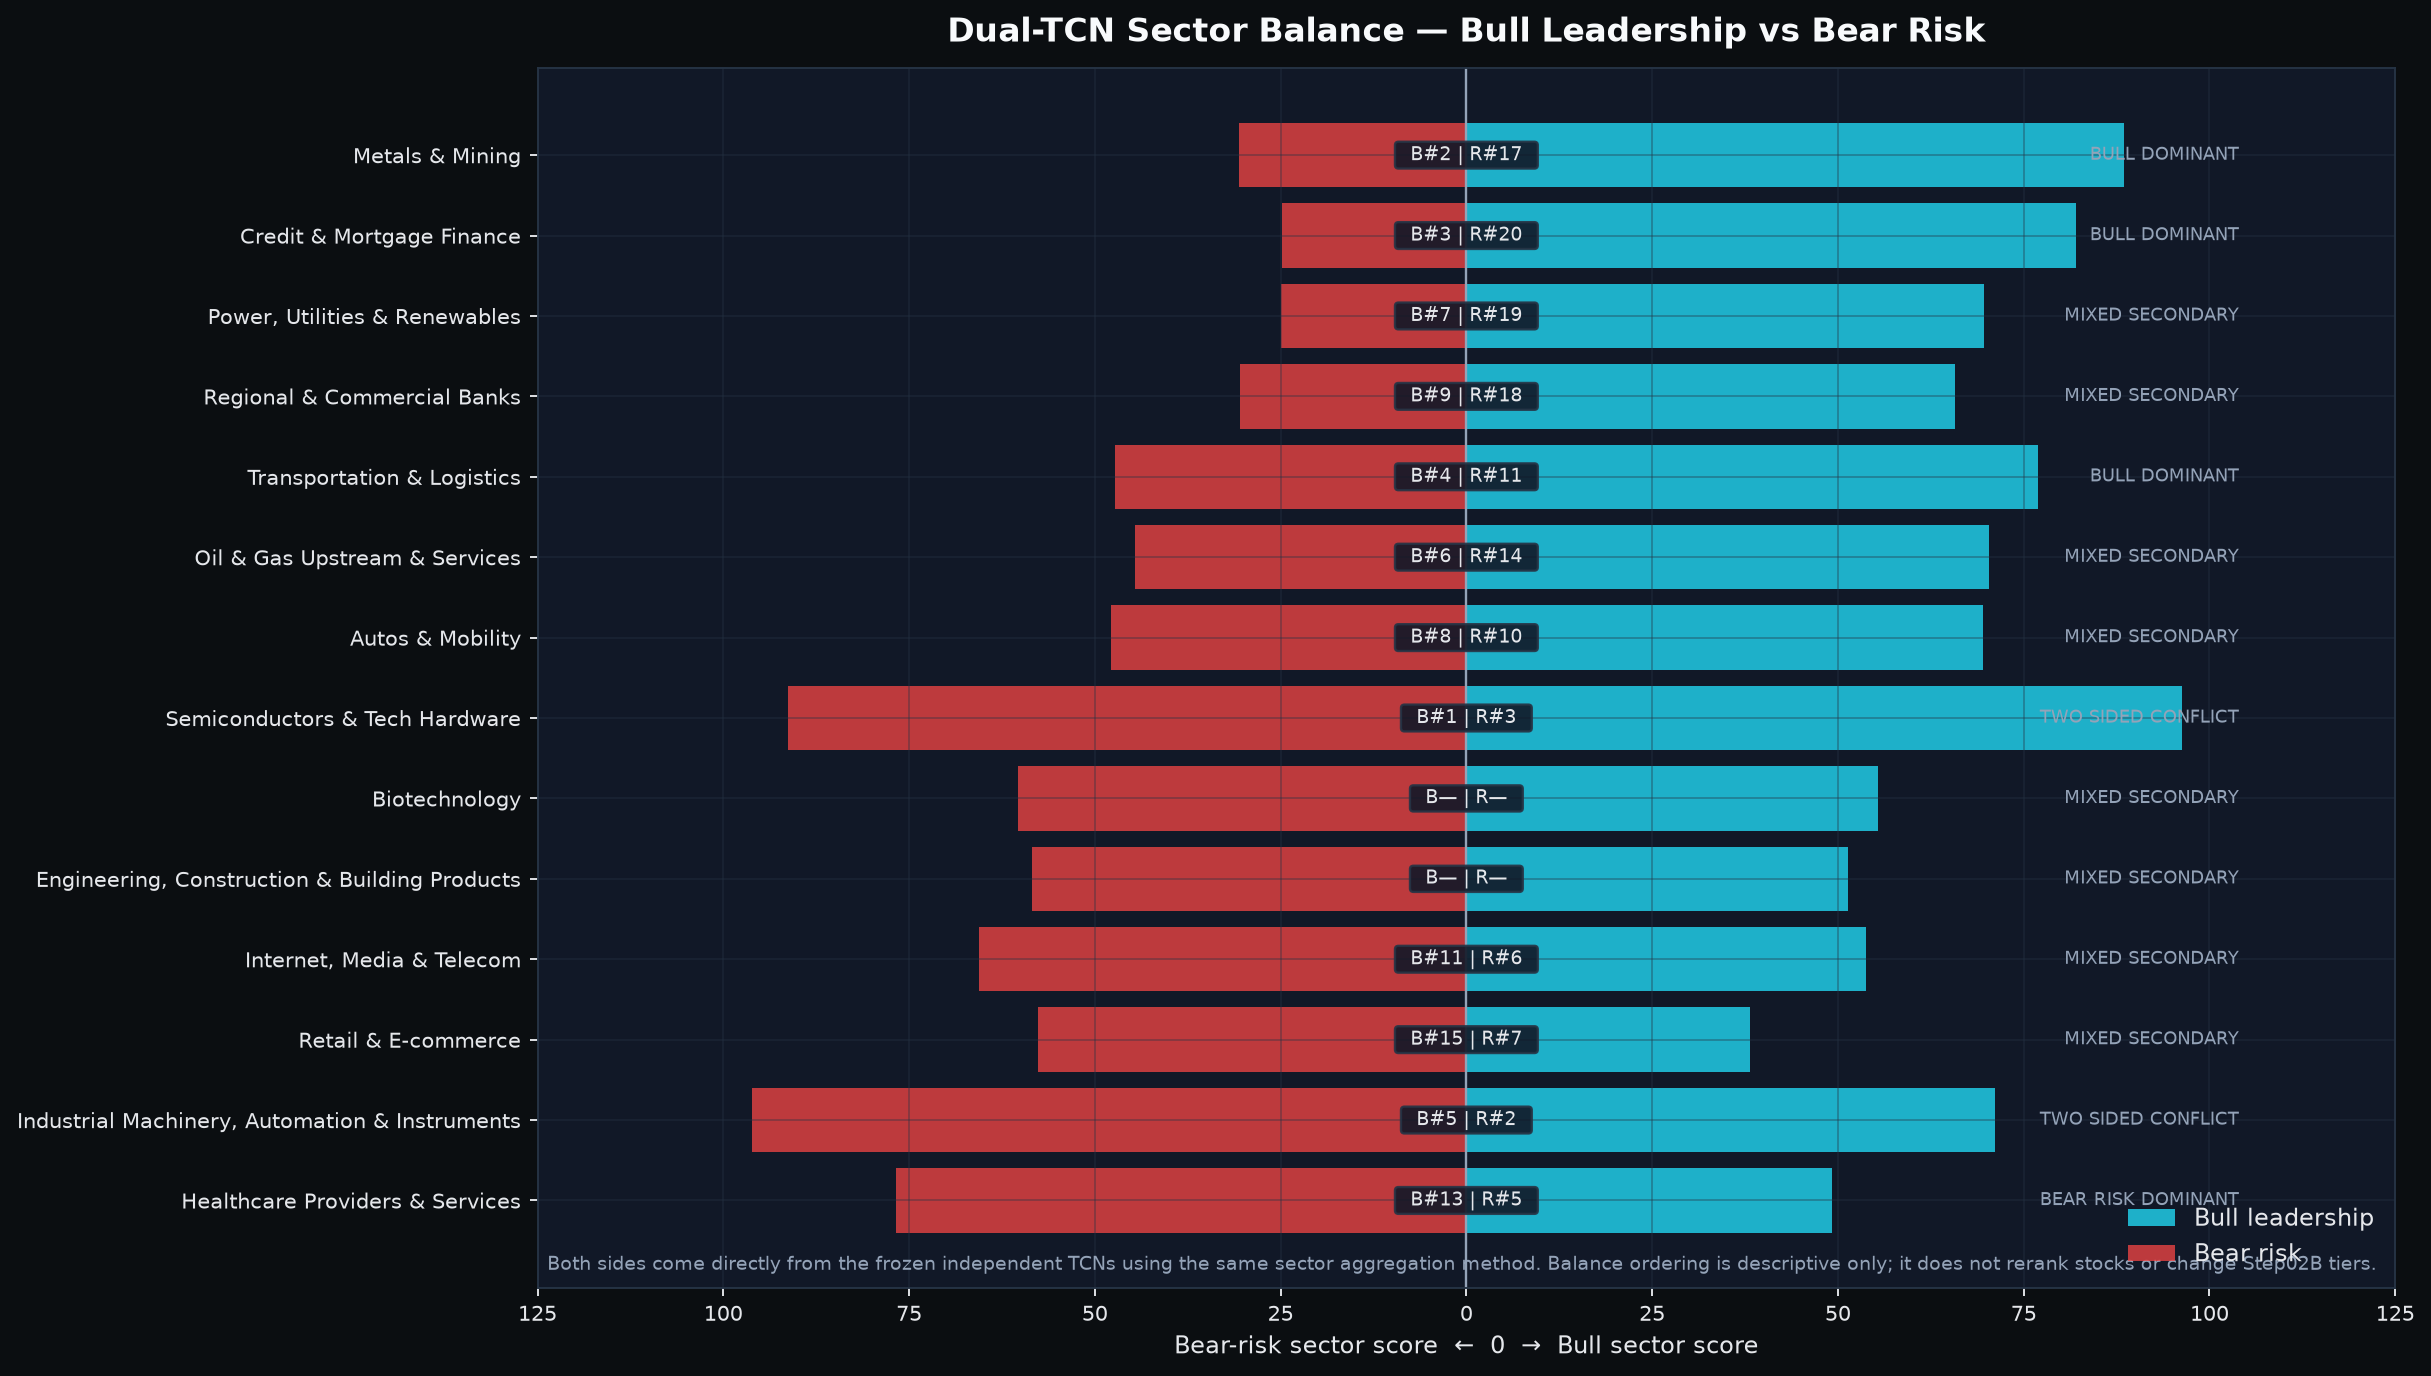
The Bull Top 5 is broader than the final stock set, so the gap is a test rather than proof of healthy broadening. Semiconductors moved to #1 but remain two-sided; metals, credit/mortgage and transportation entered the stored Top 5, while industrial machinery remains conflicted. Relative ranks can reflect genuine broadening, sectors that are merely declining less, or narrow internal leadership. The stock layer currently favors the latter two: eight of ten support-confirmed names are hardware, while metals and industrial machinery contribute none. Broadening is real at the ranking level, but incomplete at the price-confirmation level.
| Bull rank | Sector | Bear-risk rank | Balance state | Representative tickers | Public read |
|---|---|---|---|---|---|
| #1 | Semiconductors & Tech Hardware | #3 | Two Sided Conflict | SWKS, WDC, SNDK, STX, IONQ, ON, ASTS | two-sided/conflicted |
| #2 | Metals & Mining | #23 | Bull Dominant | CDE, HL, NEM, VALE, B, FCX | Bull-dominant, but requires price confirmation |
| #3 | Credit & Mortgage Finance | #26 | Bull Dominant | AGNC, RKT, SOFI, COF, PYPL, V, MA | Bull-dominant, but requires price confirmation |
| #4 | Transportation & Logistics | #15 | Bull Dominant | AAL, UAL, UNP, DAL, UPS, CSX | Bull-dominant, but requires price confirmation |
| #5 | Industrial Machinery, Automation & Instruments | #2 | Two Sided Conflict | SMR, VRT, GEV, COHR, BE, CAT, CMI | two-sided/conflicted |
| Sector | Current leading subcluster(s) | Key names | Economic linkage | Quant / price-support confirmation | Why now / public mechanism | Strongest counterevidence |
|---|---|---|---|---|---|---|
| Semiconductors & Tech Hardware | storage / memory / AI compute; plus high-beta specialty hardware | SNDK, WDC, STX, MU, AMD; IONQ/ASTS/ONDS as specialty edge names | Shared AI/data-infrastructure spend, memory/storage demand and high-performance compute; specialty names are adjacent risk assets rather than one supply chain. | Eight of ten selected stocks come from this sector; SNDK and WDC are near live support while AMD remains above MA20. | Sandisk reported datacenter revenue up 437% for FY2026, while Micron described tight AI-memory supply. | Bear-risk rank #3; SNDK/WDC/STX/MU are still below MA20, and Micron faces an unresolved Taiwan labor dispute. |
| Metals & Mining | precious and industrial metals | CDE, HL, NEM, VALE, B, FCX | Commodity-price sensitivity and real-asset exposure; industrial-metals relative preference also appears in the cross-asset layer. | No final support-confirmed stock from this sector; several representative names are below short-term averages. | No single public catalyst cleanly explains the rank move; the signal is better treated as relative preference than a news trade. | Gold fell after the Fed hike and stronger dollar; several representatives have broken recent five-day support. |
| Credit & Mortgage Finance | mortgage origination / servicing and consumer finance | RKT, AGNC, SOFI, COF | Housing-finance sensitivity to long yields and mortgage rates, with company-specific origination/servicing economics. | RKT is the only final selected stock; it remains near live support but below MA20. | Rocket reported record purchase/refinance market share and its most profitable quarter in four years in Q2. | Mortgage rates reached 6.76% and builder sentiment fell to a one-year low, a direct macro headwind. |
| Transportation & Logistics | passenger airlines | AAL, UAL, DAL | Shared exposure to travel demand, capacity discipline and jet-fuel costs. | AAL is the only final selected stock and remains within 0.27 ATR of live support. | Airlines reported resilient demand and stronger pricing, supporting revenue even as capacity is tightened. | The fuel shock is material: American estimated about $1 billion of additional Q4 fuel cost from the latest jump. |
| Industrial Machinery, Automation & Instruments | data-center power / grid equipment; nuclear-adjacent infrastructure | VRT, GEV, SMR, BE, COHR | AI/data-center buildout creates demand for power equipment, microgrids, generation and adjacent industrial systems. | No final selected stock from this sector despite Bull rank #5; several constituents show mixed short-term price geometry. | Vertiv is expanding microgrid and onsite-power capabilities to accelerate data-center time-to-power. | Bear-risk rank #2 makes this one of the most conflicted sectors despite the structural demand story. |
Semiconductors are the only Top 5 sector where rank leadership and stock support overlap at scale, but the anatomy is uneven. Support is concentrated in storage/memory - SNDK, WDC, MU and STX - with AMD as the cleaner trend control and IONQ/ASTS/ONDS as economically different specialty-growth names. Sandisk's datacenter growth and Micron's tight AI-memory backdrop support an operating-demand explanation, yet the branch remains below MA20 and the sector is Bear-risk #3. Support followed by moving-average repair would show operating strength transmitting into price; repeated failures would show that slow context is not enough.
Metals and industrial machinery are negative controls. Metals rank #2 Bull and industrial metals lead the cross-asset relative-preference map, yet the sector contributes no support-confirmed stock. Industrial machinery is #5 Bull but #2 Bear-risk and also contributes none. Relative strength without constituent confirmation can be an early signal or a narrow/defensive ranking effect. More defended constituents with lower Bear-risk would favor the former; persistently high ranks without broader support would favor transmission failure.
Credit/mortgage and transportation offer a different control because each contributes one selected stock. RKT and AAL hold support despite direct macro headwinds - higher mortgage rates and a fuel-cost shock - plus company-specific offsets. If they hold and peers begin to confirm, the wider ranks are gaining constituent breadth. If both fail while sector ranks remain elevated, the evidence favors idiosyncratic resilience inside a relative-ranking reshuffle.
The synthesis is a common high-rate/capital-scarcity backdrop plus sector-specific overlays, with incomplete sector-to-stock transmission. The map is therefore not a clean rotation; the test is whether broader ranks survive a weak market state and produce more defended stocks.
5. The support-confirmed stock set is narrow: eight of ten names are in hardware
The ten selected stocks are more useful as comparative controls than as ten separate stories. Eight are Semiconductors & Tech Hardware; AAL and RKT are the only non-hardware confirmations. The contrasts are therefore storage/memory support, AMD trend transmission, specialty-growth support with weaker slow confirmation, and company-specific resilience outside technology. The selected sequence remains fixed; the comparisons test mechanisms rather than rerank names.
| Stock | Sector | Selection tier/role | Bull rank (of N) | Bear rank (of N) | Live support distance | Recent support confirmation | vs MA20 | 5D return |
|---|---|---|---|---|---|---|---|---|
| SNDK | Semiconductors & Tech Hardware | A+ | #7 of 296 | #245 of 296 | 0.02 ATR | same-day bullish support reclaim | -3.8% | -13.8% |
| ONDS | Semiconductors & Tech Hardware | B | #29 of 296 | #85 of 296 | 0.04 ATR | same-day bullish support reclaim | -7.7% | -1.2% |
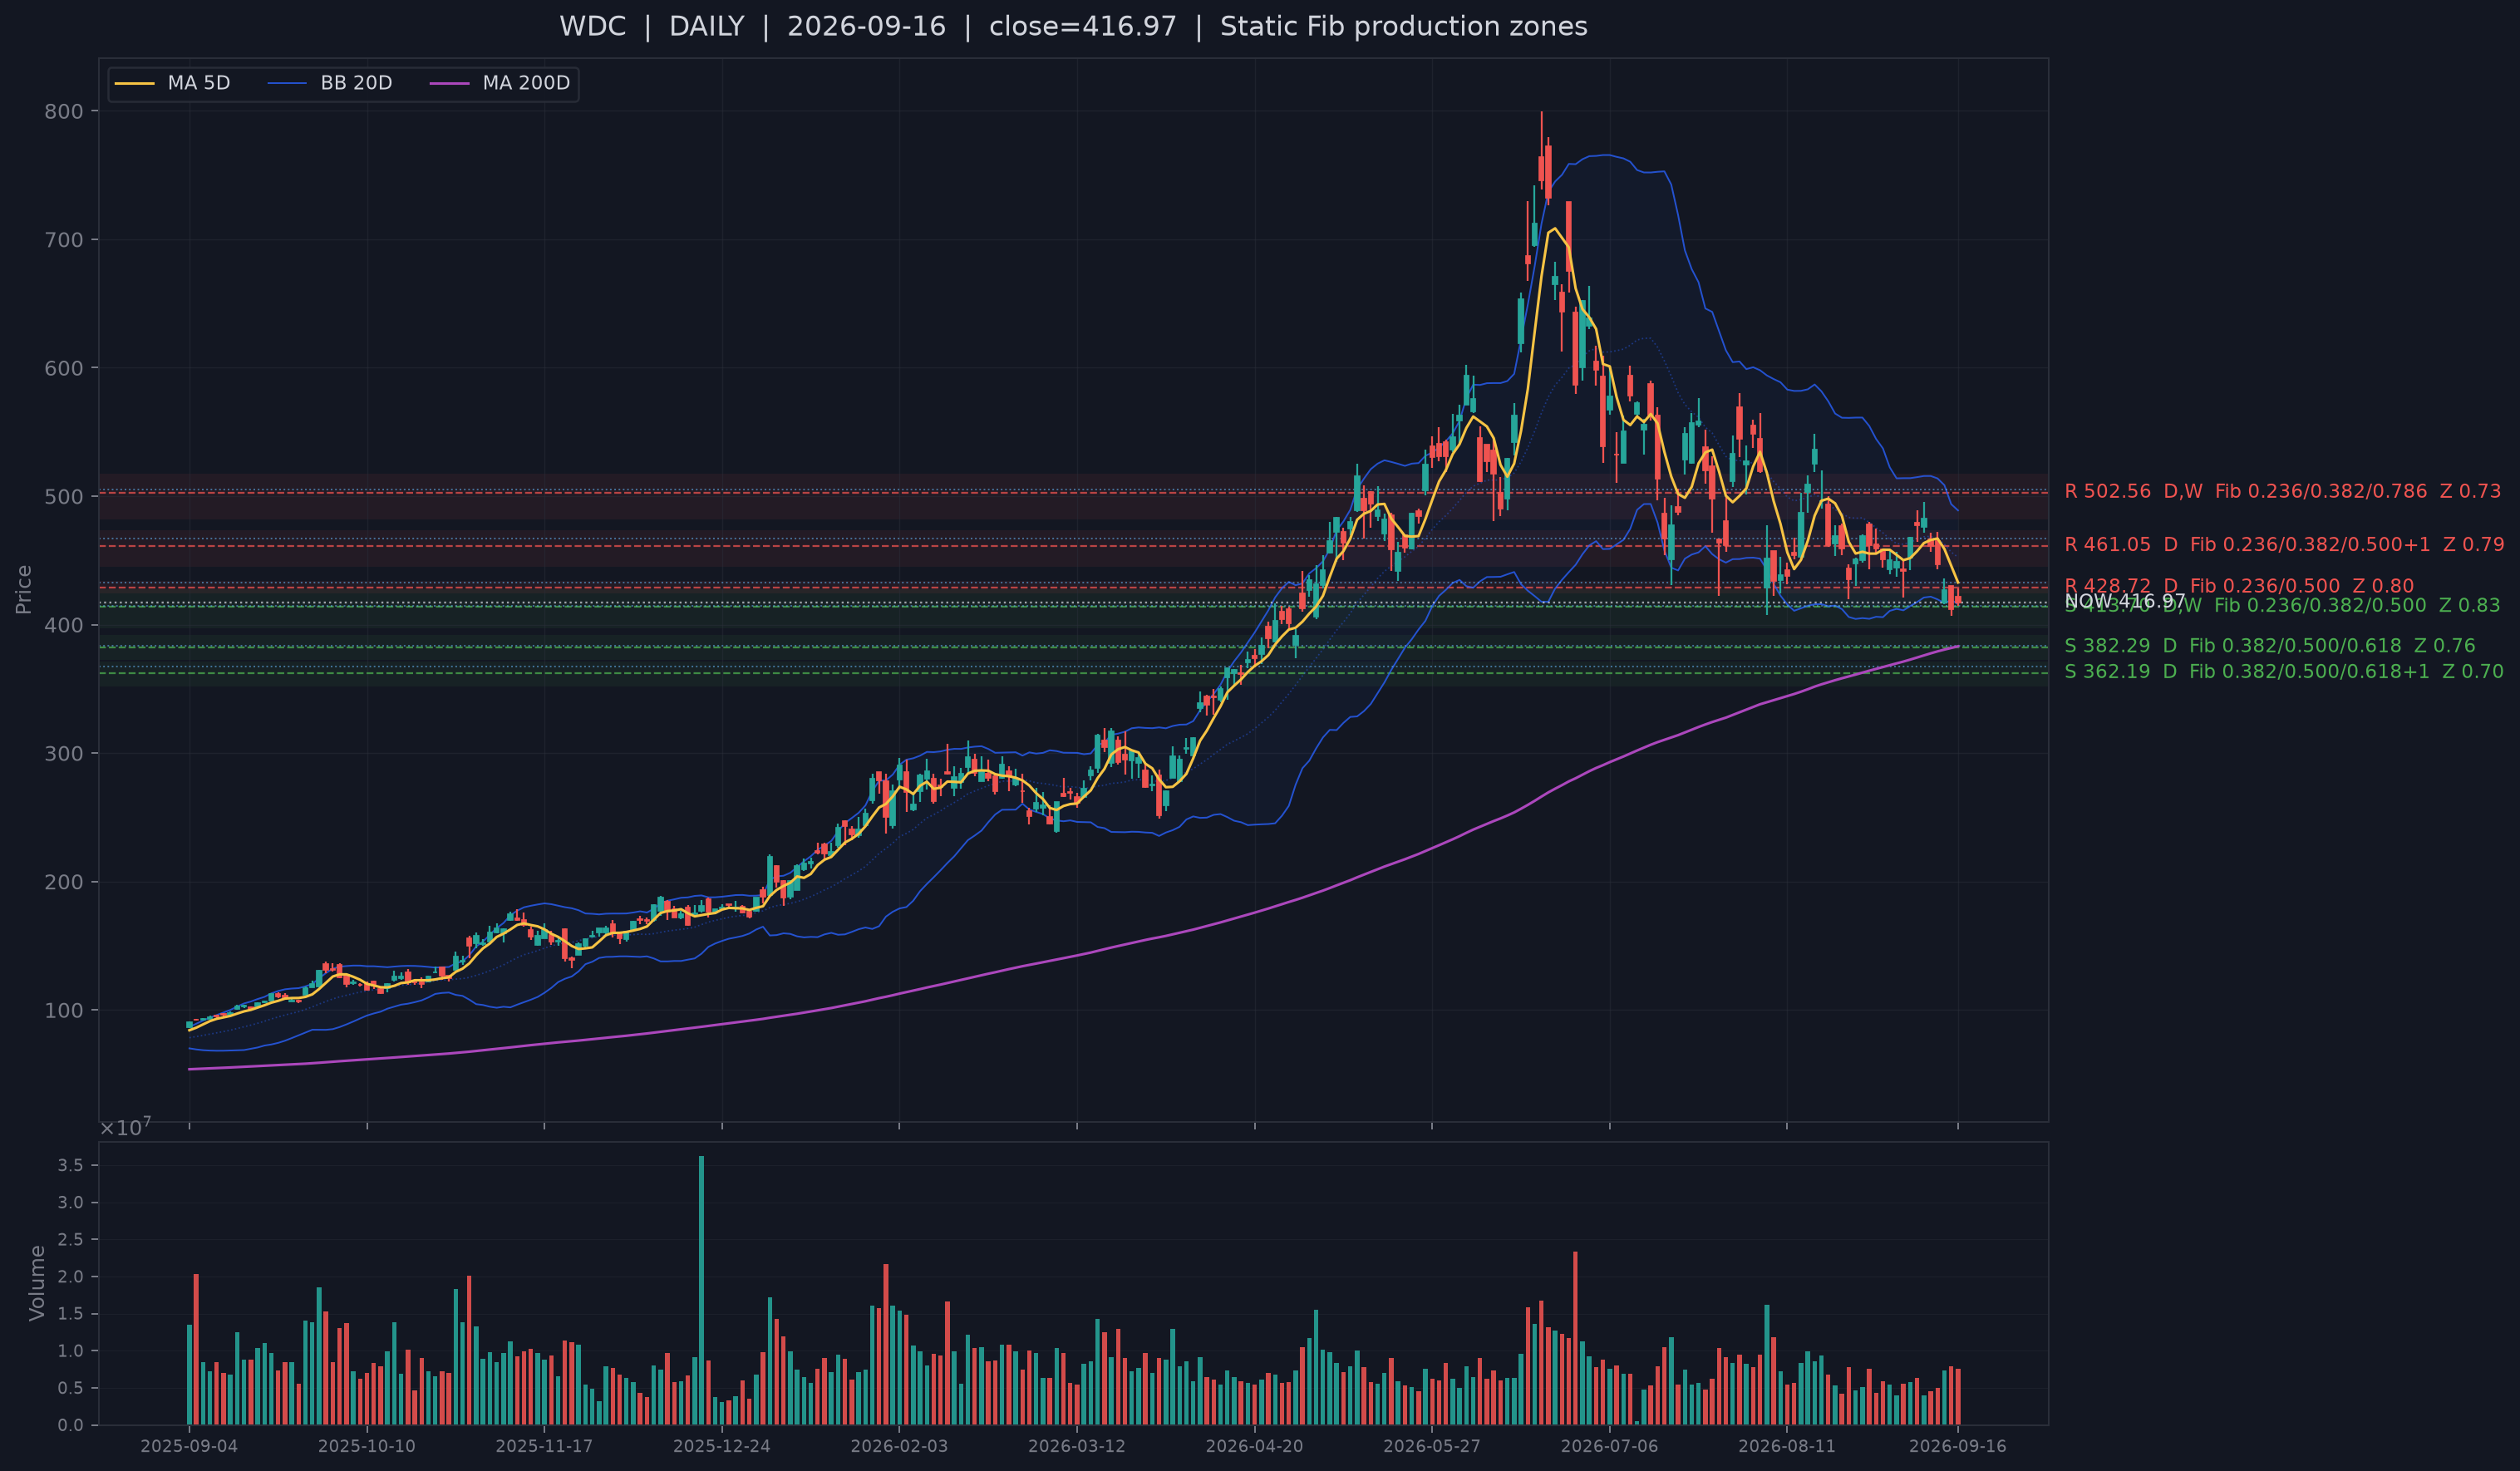
| WDC | Semiconductors & Tech Hardware | A+ | #6 of 296 | #188 of 296 | 0.11 ATR | same-day bullish support reclaim | -7.8% | -13.5% |
| IONQ | Semiconductors & Tech Hardware | A+ | #11 of 296 | #64 of 296 | 0.18 ATR | same-day bullish support reclaim | -6.9% | -3.4% |
| MU | Semiconductors & Tech Hardware | B | #20 of 296 | #183 of 296 | 0.23 ATR | same-day bullish support reclaim | -3.0% | -9.8% |
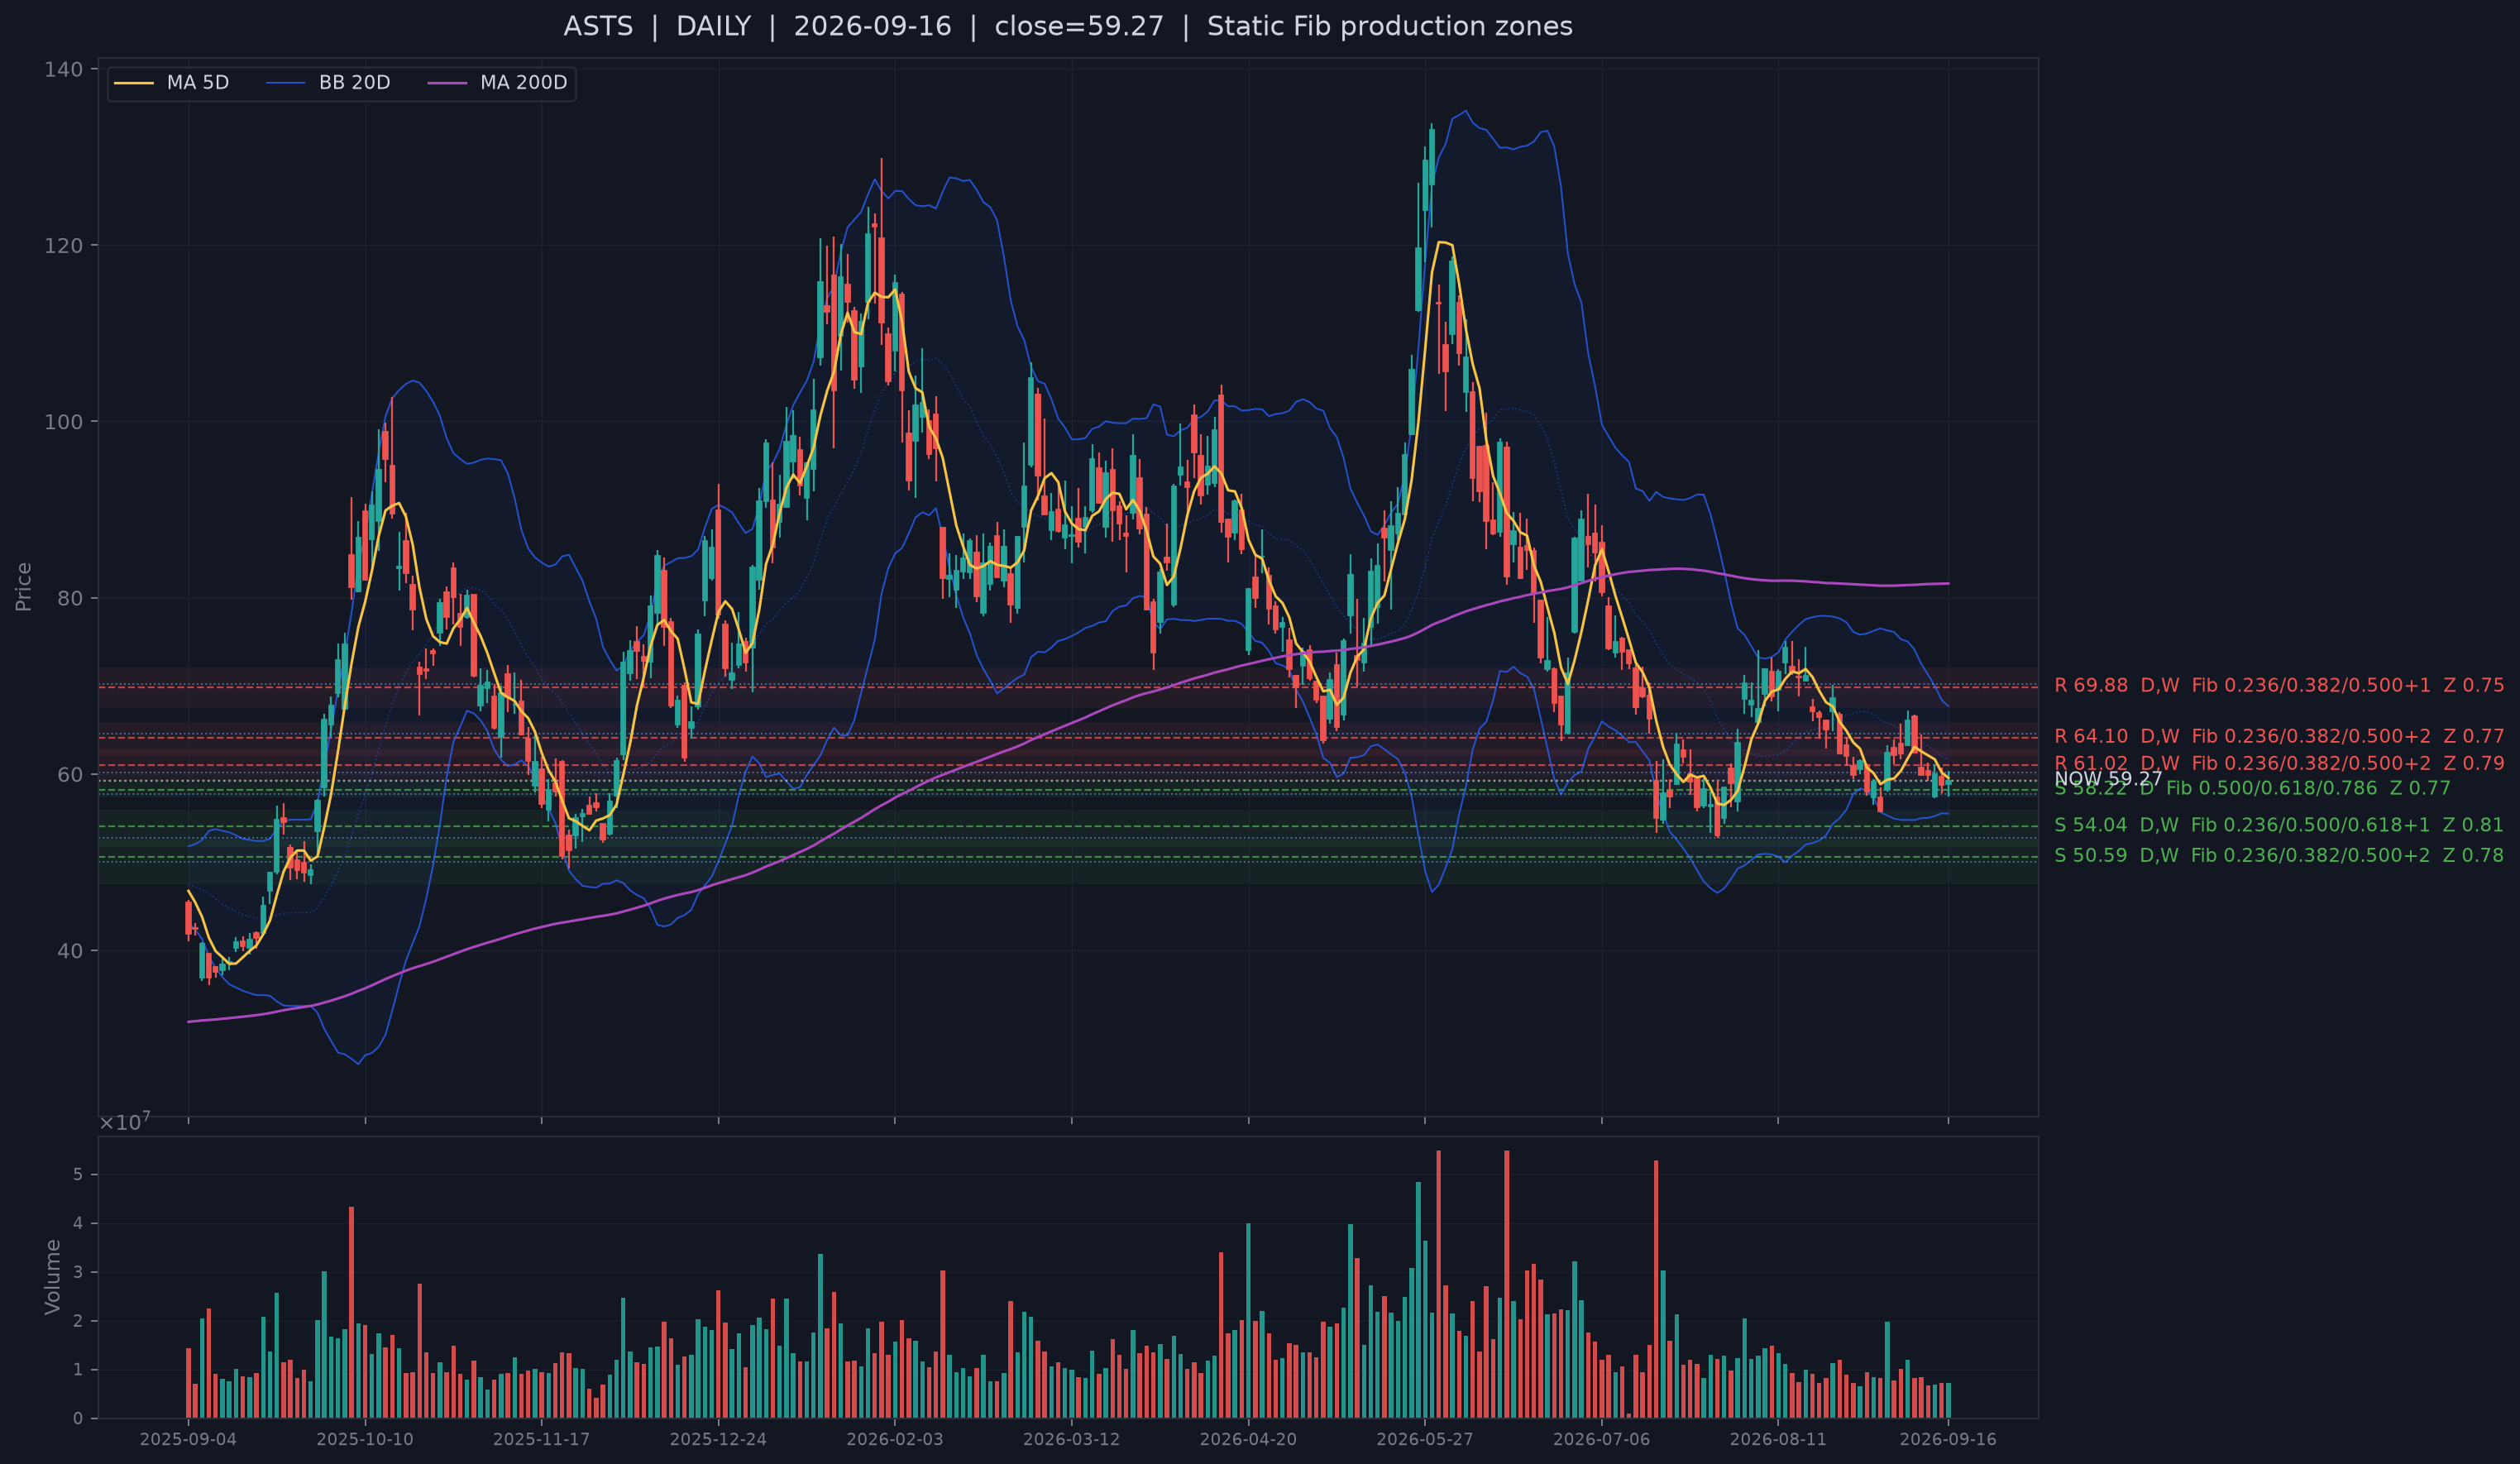
| ASTS | Semiconductors & Tech Hardware | B | #18 of 296 | #77 of 296 | 0.25 ATR | same-day bullish support reclaim | -3.8% | -5.0% |
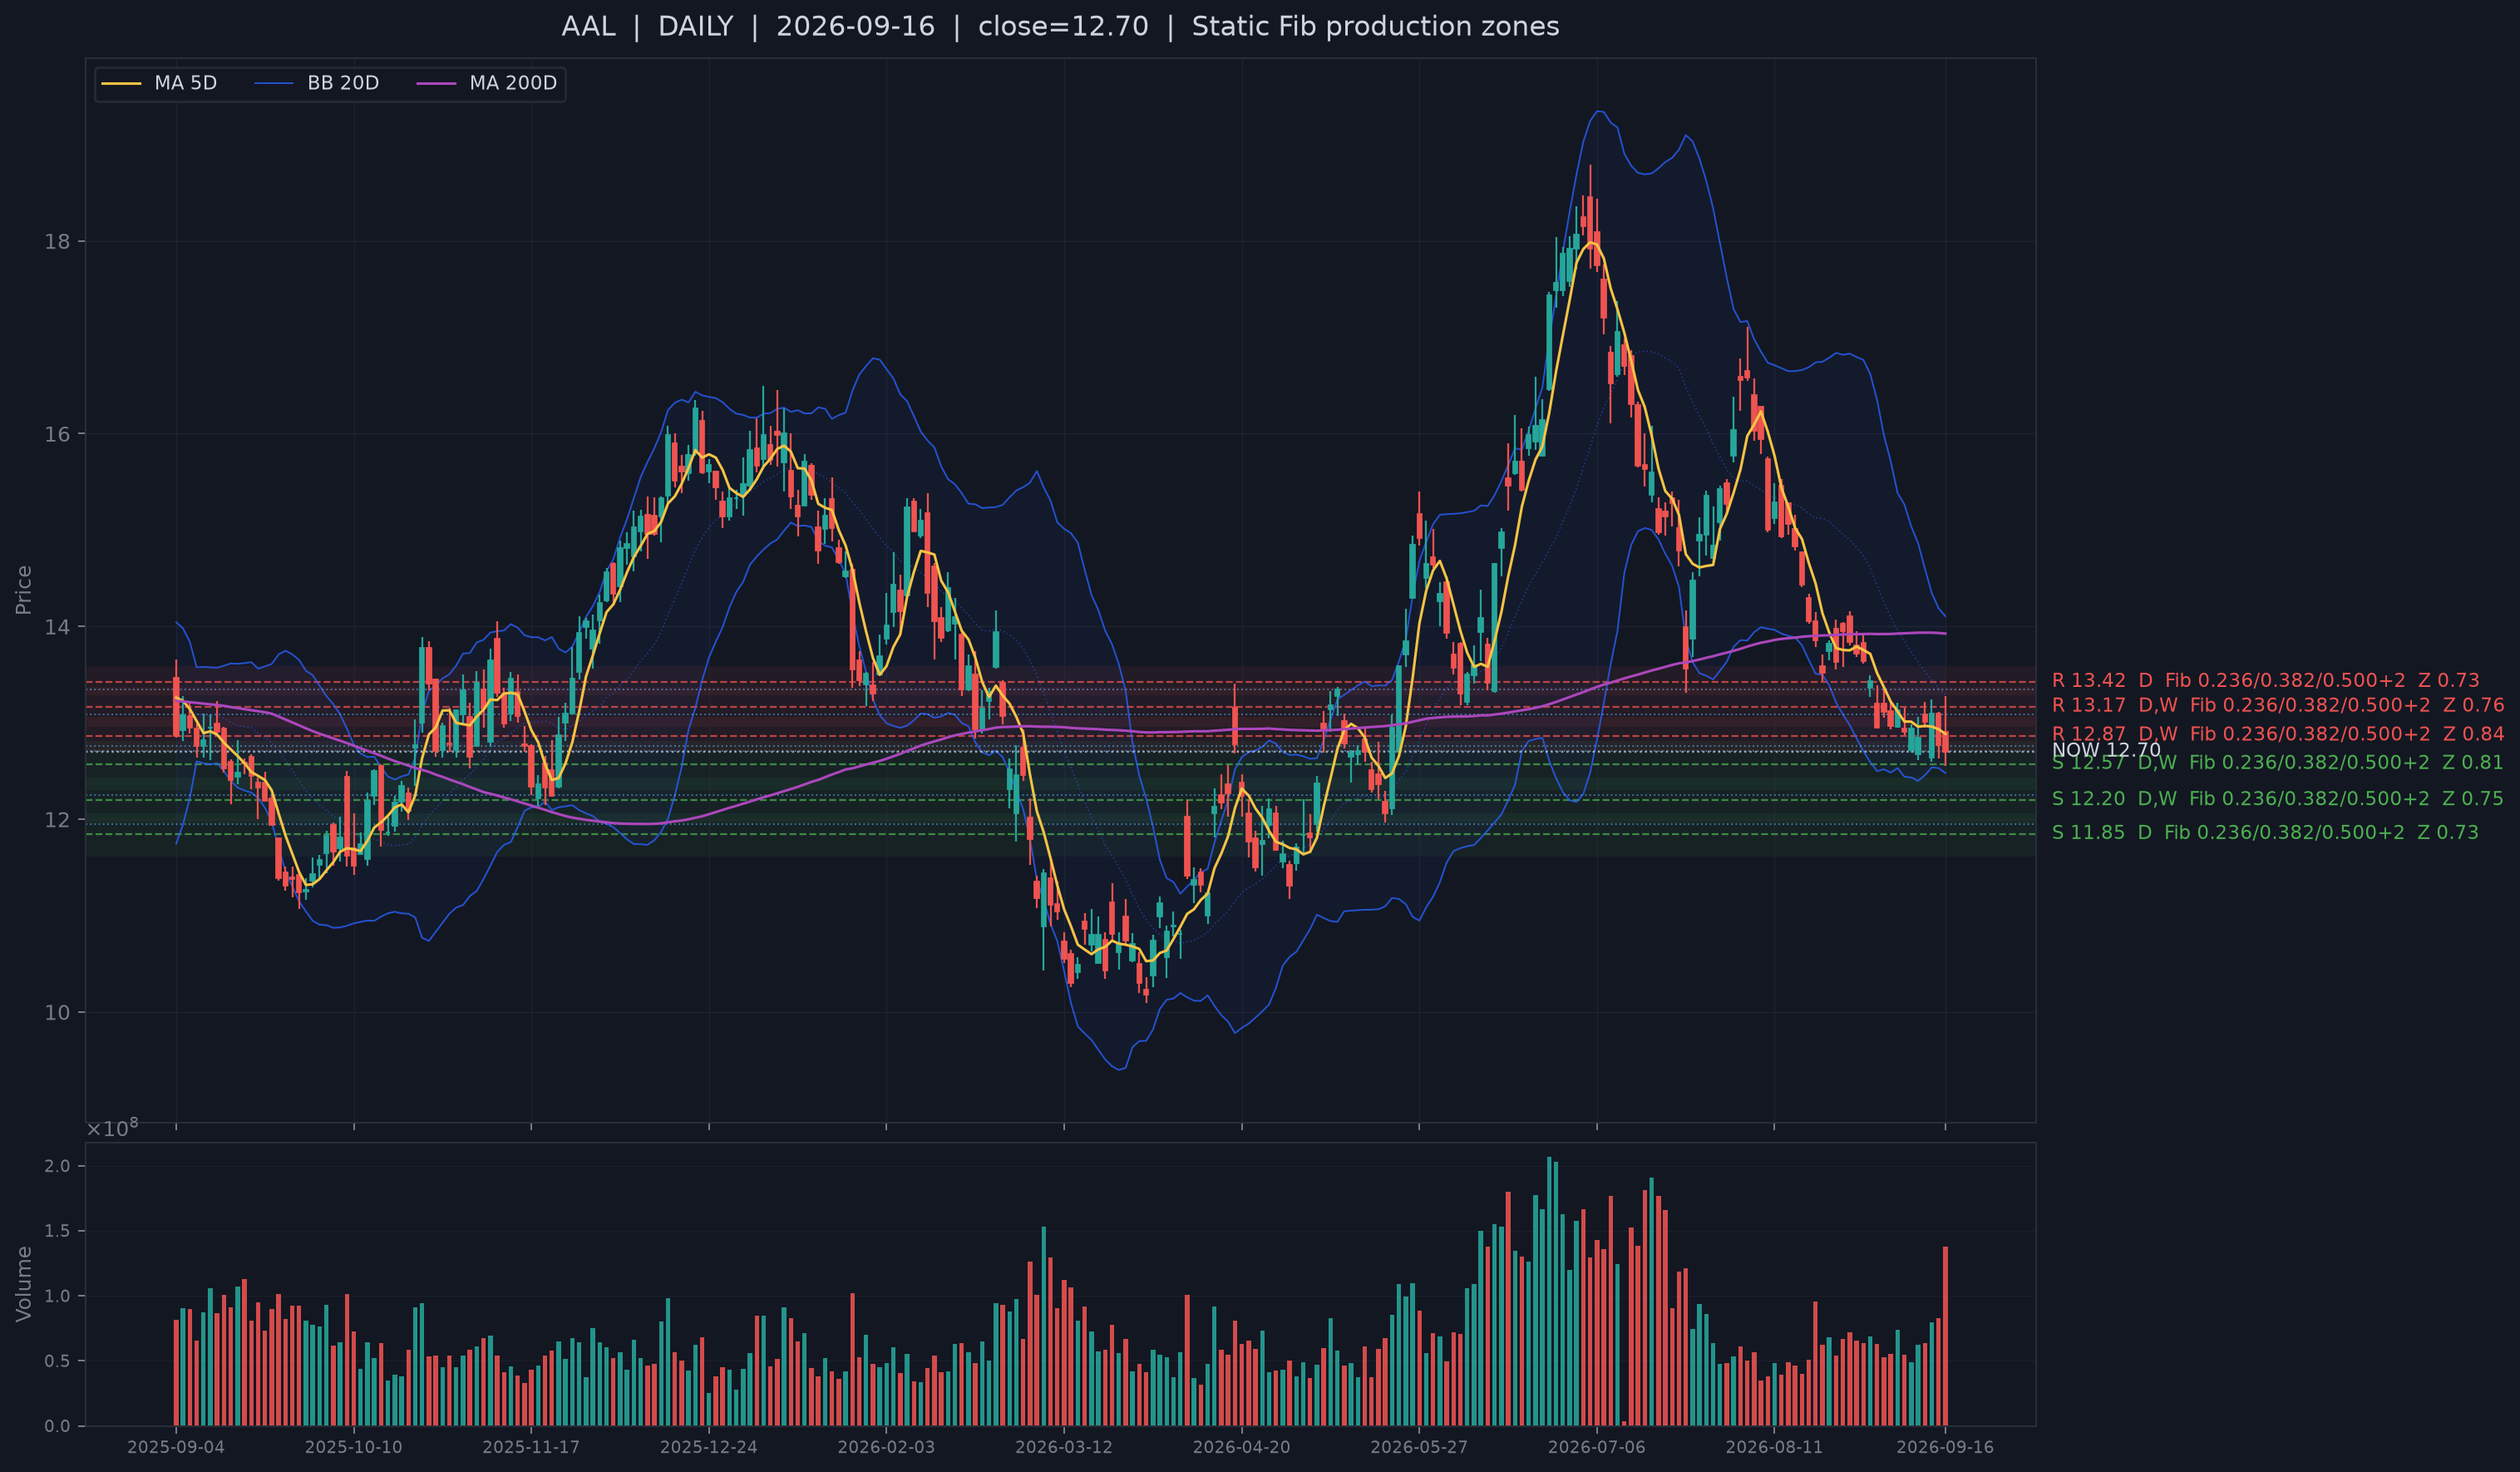
| AAL | Transportation & Logistics | B | #24 of 296 | #178 of 296 | 0.27 ATR | same-day bullish support reclaim | -4.5% | -1.9% |
| AMD | Semiconductors & Tech Hardware | B | #27 of 296 | #71 of 296 | 0.36 ATR | same-day bullish support reclaim | +6.3% | -1.6% |
| STX | Semiconductors & Tech Hardware | A+ | #8 of 296 | #106 of 296 | 0.39 ATR | next-day confirmation after a lower-wick test | -5.7% | -11.6% |
| RKT | Credit & Mortgage Finance | B | #19 of 296 | #172 of 296 | 0.42 ATR | same-day bullish support reclaim | -5.6% | -3.6% |
Storage and memory are the strongest support cluster, but the key issue is whether operating context can transmit into price. SNDK, WDC, STX and MU sit near structural support with strong financial-context ranks, while Sandisk's datacenter growth and Micron's AI-memory backdrop provide a coherent demand case. Yet all four remain below MA20 after sizable five-day declines. Either the rate shock compressed valuation faster than fundamentals deteriorated, or the slow context is stale and support is only delaying a break. Persistence alone is not enough; support must convert into higher lows and moving-average repair.
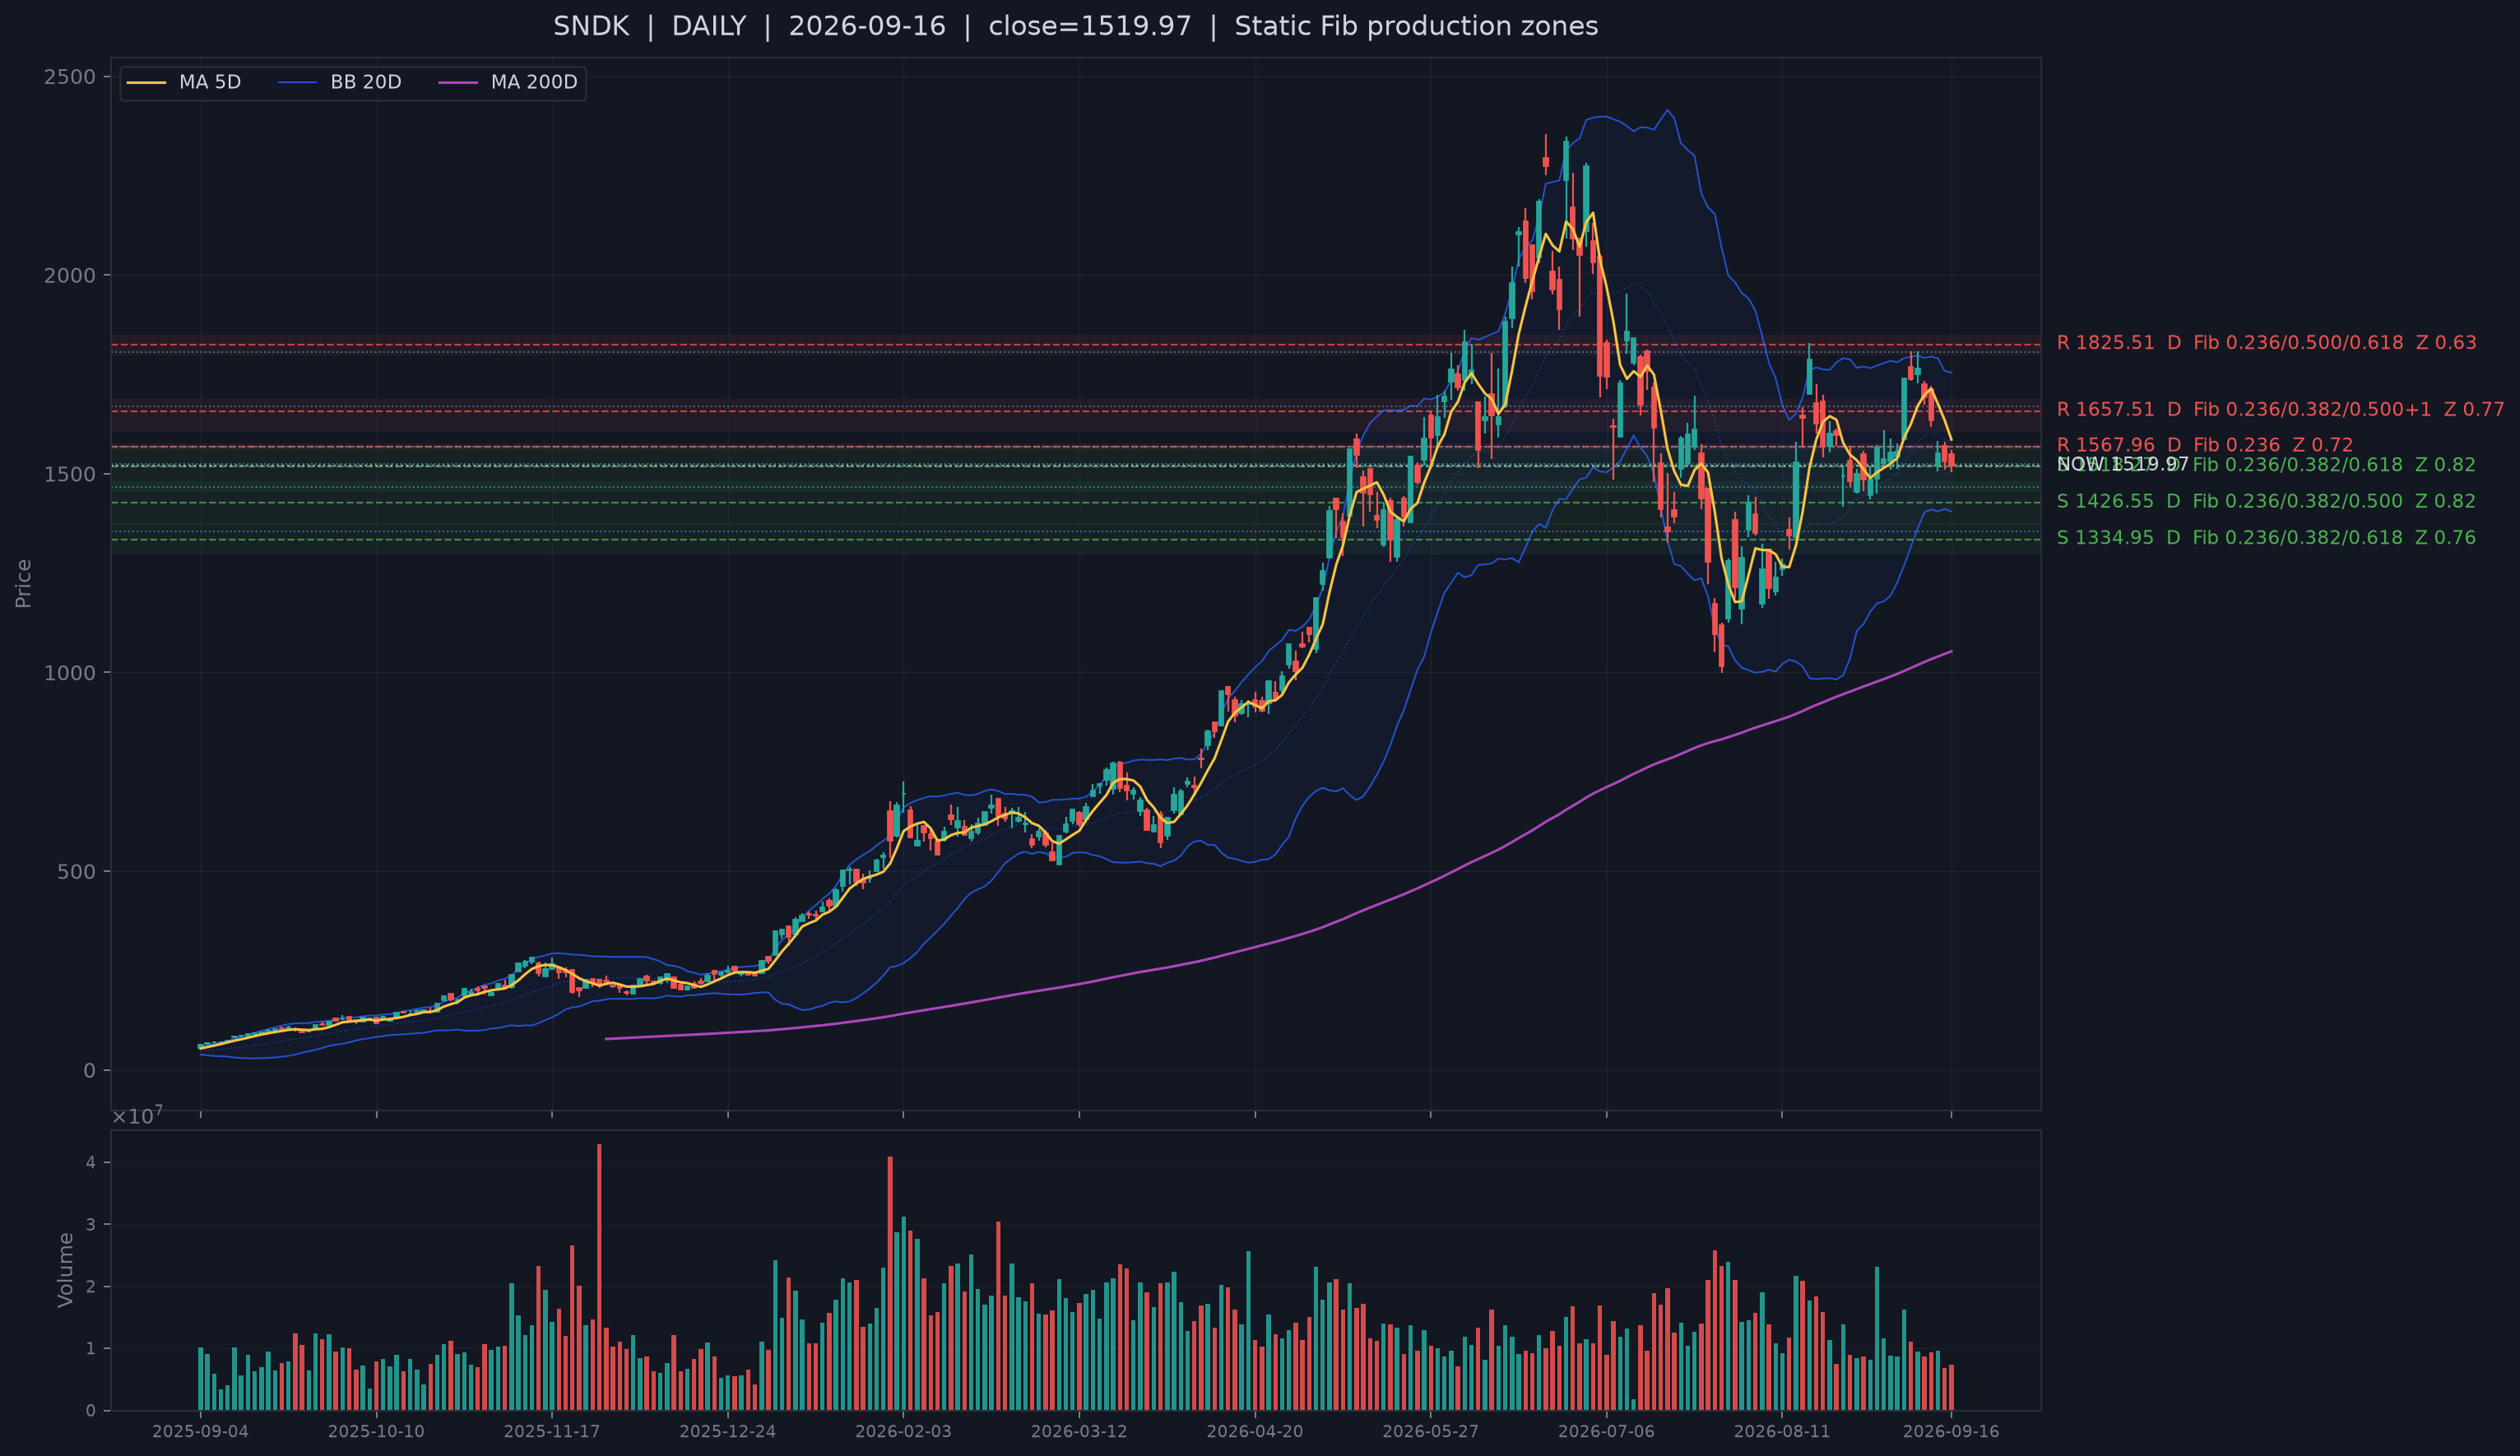
AMD is the cleaner price-transmission control. It is the only selected semiconductor materially above MA20 (+6.3%) despite sitting farther from support than SNDK or WDC. Storage/memory therefore has stronger support proximity and slow context but weaker trend; AMD has cleaner trend transmission. If storage reclaims MA20 while AMD stays firm, the evidence broadens into a wider technology repair. If storage repeatedly fails while AMD holds its trend, branch-specific weakness is the better explanation.
IONQ, ASTS and ONDS are a separate specialty-growth test. They share high-beta technology exposure but not one operating mechanism, and slow-layer confirmation is uneven: ASTS has a very weak financial rank, IONQ has secondary price-path/risk counterevidence, and ONDS has weak financial context despite stronger delayed holdings. With breadth at the 4.8th percentile, their support could reflect idiosyncratic demand, residual beta or a short-lived technical hold. Persistence through another weak session favors idiosyncratic resilience; early failures favor residual beta.
AAL and RKT are the non-hardware controls. AAL stays near support despite a fuel-cost shock; RKT does so despite higher mortgage rates and weaker builder sentiment. Their offsets are company-specific - resilient airline demand and Rocket's market-share/profitability improvement - rather than sector-wide macro tailwinds. If they hold and peers begin to confirm, sector broadening is gaining stock-level breadth. If they fail while hardware holds, the non-tech move was more likely a relative-ranking event.
6. Slower context confirms storage, but it does not repair the market
The slower layers are a persistence test, not a rescue signal. SNDK, WDC, MU, AMD and STX have the strongest slow context, but financial and delayed-holdings ranks lag the September 16 market evidence. Positive divergence can mean fundamentals/holdings are stronger than price, or that price has incorporated a new adverse regime first. It becomes constructive only if support persists and price repairs; otherwise slow strength is counterevidence to the decline, not proof the decline is wrong.
| Stock | Sector | Financial rank | Fin./price div. | Delayed holdings rank | Holdings/price div. | Price-path/risk context |
|---|---|---|---|---|---|---|
| SNDK | Semiconductors & Tech Hardware | 0.99 | +0.53 | 0.53 | +0.28 | not available for this selected name |
| ONDS | Semiconductors & Tech Hardware | 0.11 | +0.31 | 0.56 | +0.53 | not available for this selected name |
| WDC | Semiconductors & Tech Hardware | 0.98 | +0.57 | 0.72 | +0.53 | not available for this selected name |
| IONQ | Semiconductors & Tech Hardware | 0.35 | +0.43 | 0.18 | +0.27 | secondary price-path/risk context is counterevidence |
| MU | Semiconductors & Tech Hardware | 0.97 | +0.36 | 0.66 | +0.29 | secondary price-path/risk context is counterevidence |
| ASTS | Semiconductors & Tech Hardware | 0.02 | +0.23 | 0.64 | +0.64 | not available for this selected name |
| AAL | Transportation & Logistics | 0.33 | +0.12 | 0.43 | +0.12 | not available for this selected name |
| AMD | Semiconductors & Tech Hardware | 0.89 | +0.38 | 0.40 | +0.15 | not available for this selected name |
| STX | Semiconductors & Tech Hardware | 1.00 | +0.51 | 0.80 | +0.49 | secondary price-path/risk context is supportive |
| RKT | Credit & Mortgage Finance | 0.73 | +0.24 | 0.33 | +0.02 | not available for this selected name |
The secondary price-path/risk layer keeps the storage cluster from becoming one story: it supports STX but challenges MU, and IONQ also carries counterevidence. If names with stronger multi-layer confirmation lead the repair while counterevidence names lag, the framework is discriminating useful differences. If they all behave alike, the market-wide rate/liquidity state is probably dominating company-specific context.
7. Base case, confidence and falsifier
Base case - selective resilience with incomplete transmission, moderate confidence. Extreme-low breadth, three sub-neutral order-flow axes and the Fed-driven rate shock argue against taking the broader sector map at face value. But synchronized damage remains inactive, the final hour repaired part of the imbalance, and several sectors improved relatively. The evidence is therefore too weak for clean broadening but not synchronized enough for completed liquidation: a few support clusters are resilient while sector broadening still has to become absolute price repair.
What would strengthen genuine broadening: a sustained three-axis neutral reclaim, breadth stabilization before synchronized damage activates, and support spreading beyond hardware. Storage/memory should convert defended support into higher lows and moving-average repair, while AAL/RKT or other non-tech names add constituent confirmation.
What would favor failed transmission: broad sector ranks with no expansion in non-tech support, repeated order-flow stalls below neutral, and storage/memory failing to turn strong slow context into trend repair. A stronger falsifier is new breadth lows plus synchronized damage and multiple support failures; that would mark a shift from selective weakness to broader downside propagation.
Sources
- Federal Reserve - Federal Reserve issues FOMC statement (2026-09-16)
- Reuters - Stocks fall as Fed delivers hawkish rate hike (2026-09-16)
- Sandisk - Sandisk Reports Fiscal Fourth Quarter 2026 Financial Results (2026-08-05)
- Reuters - Micron Taiwan union presses profit-sharing demand, keeps strike preparations alive (2026-09-15)
- Rocket Companies - Rocket Companies Announces Second Quarter 2026 Results (2026-08-06)
- Reuters - US homebuilder sentiment drops to 12-month low in September (2026-09-16)
- Reuters - American, United, Southwest scale back schedules as fuel shock reshapes flying (2026-09-16)
- Reuters - Vertiv to buy Utility Innovation Group for up to $2.6 billion in data center push (2026-09-02)
Methodology note
Market Layers is a data-first multi-layer research process. Fast market, breadth and order-flow evidence is evaluated before slower financial statements and delayed institutional-holdings context. The proprietary stock rankings are cross-sectional research screens rather than literal probabilities. Recent structural support is the primary stock-level support confirmation; moving-average and return geometry are secondary descriptors. Cross-asset preference measures are price-implied and are not reported dollar fund flows. CFTC positioning is weekly and can materially lag daily price changes. Expected next-session range, when available, describes high-low amplitude rather than direction.