Late Repair Stopped Below Neutral as Two-Sided Leadership Kept Support Setups Selective
Both major indexes remained below falling short-term averages, breadth and new-low damage stayed weak, and a late order-flow repair failed to reclaim neutral. Stocks with recent support confirmation remain, but leadership is concentrated and conflicted.
Trading horizon: 3–10 trading days.
This research is designed for 3–10 trading-day swing setups. The signals and conclusions may not transfer to intraday trading or longer-horizon investing.
Key takeaway
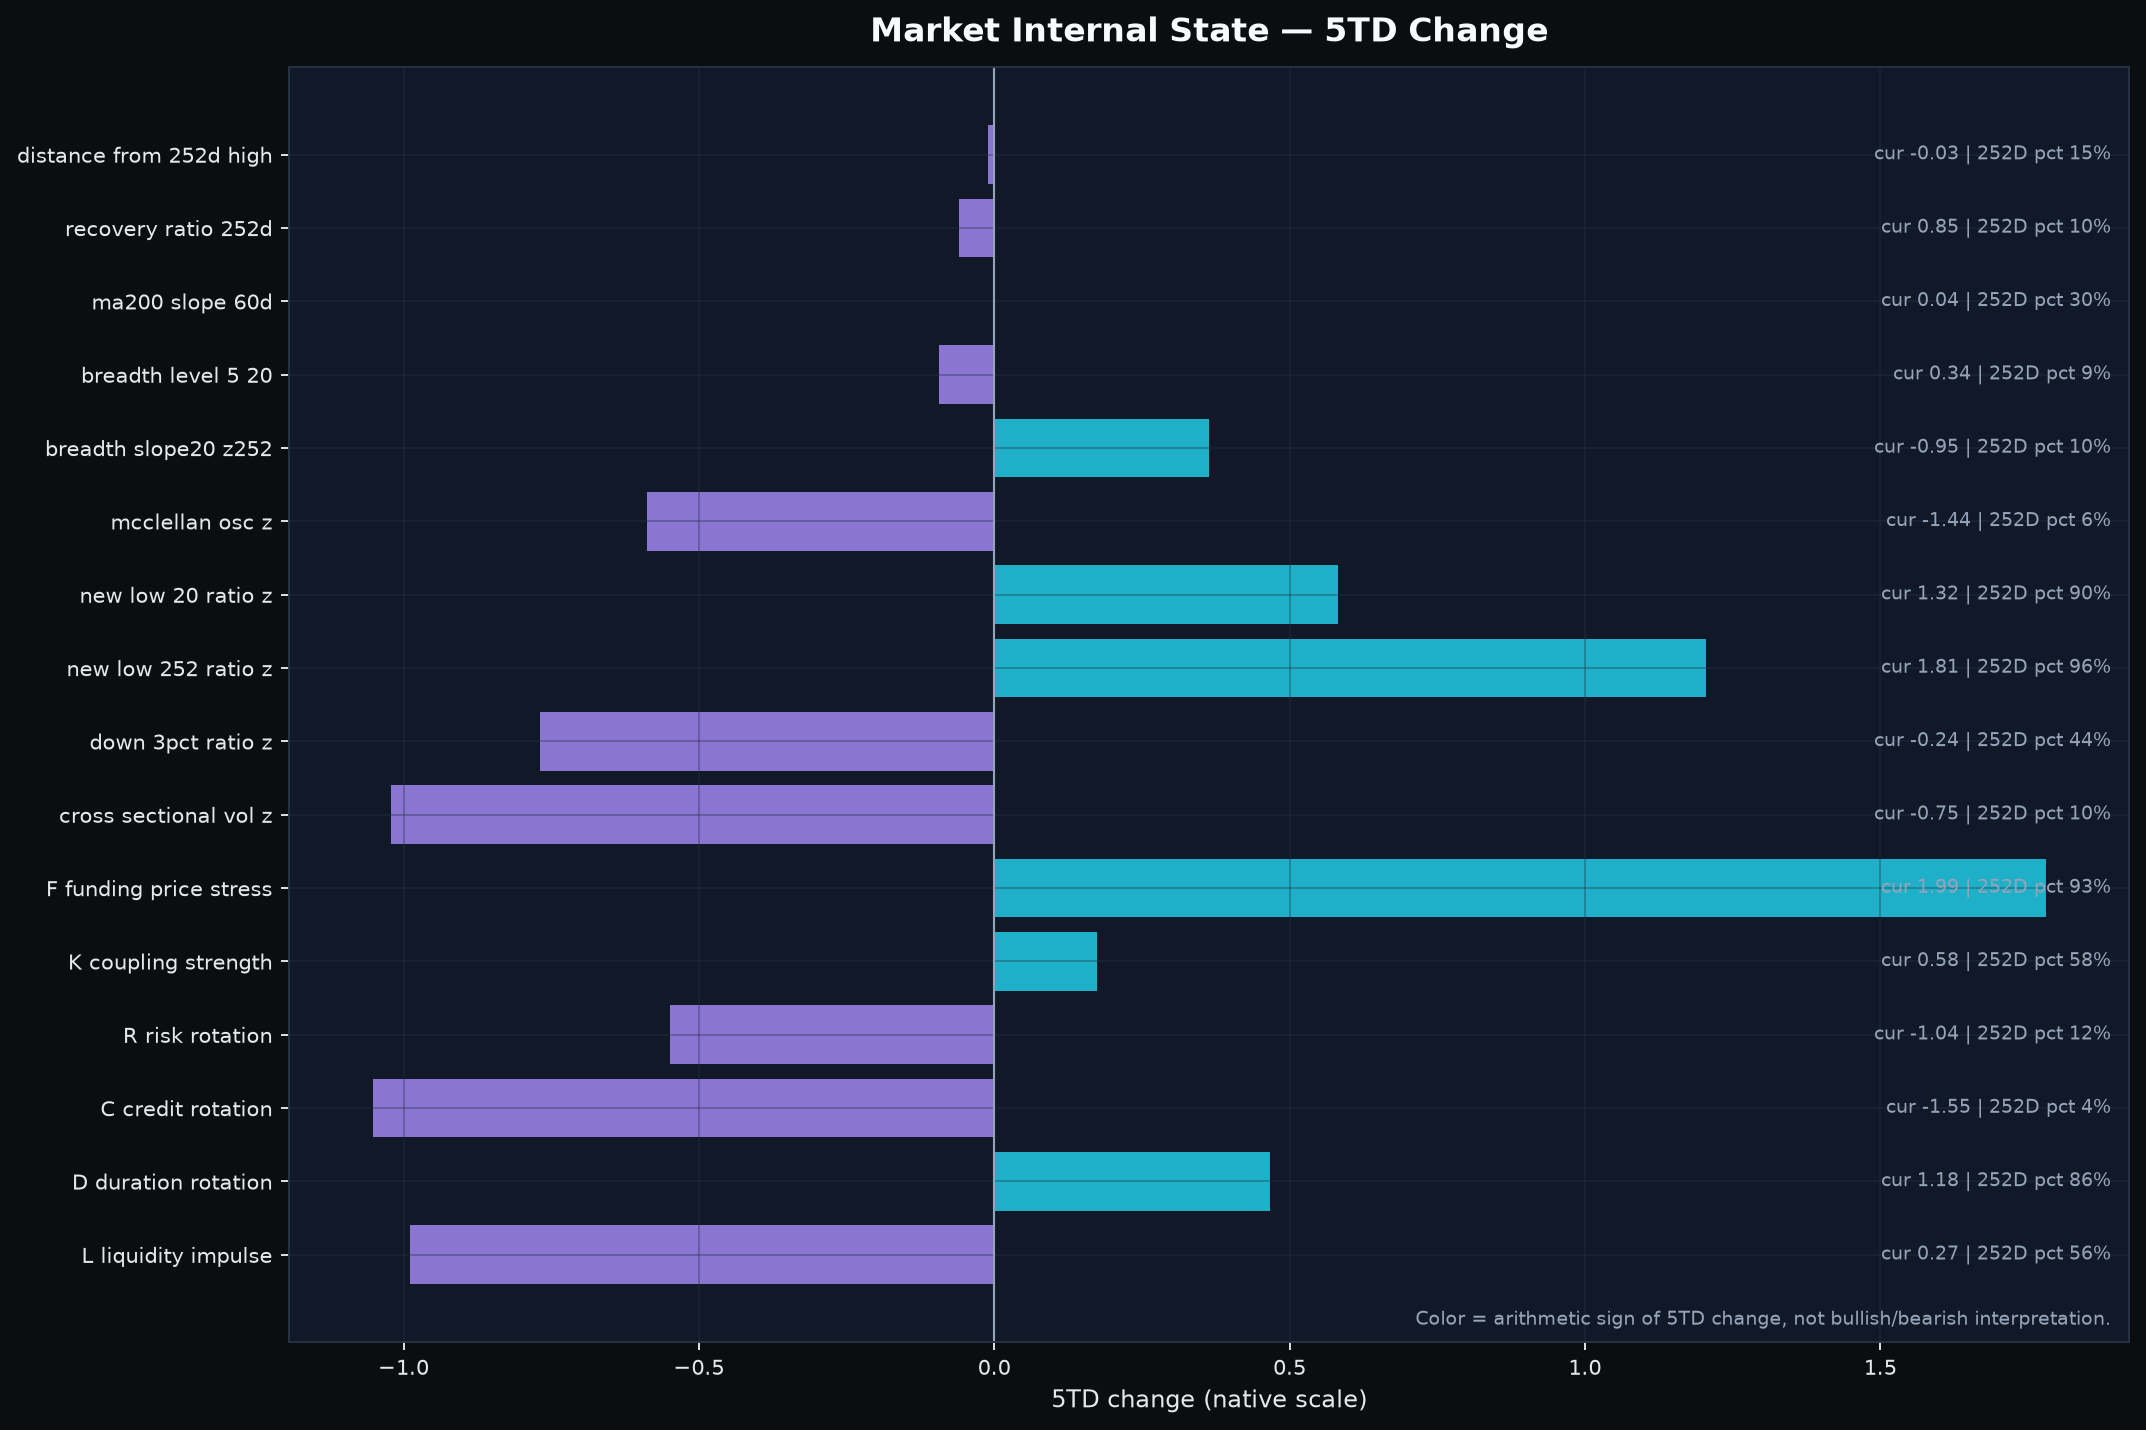
The market ended September 15 with a weak absolute state even though the final hour contained a visible repair attempt. Both the S&P 500 and Nasdaq Composite closed below falling 5- and 20-day averages, breadth slipped to 0.338, and 252-day new-low breadth reached +1.81 z. Market-wide Aggressor Flow, Depth Pressure and Flow/Depth Alignment all finished below their 50 neutral lines. That combination keeps the correction active rather than repaired.
What prevents this from becoming a clean liquidation call is the missing propagation layer. The standardized share of stocks falling at least 3% was only -0.24 z and cross-sectional volatility was -0.75 z. New lows are spreading, but broad large-decline damage and dispersion are not. The better description is selective structural damage inside an elevated warning state, not a completed cascade.
The stock opportunity set therefore depends on support quality, not on broad market permission. Ten stocks remain in the selected support set, but sector leadership is unusually two-sided: the top three Bull sectors are also ranked #2, #4 and #3 on Bear risk. The useful distinction is between names that merely sit near support and names that are actually converting support into price. ZS is the clearest positive control; SMR, VRT and OKLO show the opposite problem—fresh support inside still-damaged trends.
How to read today's indicators
| Indicator | Reader scale | Interpretation |
|---|---|---|
| Market-wide order-flow state | three component indices; 50 = neutral | Aggressor Flow, Depth Pressure and Flow/Depth Alignment answer different questions. Read confirmation/divergence across the three; they are not probabilities. |
| Same-time order-flow percentile | 0–100; 50 = same-time historical median | 90 is unusually strong and 10 unusually weak for that intraday slot. This is historical context, not event probability. |
| Flow × depth state breadth | cross-sectional percentages | Bull/Bear aligned show joint direction; absorption states describe compatible divergence only, not proven actor intent. |
| Market breadth | 0–1; practical balance ~0.50 | Above 0.50 means broader participation. Direction and slope show whether participation is improving or fading. |
| z-score | 0 = historical mean | |z| ~1 is notable and |z| ~2 is unusual. It is standardized distance, not probability. |
| Historical percentile | 0–100; 50 = median | 90+ is historically elevated. A percentile is not an event probability. |
| FLOW_SCORE_RANK | 0–1; 0.50 = median | 0.80+ is relatively strong slow context. It is confirmation/context, not a standalone entry signal. |
| Financial / 13F price divergence | approx. -1 to +1; 0 = little gap | Positive means slow context is ahead of price; negative means price is ahead. ±0.20 / ±0.50 are reader bands only, not learned thresholds. |
| Expected next-session range | non-directional high–low amplitude | Always pair the raw estimate with its same-day cross-sectional percentile. It is not an upside target. |
1. Price, breadth and damage say the correction is active — but not yet cascading
The weakness is broad enough to matter, but not broad enough to describe indiscriminate liquidation. Both major indexes are below falling MA5 and MA20, and breadth is in the bottom decile of its trailing history. New-low damage is the important escalation: the 252-day new-low measure is at the 96.4th percentile. Yet the two measures that would normally make the bearish branch much more dangerous—large single-day declines and cross-sectional volatility—remain ordinary to subdued.
| Measure | Latest | vs MA5 | vs MA20 | Public read |
|---|---|---|---|---|
| S&P 500 | 7,585.73 | -0.43% | -1.09% | MA5 and MA20 both falling; close in lower third of the day |
| Nasdaq Composite | 25,981.57 | -0.71% | -1.04% | MA5 and MA20 both falling; close near the day’s low |
| Breadth level | 0.338 | — | — | Weak; down 0.094 over five sessions; 8.7th historical percentile |
| 20-day new-low breadth | +1.32 z | — | — | Elevated; 89.7th percentile |
| 252-day new-low breadth | +1.81 z | — | — | Very elevated; 96.4th percentile |
| Stocks down ≥3% breadth | -0.24 z | — | — | Not broad liquidation; 44th percentile |
| Cross-sectional volatility | -0.75 z | — | — | Dispersion remains subdued; 9.5th percentile |
The asymmetry matters. A market can create more new lows because weakness is persistent and localized without simultaneously producing a high-volatility washout. That is what the current evidence looks like: more securities are falling into structurally weak territory, but the distribution of daily returns has not blown out. The next bearish confirmation is therefore not “another red index close” by itself. It is a joint move in which breadth remains weak, new lows stay elevated, and the large-decline/dispersion measures finally rise with them.
2. The final hour repaired the path, not the state
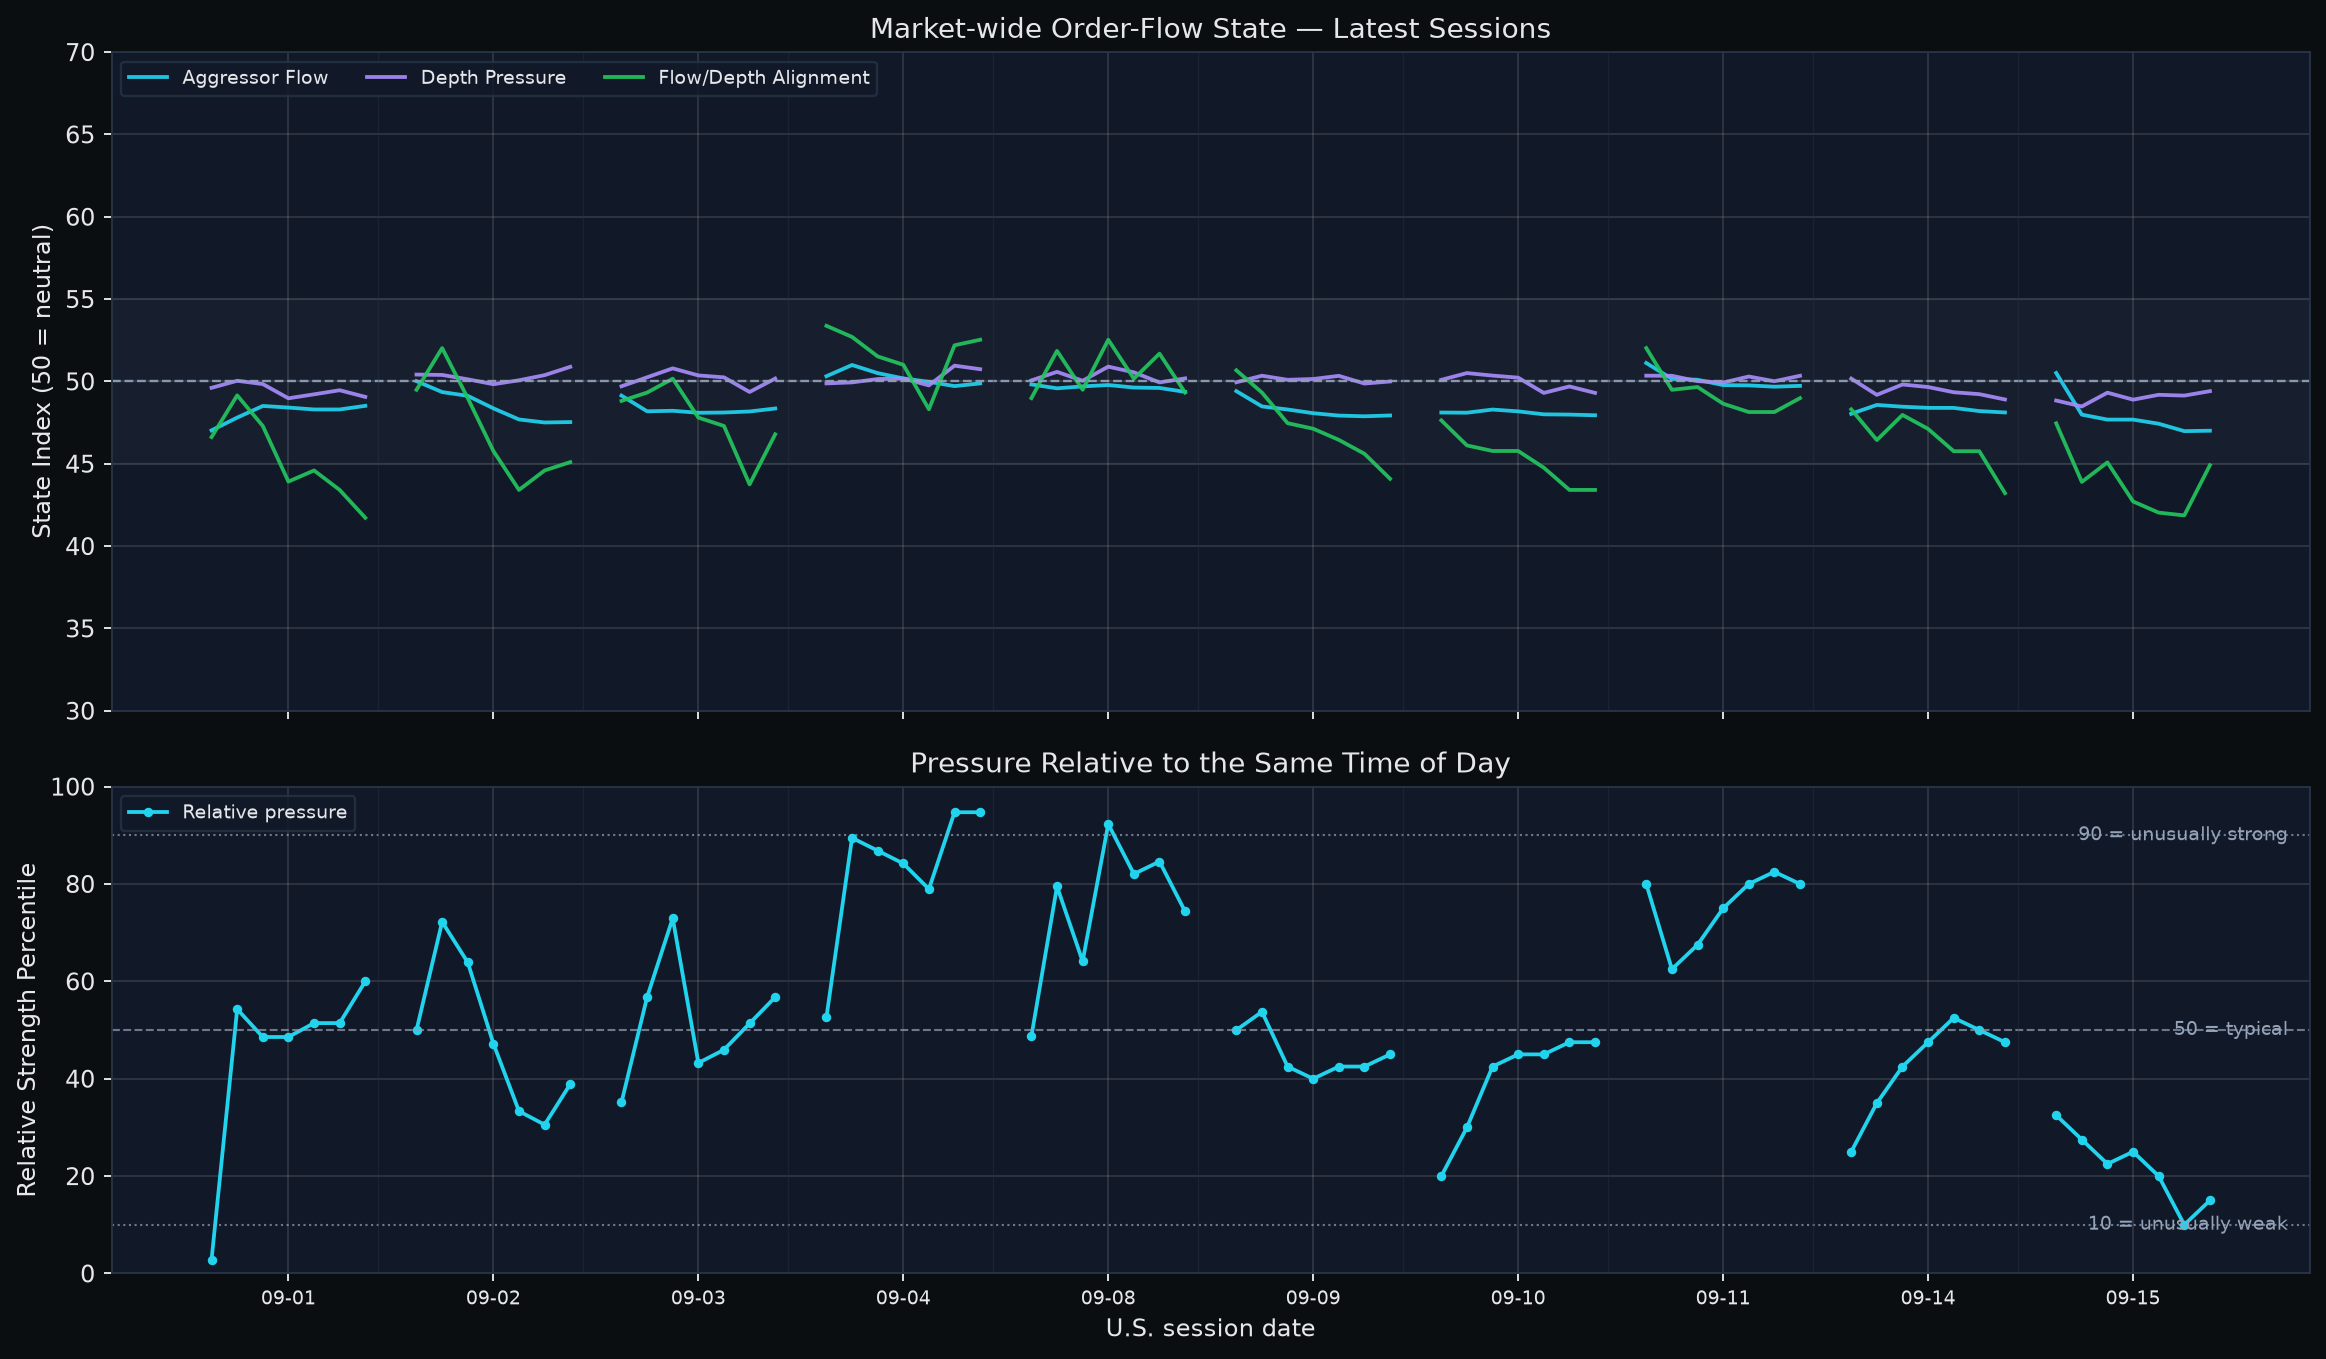
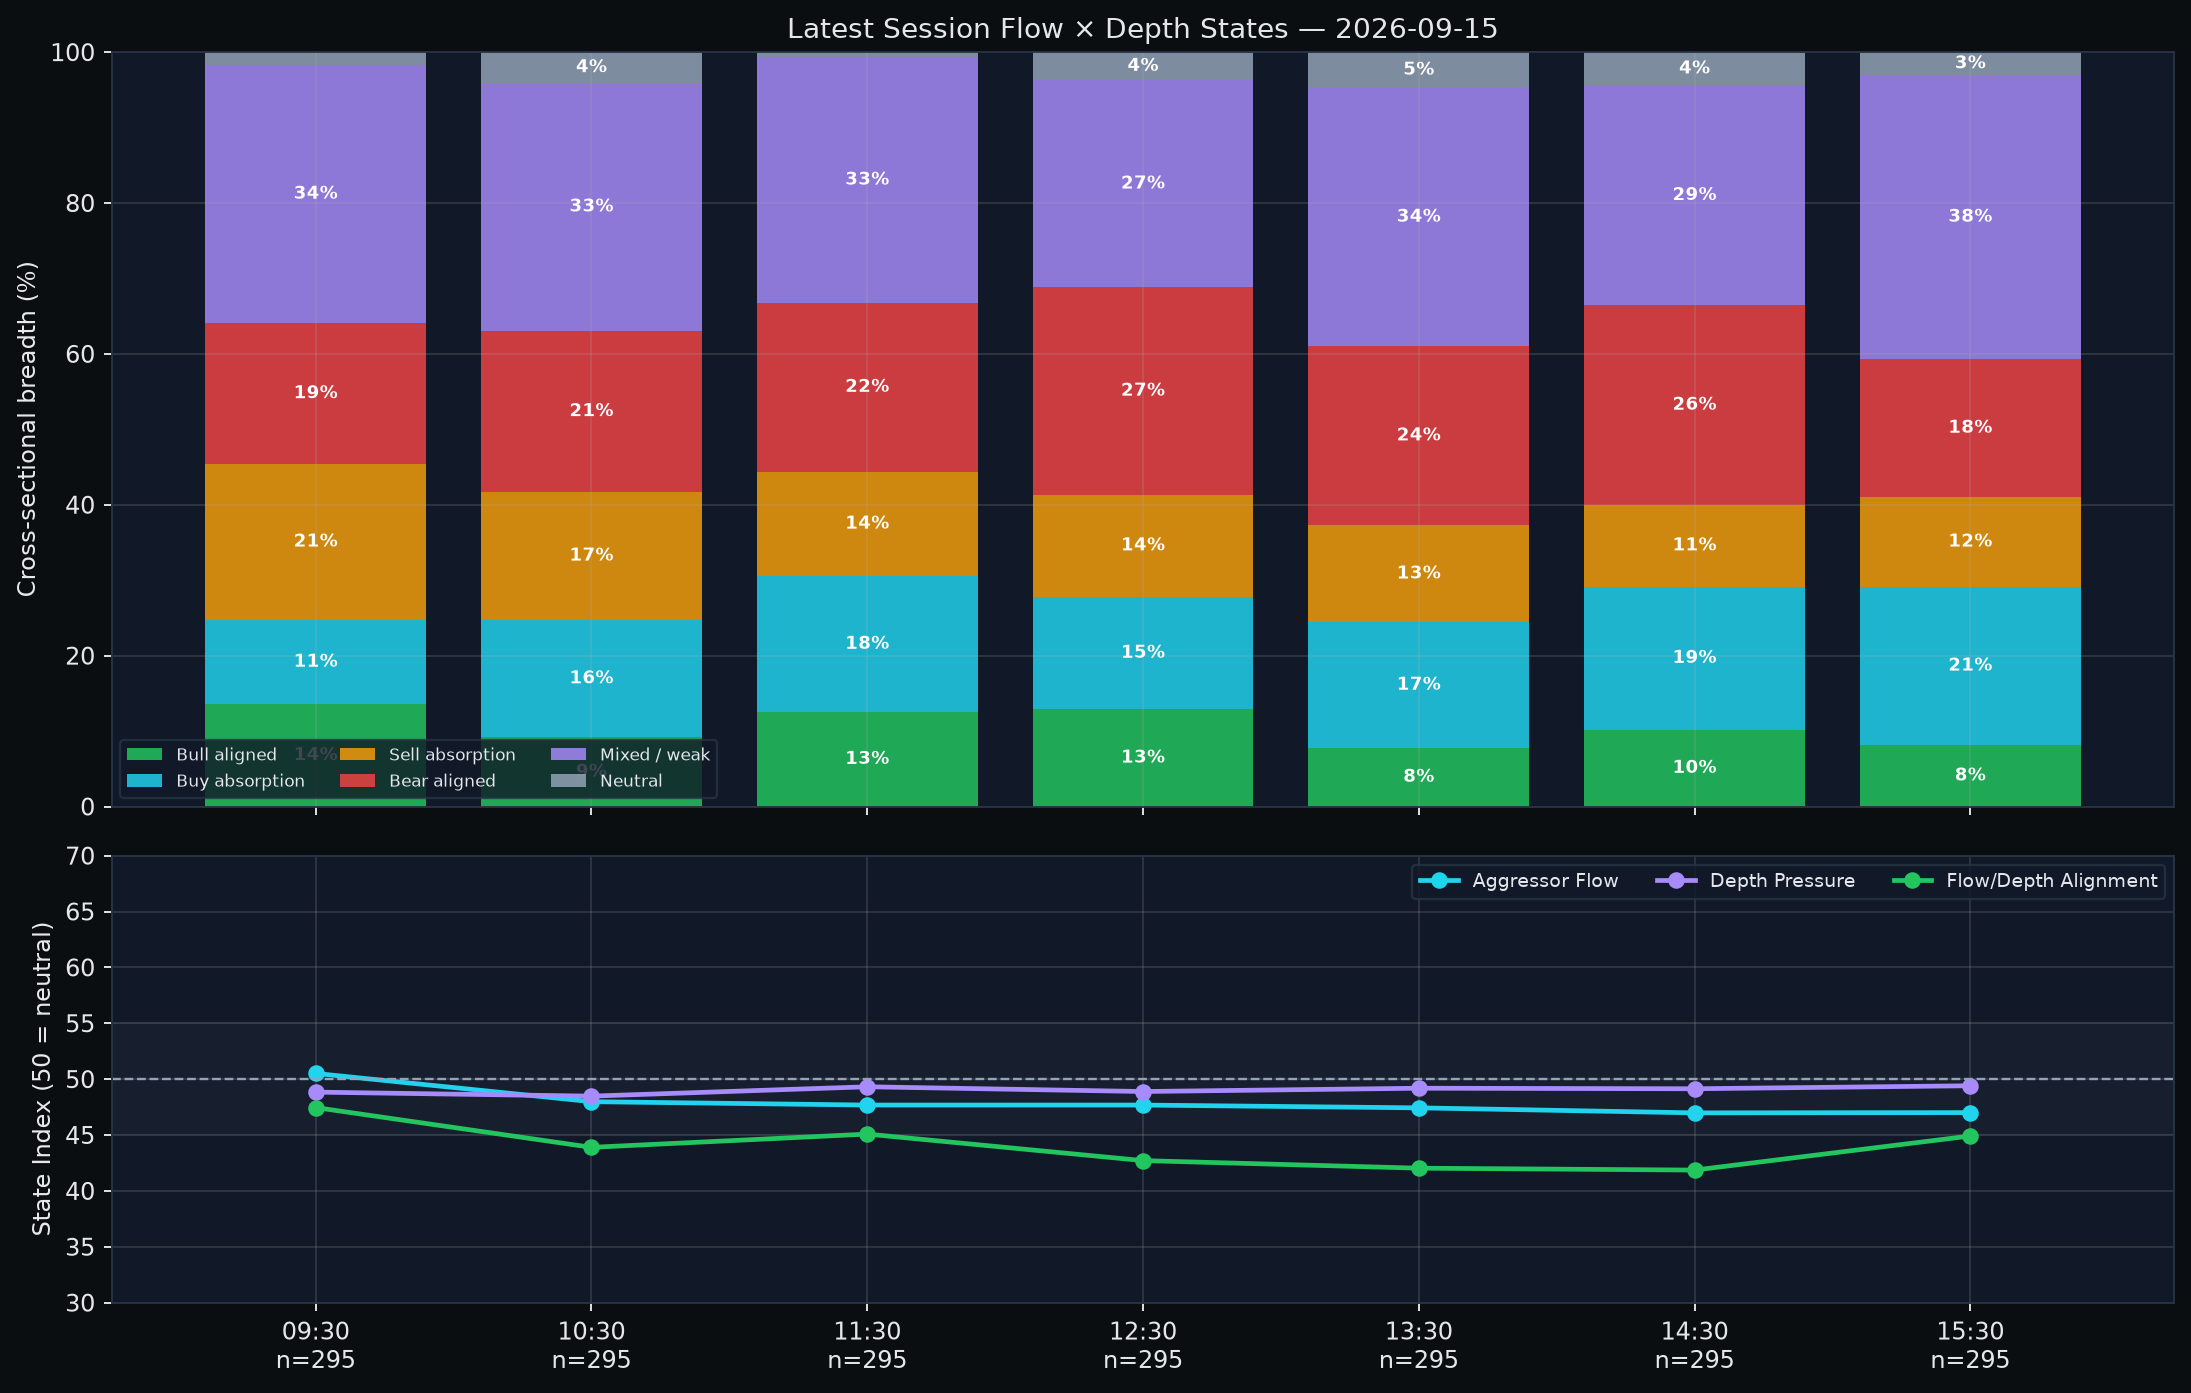
The most decision-relevant order-flow observation is the gap between late effort and the absolute close. Aggressor Flow opened barely above neutral at 50.5, then fell below 50 in the second bar and never recovered. Depth Pressure stayed just below neutral all day. Alignment deteriorated more sharply, bottoming in the low 40s before improving into the close. The same-time percentile fell from 32.5 at the open to 10 late in the session, then closed at 15.
| Checkpoint | Aggressor | Depth | Alignment | Same-time pct. | Bull aligned | Bear aligned | Buy absorption | Sell absorption | EW 60m return |
|---|---|---|---|---|---|---|---|---|---|
| 09:30 open | 50.5 | 48.8 | 47.5 | 32.5 | 13.6% | 18.6% | 11.2% | 20.7% | -0.32% |
| 10:30 early | 48.0 | 48.5 | 43.9 | 27.5 | 9.2% | 21.4% | 15.6% | 16.9% | +0.01% |
| 12:30 midday | 47.7 | 48.9 | 42.7 | 25 | 12.9% | 27.5% | 14.9% | 13.6% | -0.03% |
| 14:30 late | 47.0 | 49.1 | 41.9 | 10 | 10.2% | 26.4% | 19.0% | 10.8% | -0.20% |
| 15:30 close | 47.0 | 49.4 | 44.9 | 15 | 8.1% | 18.3% | 21.0% | 11.9% | -0.11% |
From the penultimate bar to the close, Aggressor Flow improved only +0.03 point, Depth Pressure improved +0.27, and Alignment improved +3.05. That was real late-session repair effort, especially in Alignment, but the close still sat 2.99 points below neutral on Aggressor, 0.59 below on Depth and 5.08 below on Alignment. In other words, no axis completed a neutral reclaim.
The breadth underneath the repair was also ambiguous rather than bullish. Bear-aligned breadth fell sharply from 26.4% to 18.3%, but Bull-aligned breadth also fell, from 10.2% to 8.1%. Buy-absorption-compatible breadth rose to 21.0% and the final equal-weight bar was still negative. That is best described as late repair without full state repair: directional Bear pressure eased, but it did not convert into broad Bull alignment or positive price confirmation.
The next session inherits a high confirmation burden. A brief opening bounce is not enough. The cleaner repair would be an early, persistent reclaim of 50 across Depth and Alignment, followed by Aggressor Flow, with Bull-aligned breadth expanding and equal-weight price confirming. If the market instead repeats the same pattern—an opening impulse followed by sub-neutral execution and weak breadth—the late September 15 upslope should be treated as an attempted repair that failed to change the state.
3. Cross-asset conditions add caution, but they do not describe synchronized risk-off
The cross-asset layer raises the burden of proof for an equity rebound without yet showing a single destination trade. The five-day funding-price shock is +2.28 z and is being driven primarily by the 2-year component, while the 20-day equity-relative-preference measure has deteriorated. Energy, investment-grade credit and long Treasuries all show positive own pressure relative to equities. That is a broad reduction in equity dominance, not evidence that a specific dollar amount moved from stocks into one destination.
| Cross-asset observation | Current read | Interpretation constraint |
|---|---|---|
| Funding-price shock | +2.28 z over 5 trading days; 2-year component dominant | A fresh tightening impulse is present; current state is still pre-transmission. |
| Equity relative preference (20D) | R change -0.531; energy is the largest attributed recipient | Price-implied relative preference, not observed dollar flow. |
| Energy own pressure | +0.634 over 20D | Stronger on its own; latest CFTC snapshot also leans in the same direction. |
| Long-Treasury own pressure | +0.453 over 20D | Defensive-duration demand is visible, but CFTC confirmation is mixed. |
| Cross-asset coupling | 20D change -0.003; level z +0.58 | Not a synchronized one-direction risk-off lockstep. |
| CFTC timing | Latest report: Sep. 8; 5 trading days old | Weekly confirmation only; it cannot adjudicate Sep. 15 same-day positioning. |
Coupling is the counterevidence to a synchronized panic interpretation. Its 20-day change is almost flat and its current standardized level is only moderately above average. The CFTC layer is also deliberately lagged: the latest report is September 8, five trading days before this article’s market close. It confirms the energy sleeve through that snapshot, but it cannot be used to claim what futures traders did on September 15. The practical conclusion is cautious but not monolithic: macro pressure is less friendly to equities, yet market stress has not locked every asset class into one risk-off mode.
4. Sector leadership is concentrated in economic subclusters — and the top three are conflicted
The headline Bull ranking overstates how clean the leadership is. Asset Management & Capital Markets, Enterprise Software & IT Services, and Industrial Machinery rank #1, #2 and #3 on the Bull side, but they also rank #2, #4 and #3 on Bear risk. Power and Autos are cleaner on the Bear side, yet their Bull breadth is much narrower. The ranking therefore describes selective opportunity inside unstable sector internals rather than broad sector sponsorship.
| Bull rank | Sector | Bear-risk rank | Balance state | Representative tickers | Public read |
|---|---|---|---|---|---|
| #1 | Asset Management & Capital Markets | #2 | Two-sided / conflicted | HUT, CRCL, WULF, COIN, RIOT, IREN, BMNR | Six Bull Top-30 names, but crypto-policy beta and two Bear Top-30 names prevent a clean-leader reading. |
| #2 | Enterprise Software & IT Services | #4 | Two-sided / conflicted | CIFR, PANW, ZS, APLD, MSTR, FTNT, CRWV | Broad Bull count, but the label mixes cyber, compute/data-center and bitcoin-treasury exposures. |
| #3 | Industrial Machinery, Automation & Instruments | #3 | Two-sided / conflicted | SMR, VRT, GEV, BE, ETN, CAT, COHR | The Bull and Bear concentrations are equally high; SMR/VRT leadership is offset by BE/COHR weakness. |
| #4 | Power, Utilities & Renewables | #13 | Bull-dominant, narrow | OKLO, CEG, FSLR, VST, PCG, AEP, DUK | Cleaner than the top three, but only two names sit in the Bull Top 30. |
| #5 | Autos & Mobility | #12 | Bull-dominant, very narrow | CVNA, F, RIVN, AZO, TSLA, ORLY, GM | CVNA is the only Bull Top-30 name; there are no selected stocks from the group. |
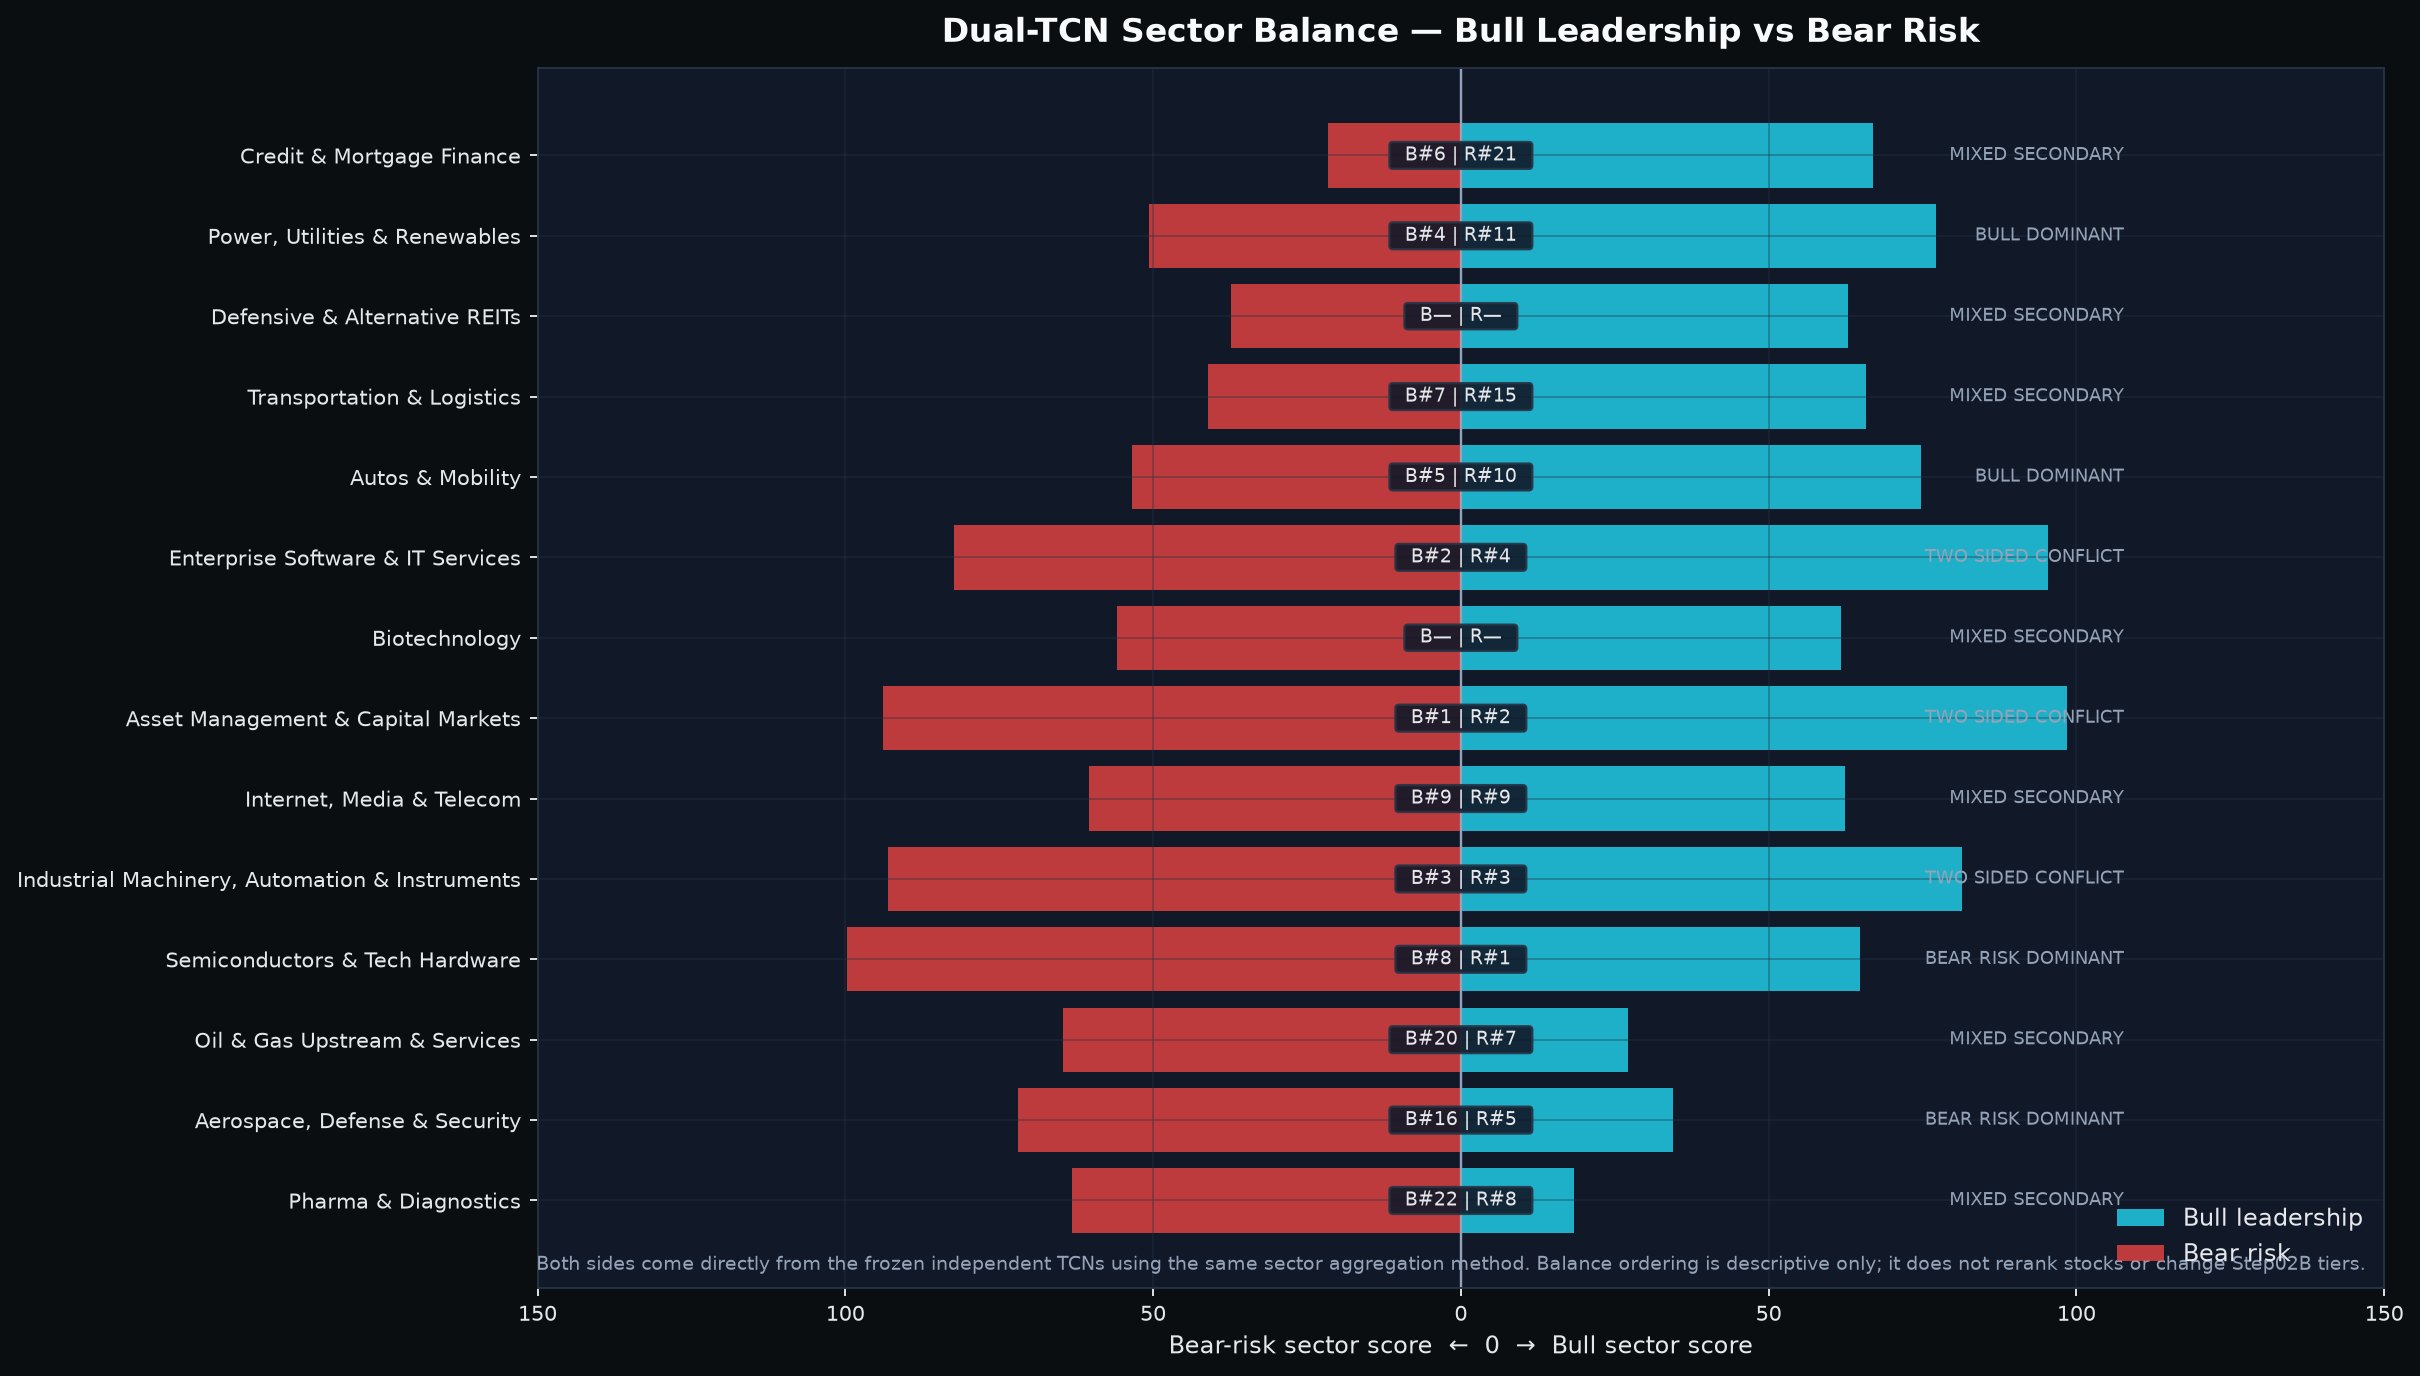
The five-session sector history supports a temporal statement, but only about composition: semiconductors were in the Bull Top 5 earlier in the window and are absent on September 15, while Power and Autos entered the current Top 5. That is a change in relative leadership composition, not proof that institutions or dollars “rotated” from semiconductors into those groups.
Economic anatomy of the Bull Top 5
| Sector | Leading subcluster(s) | Key names | Economic linkage | Quant / price-support confirmation | Why now / public mechanism | Strongest counterevidence |
|---|---|---|---|---|---|---|
| Asset Management & Capital Markets | Crypto-linked capital markets + AI/data-center infrastructure | COIN, HUT, IREN; CRCL/WULF/RIOT as controls | Common digital-asset beta plus power/compute infrastructure exposure; not a conventional asset-manager cluster. | COIN/HUT/IREN all passed support; COIN is only 0.03 ATR above live S1, while HUT/IREN remain around their MA20s. | HUT has 949 MW of contracted AI data-center capacity; the same group also absorbed a Sep. 15 crypto-regulation shock. | Reuters reported COIN and CRCL down roughly 9% after the Senate failed to advance a crypto bill; BMNR and MARA are Bear Top-30 controls. |
| Enterprise Software & IT Services | Cybersecurity + HPC/data-center + bitcoin treasury + application software | ZS, CIFR, MSTR, ADBE; PANW/FTNT/CRWV as controls | Shared enterprise technology spend, but with major taxonomy spillover across cyber, compute and digital assets. | ZS is the clean price-confirmation control (+10.2% vs MA5, +9.5% vs MA20); CIFR is near S1 but ~6% below both averages. | Zscaler reported 25% FY26 Q4 revenue and ARR growth; compute-linked names retain AI infrastructure exposure. | NOW/NTAP/OKTA remain Bear Top-30 names, and several compute-linked leaders have weak short-term price transmission. |
| Industrial Machinery, Automation & Instruments | Data-center power/cooling + advanced nuclear equipment | VRT, SMR; GEV as adjacent control | Common exposure to the time-to-power bottleneck for AI and other electricity-intensive infrastructure. | SMR and VRT passed support, but close 9–11% below MA20; VRT has strong slow context while price remains damaged. | Vertiv’s Sep. 2 acquisition agreement targets faster data-center time-to-power; NuScale reported a Sep. 1 manufacturing-readiness milestone. | Bear-risk rank is also #3; COHR and BE are Bear Top-30 names, and support has not repaired the moving-average trend. |
| Power, Utilities & Renewables | Advanced nuclear + independent power | OKLO, CEG; VST as risk control | Common exposure to rising baseload and data-center power requirements. | OKLO passed support but remains -5.7% vs MA5 and -11.2% vs MA20; the sector has only two Bull Top-30 names. | EIA data cited by Reuters point to record U.S. electricity demand in 2026–27 with AI data centers a major driver. | OKLO filed an up-to-$1.0B ATM program on Sep. 11, and VST is a Bear Top-30 name. |
| Autos & Mobility | Used-vehicle retail / distribution | CVNA; F/RIVN/TSLA as controls | The current strength is mainly a single-company operating/retail story rather than sector-wide confirmation. | CVNA is the only Bull Top-30 name; no stock from this sector enters the selected support set. | Carvana reported Q2 retail units up 38% YoY with record quarterly units and profitability. | The breadth is too narrow to call the full autos complex a clean leader; no selected support-confirmed name provides a stock-level control. |
The common thread is infrastructure scarcity, but it is not the whole story. HUT, VRT, SMR and OKLO all touch the power-and-compute bottleneck in different ways, and U.S. electricity demand is expected to set records as AI data centers expand. But the Asset and Enterprise groups also contain large crypto beta, while Autos is mostly a CVNA-specific operating story. The best cross-sector synthesis is therefore common AI/power infrastructure backdrop plus sector-specific overlays, not one macro factor explaining every leader.
The public evidence also explains why “two-sided” matters. Hut 8 has already contracted substantial AI data-center capacity, yet COIN and other crypto-linked names were hit on September 15 after the Senate failed to advance a cryptocurrency regulatory bill. Zscaler’s recent 25% revenue and ARR growth gives cybersecurity a different fundamental path from the data-center/crypto cluster. Vertiv’s planned acquisition adds to the time-to-power theme, while NuScale’s manufacturing progress supports the advanced-nuclear commercialization narrative. These facts explain economic exposure; they do not override the market’s current price and support evidence.
5. The stock list is a support test, not a broad risk-on list
All ten selected stocks have recent support confirmation and remain within 0.41 ATR of the current live S1 center, but their price transmission differs sharply. This is exactly why support proximity must be read together with MA geometry and slower context. A stock can be close to support because buyers defended it—or because price has fallen back into the zone while the larger trend remains damaged.
| Stock | Sector | Tier / role | Bull rank | Bear rank | Live-S1 distance | Support confirmation | vs MA5 | vs MA20 | Slow context |
|---|---|---|---|---|---|---|---|---|---|
| COIN | Asset Mgmt. & Capital Mkts | A / near-support | #10 of 295 | #37 of 295 | +0.03 ATR | Sep. 11 same-day center reclaim | -2.9% | -3.4% | Mixed |
| SMR | Industrial Machinery | A / fresh reclaim | #4 of 295 | #79 of 295 | +0.03 ATR | Sep. 15 same-day center reclaim | -9.5% | -10.7% | Negative |
| HUT | Asset Mgmt. & Capital Mkts | A+ / near-support | #2 of 295 | #78 of 295 | +0.05 ATR | Sep. 11 next-day reclaim after wick | -6.0% | +0.7% | Positive |
| CIFR | Enterprise Software & IT | A / near-support | #1 of 295 | #90 of 295 | +0.05 ATR | Sep. 14 same-day center reclaim | -6.2% | -6.8% | Negative |
| ADBE | Enterprise Software & IT | B / near-support | #27 of 295 | #100 of 295 | +0.05 ATR | Sep. 11 next-day reclaim after wick | +0.7% | -5.1% | Negative |
| ZS | Enterprise Software & IT | A / price-confirmed | #14 of 295 | #84 of 295 | +0.14 ATR | Sep. 15 same-day center reclaim | +10.2% | +9.5% | Negative slow context |
| MSTR | Enterprise Software & IT | B / intermediate | #16 of 295 | #72 of 295 | +0.22 ATR | Sep. 11 same-day center reclaim | -1.6% | +2.5% | Neutral / mixed |
| VRT | Industrial Machinery | A+ / slow-context divergence | #12 of 295 | #70 of 295 | +0.26 ATR | Sep. 14 same-day center reclaim | -5.4% | -10.0% | Positive |
| IREN | Asset Mgmt. & Capital Mkts | B / near MA20 | #30 of 295 | #191 of 295 | +0.34 ATR | Sep. 14 same-day center reclaim | -4.5% | +0.0% | Positive |
| OKLO | Power, Utilities & Renewables | B / damaged trend | #18 of 295 | #86 of 295 | +0.41 ATR | Sep. 14 same-day center reclaim | -5.7% | -11.2% | Neutral / mixed |
Crypto and digital infrastructure: support is real, but the headline beta is real too
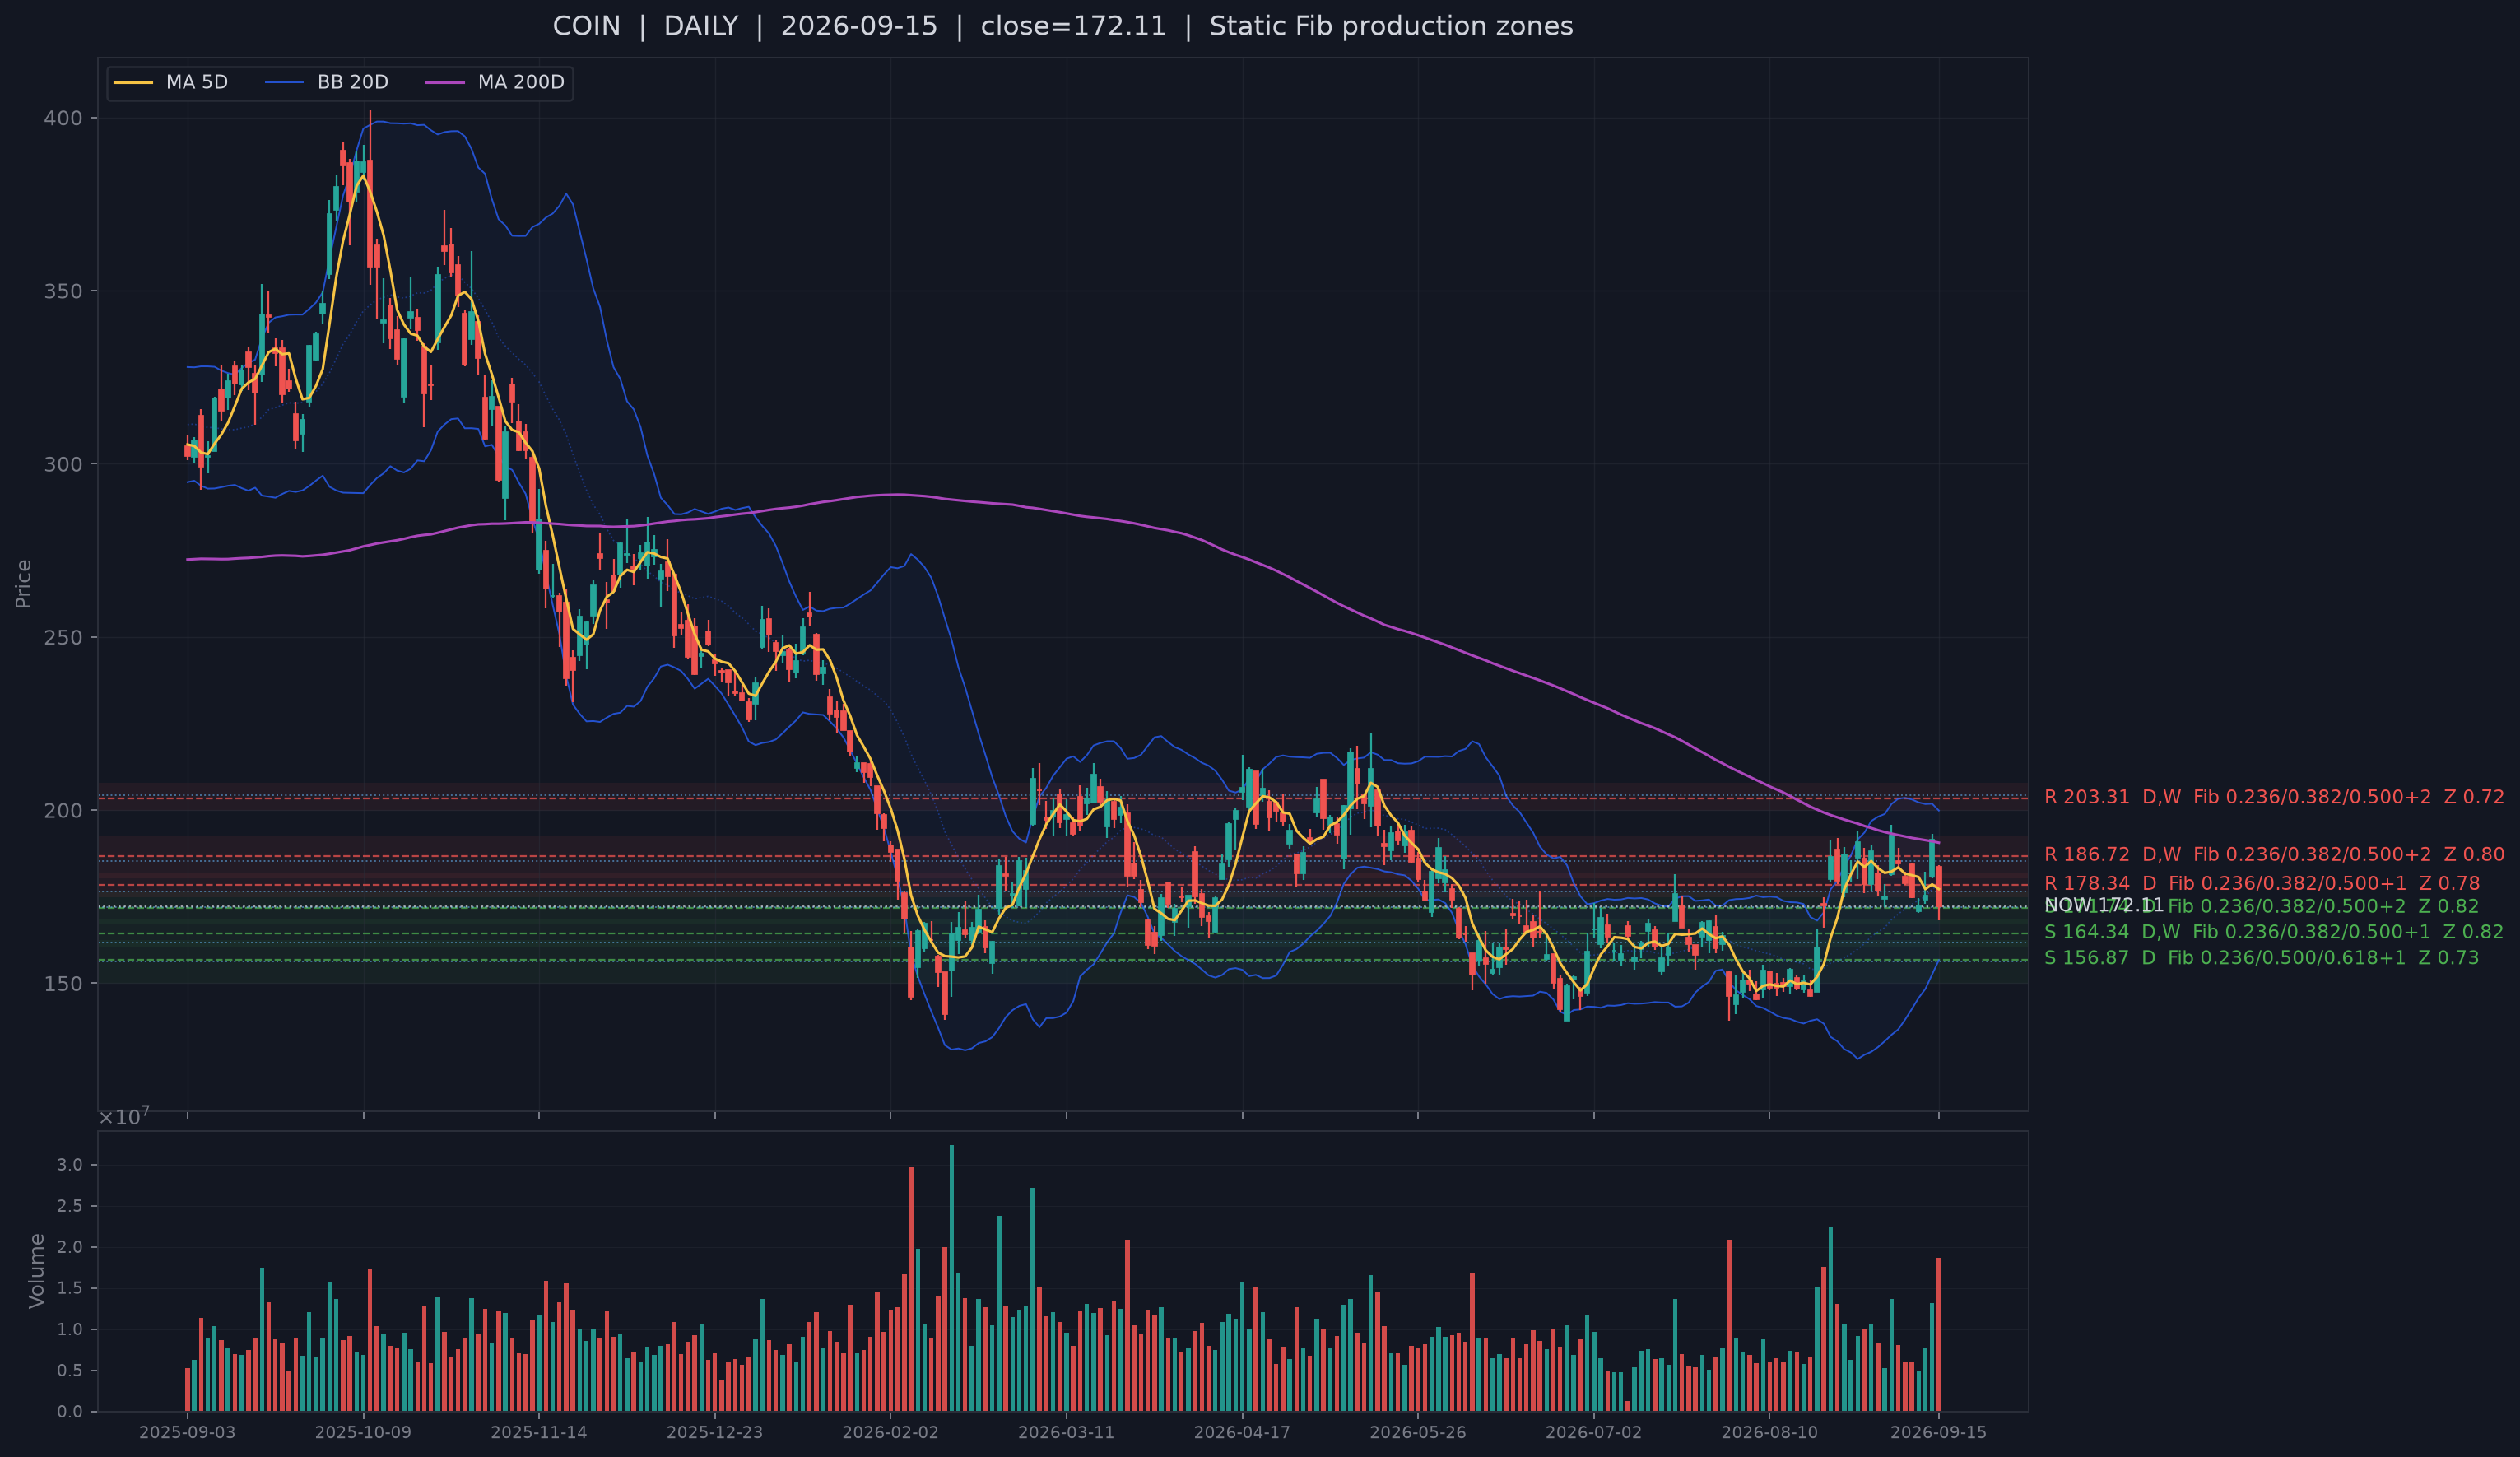
COIN is only 0.03 ATR above live S1 after the September 15 regulatory shock, making it the cleanest immediate test of whether the support zone can absorb new information. The problem is trend: it remains 2.9% below MA5 and 3.4% below MA20. HUT is similarly close to S1 at 0.05 ATR but is still above MA20, while IREN sits almost exactly on MA20 and 0.34 ATR above S1. HUT’s contracted AI data-center business means the cluster is not pure crypto, but that diversification does not erase the day-to-day digital-asset beta.
Cybersecurity is the positive price-transmission control
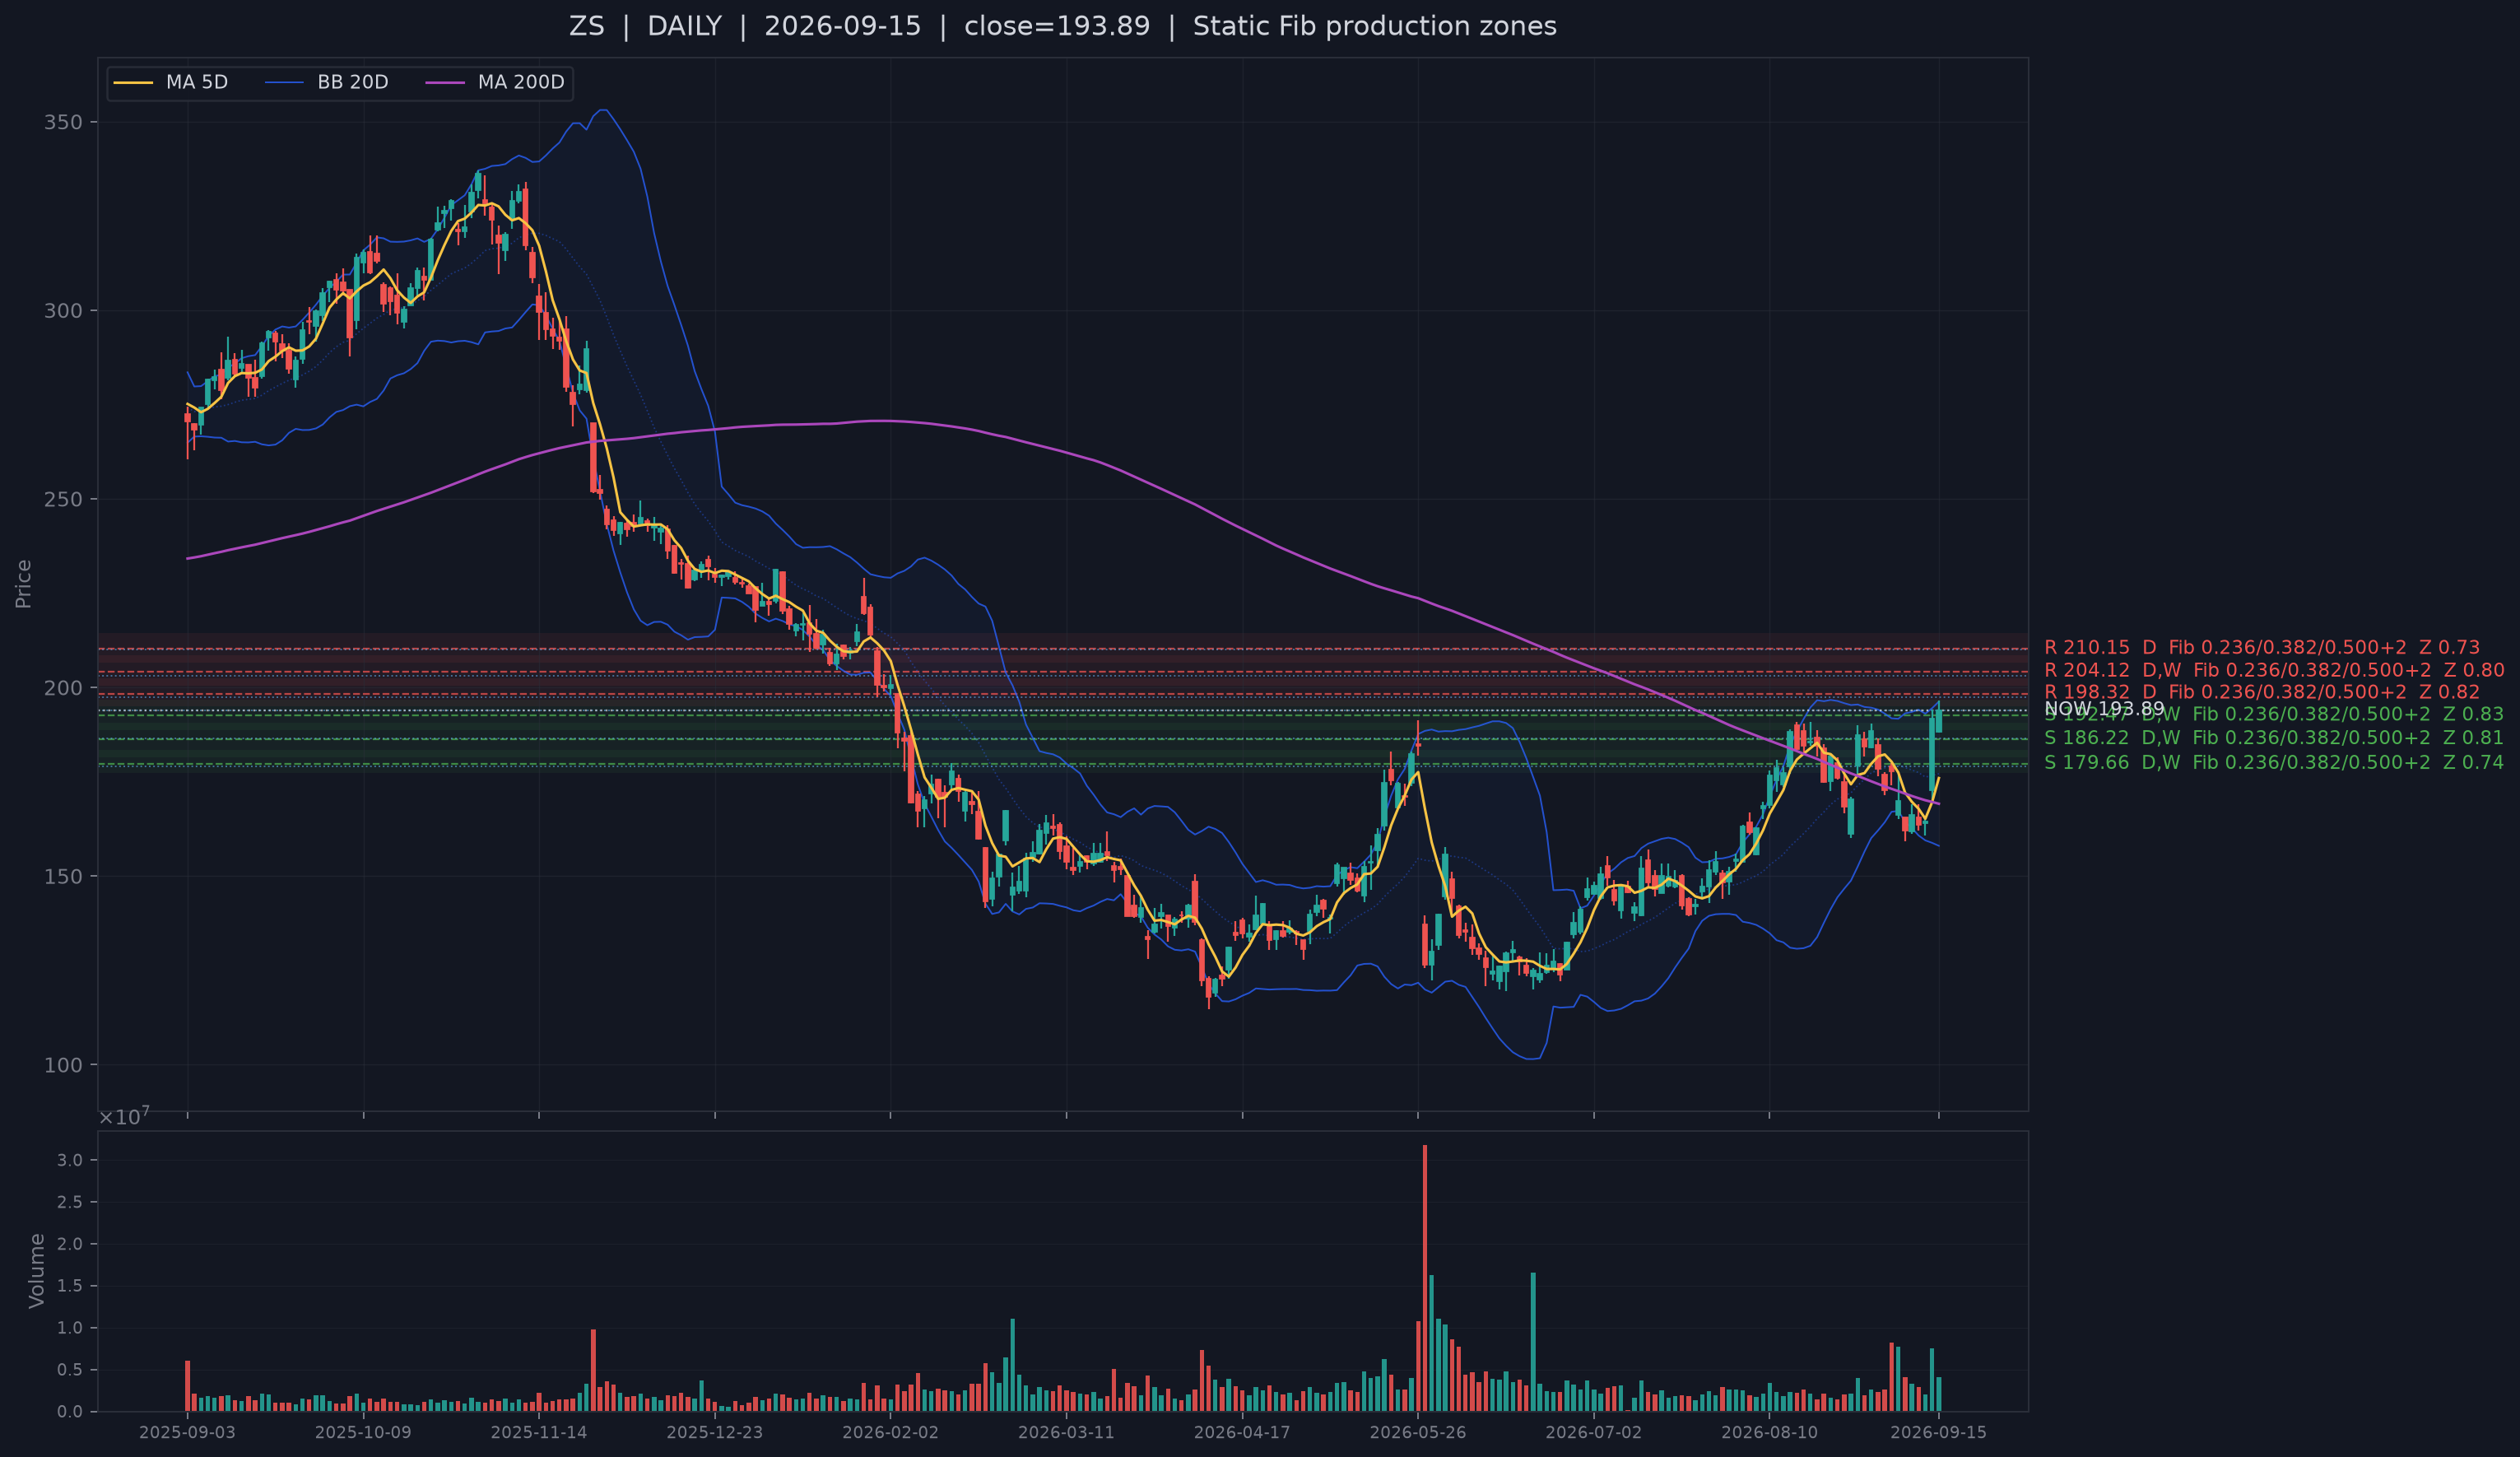
ZS is the standout because support confirmation is being rewarded by price rather than merely preventing a breakdown. The stock closed 10.2% above MA5 and 9.5% above MA20 after a fresh September 15 support reclaim, while Zscaler’s September 3 results showed 25% year-over-year Q4 revenue and ARR growth. That price strength is especially useful because the slower Financial/13F context is weak. In other words, the fast price/support layer is leading rather than waiting for slow context to agree.
CIFR and ADBE provide the internal controls. CIFR is only 0.05 ATR above S1 but remains roughly 6% below both MA5 and MA20. ADBE is also 0.05 ATR above S1 and has recovered above MA5, but is still 5.1% below MA20. Its available price-path and risk context is mixed—positive medium-horizon recommendation context but conflicting energy-side return estimates—so it is classified as neutral secondary evidence rather than a reason to upgrade the stock.
Power and industrial infrastructure: fresh support inside damaged trends
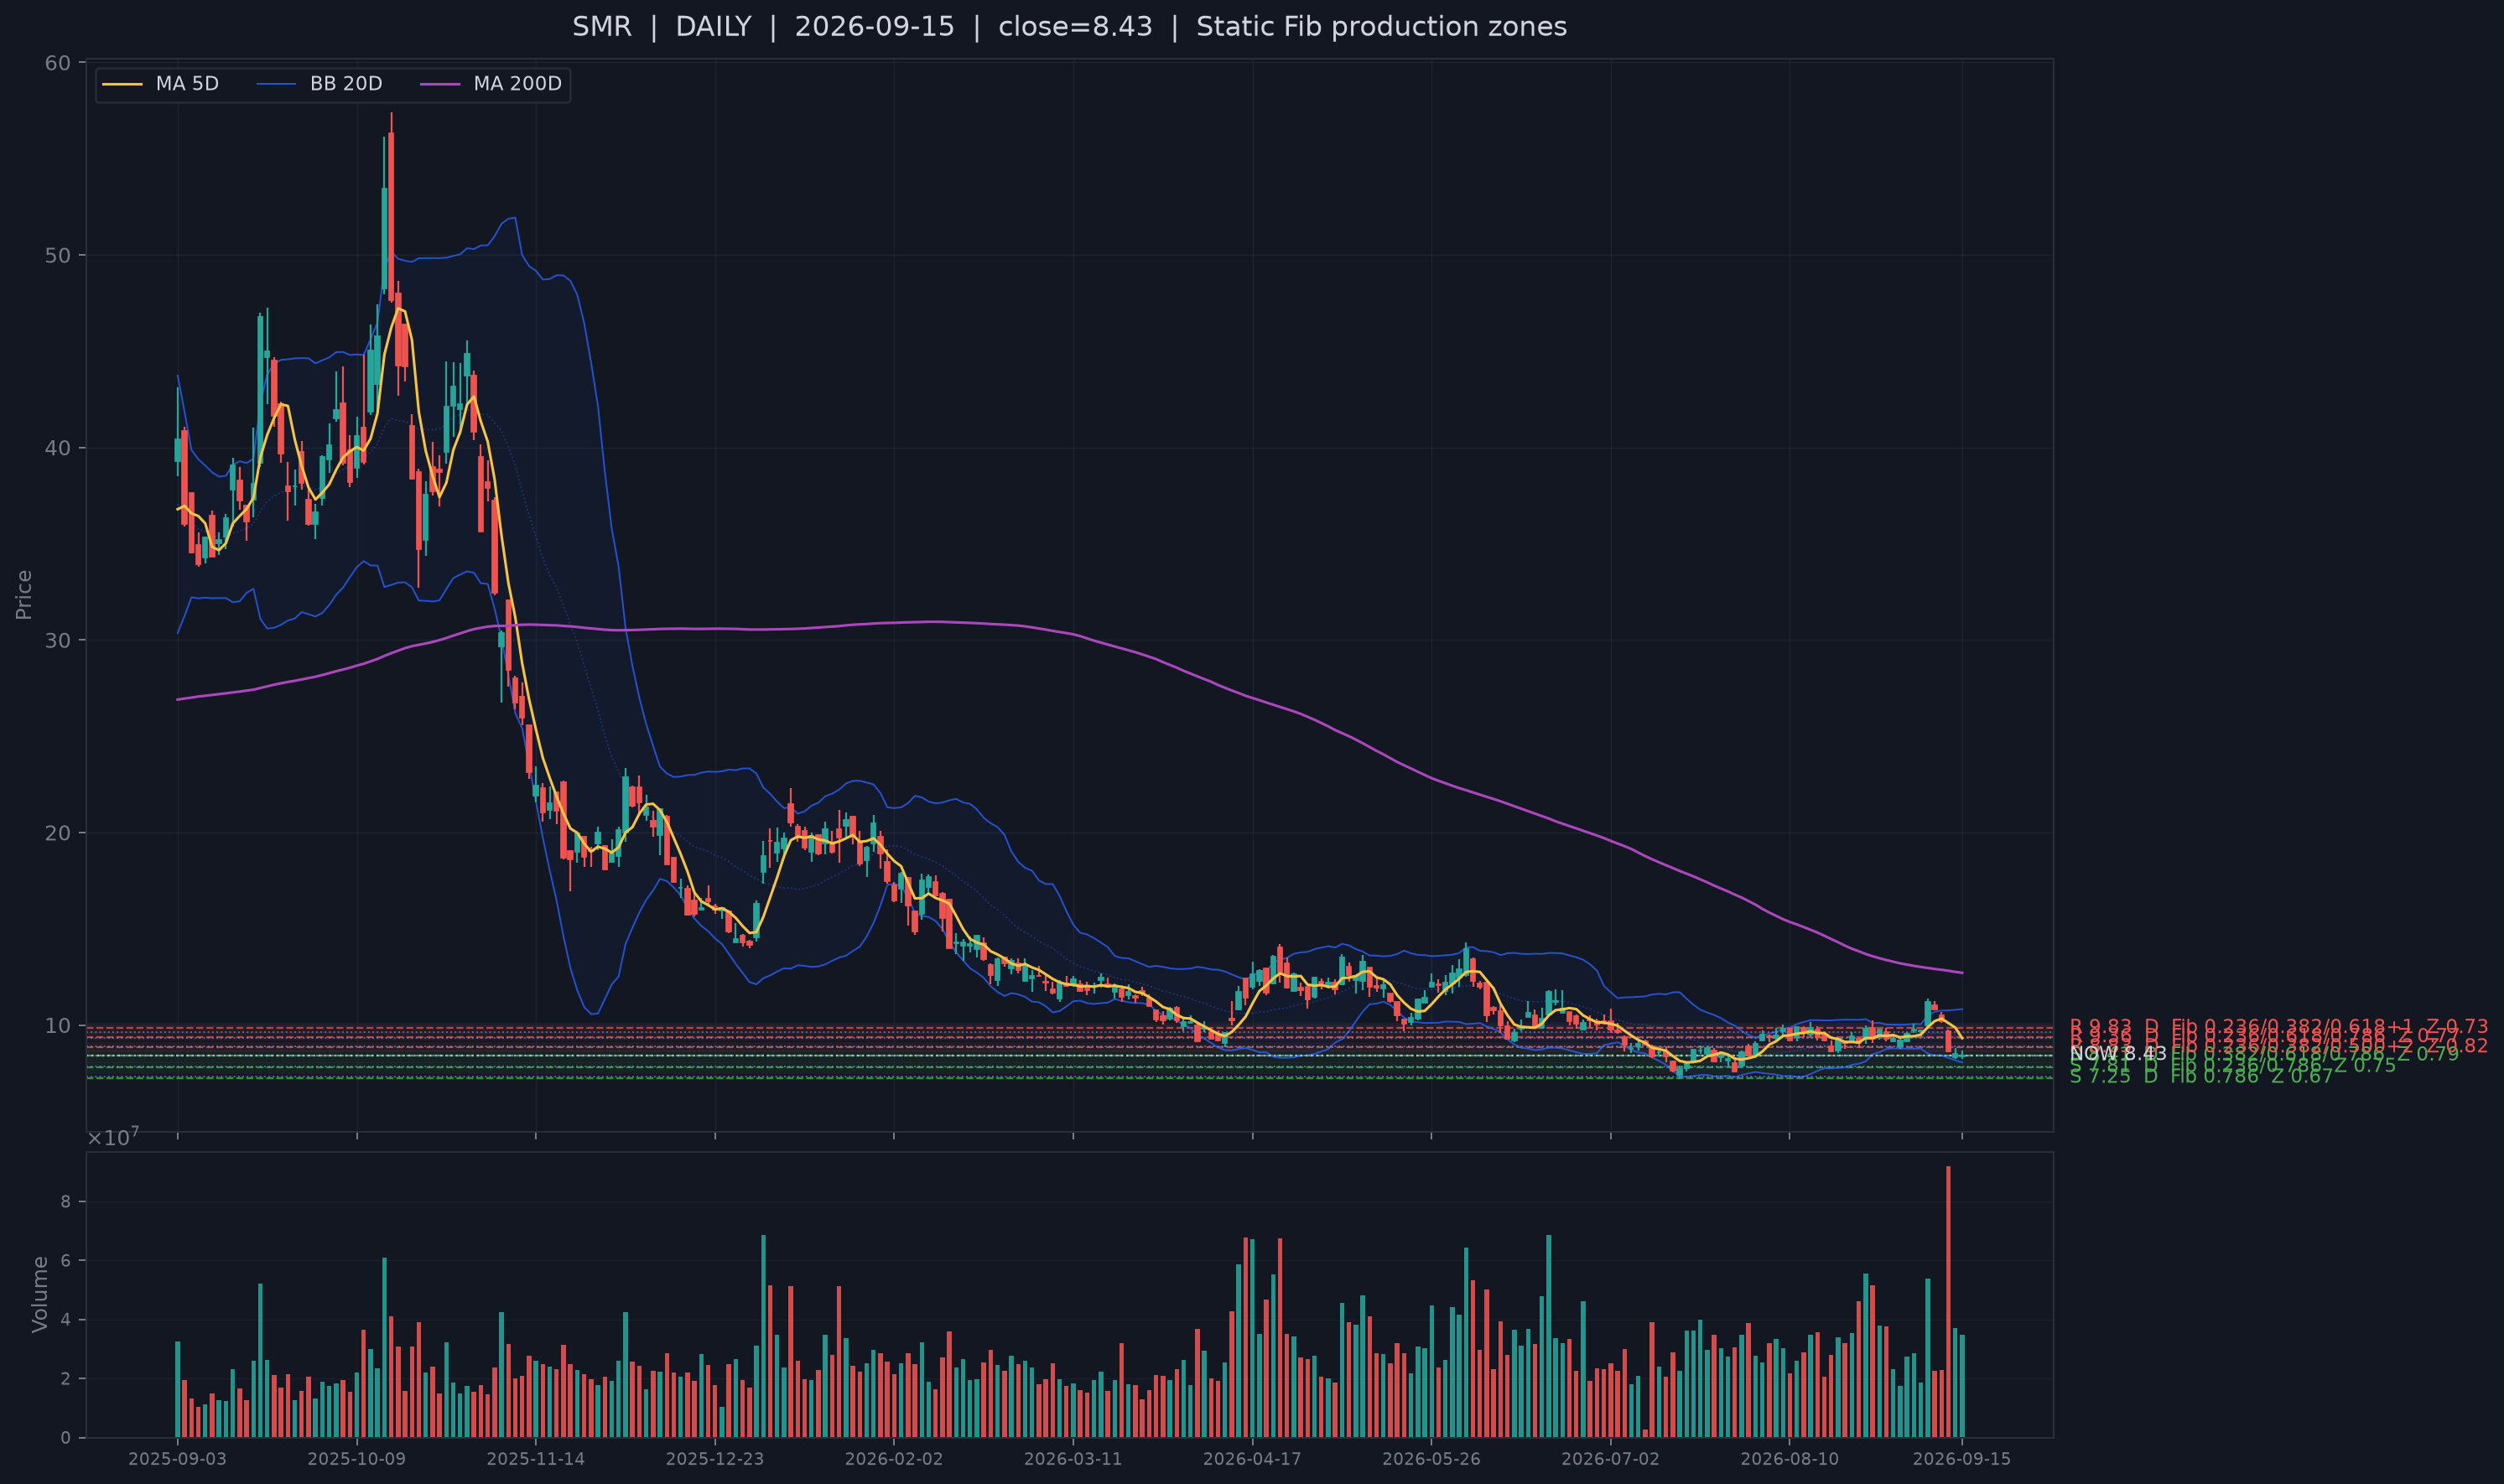
SMR is the sharpest example of tactical support without trend repair. It confirmed S1 on September 15 and is only 0.03 ATR above the live center, but it is 9.5% below MA5, 10.7% below MA20 and down 24.6% over five sessions. VRT is less extreme but still 5.4% below MA5 and 10.0% below MA20. Its slower context is unusually constructive—Financial rank 0.81 and delayed-13F rank 0.89, both with positive price divergence—but that is precisely why it is a useful test: if a strong slow backdrop cannot produce price repair, the market is telling us to wait for the fast layer.
OKLO sits 0.41 ATR above S1 but remains 11.2% below MA20. The power-demand story is credible at the sector level, yet financing remains a live counterweight: Oklo filed an at-the-market equity program of up to $1.0 billion on September 11. That does not invalidate the business or the support signal; it simply raises the amount of price confirmation needed before treating support as a repaired trend.
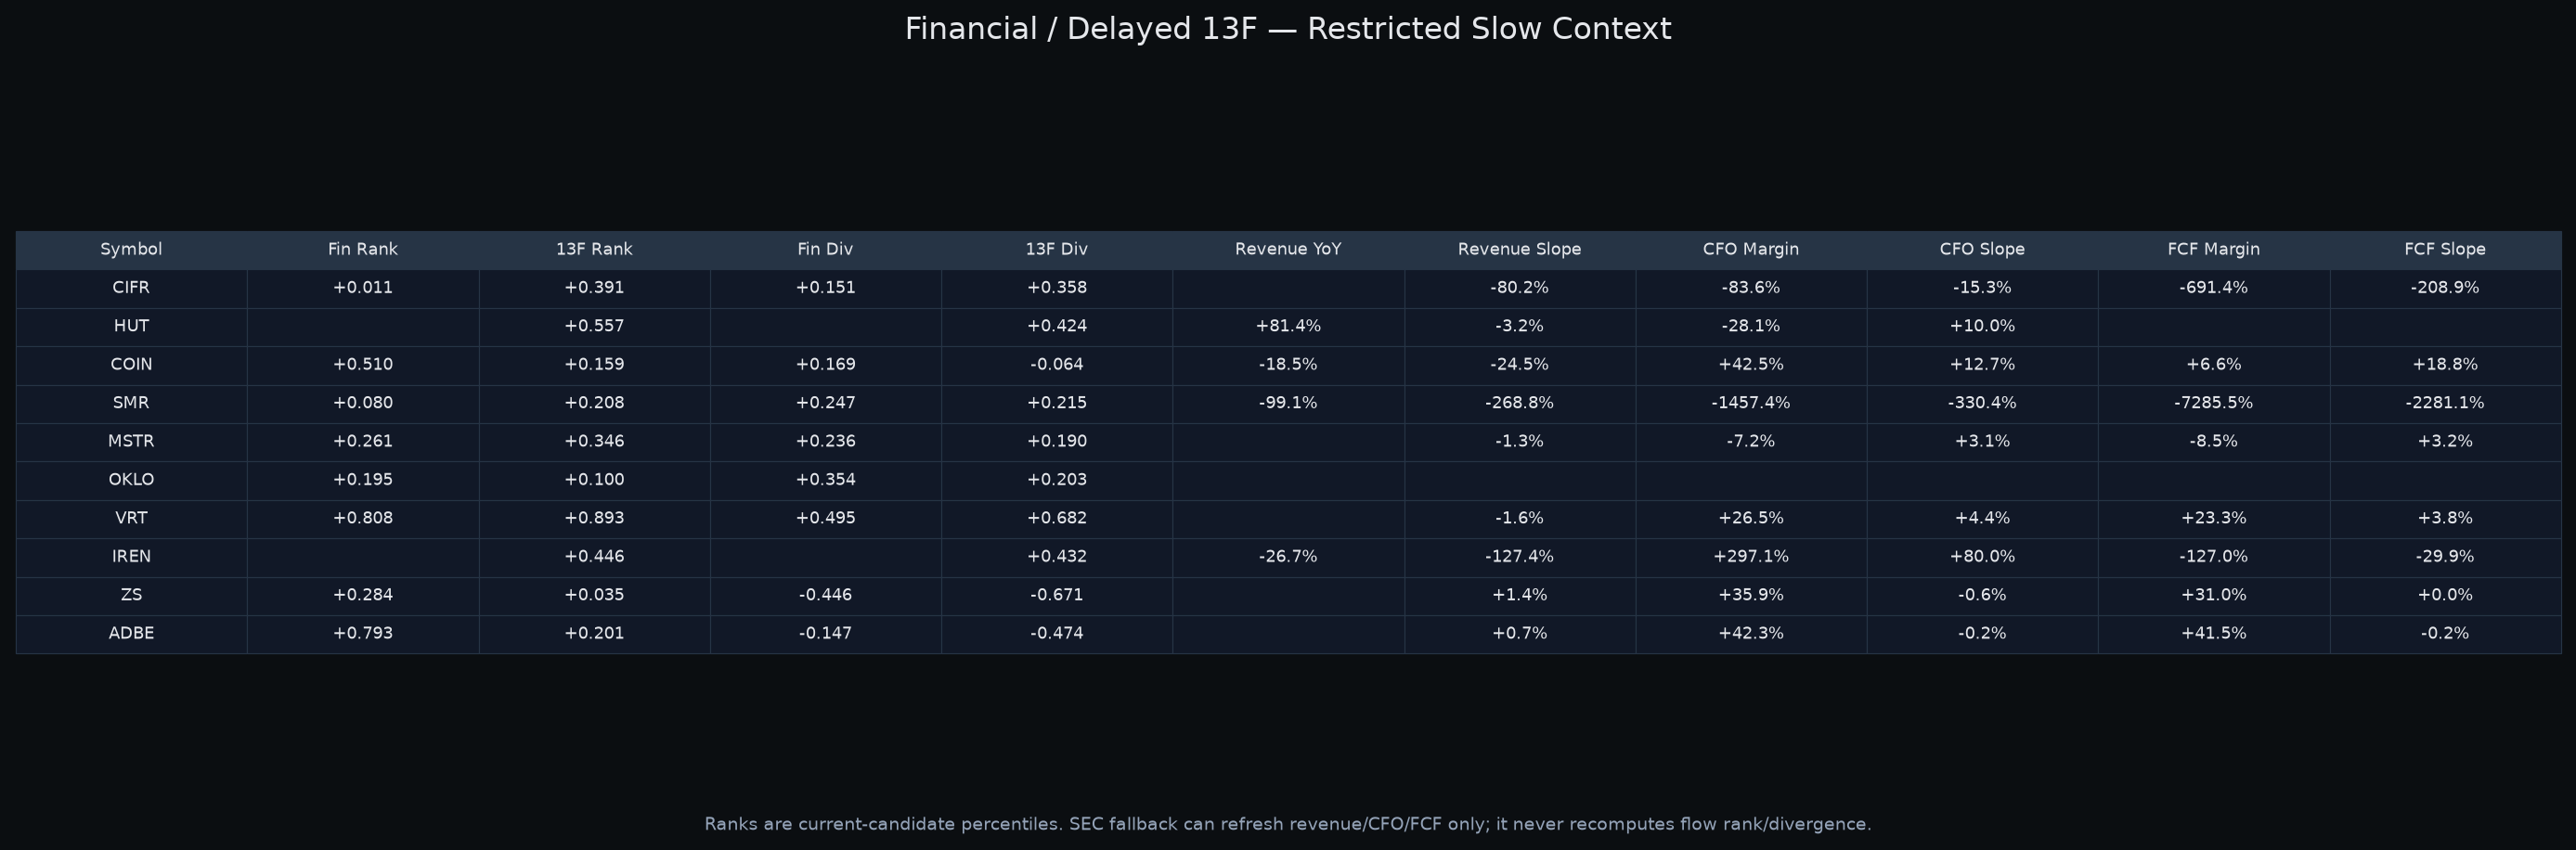
MSTR is the intermediate case. It is 0.22 ATR above S1, below MA5 but 2.5% above MA20, and its slow context is neutral/mixed. It therefore belongs between the strong-transmission ZS case and the heavily damaged SMR/VRT/OKLO group. The common rule across all ten names is simple: the support zone earns attention, but continuation still has to be demonstrated in price.
6. Base case, confidence and falsification
Base case — selective correction with incomplete repair; moderate confidence. The major indexes, breadth and market-wide order-flow state remain weak enough that a broad risk-on interpretation is not supported. At the same time, large-decline breadth and dispersion have not joined the new-low deterioration, so the evidence does not yet support a cascading-liquidation interpretation either. The practical research state is one of selective support tests under a fragile market surface.
What would strengthen the constructive branch: the next session reclaims 50 early and persistently across Depth and Alignment, Aggressor Flow follows, Bull-aligned breadth expands, and equal-weight price confirms without a fresh increase in broad downside damage. At the stock level, COIN/HUT/CIFR/SMR/VRT/OKLO should begin turning S1 proximity into higher closes and MA5 repair rather than repeatedly revisiting the same zones.
What would strengthen the bearish branch: another sub-neutral order-flow close accompanied by breadth remaining in the lower tail, 252-day new lows staying elevated, and the currently quiet large-decline/dispersion measures beginning to rise. A cluster of actual live-S1 failures among the selected stocks would be especially important because it would remove the main stock-level counterevidence to the weak market tape.
Falsifier for the current “selective correction” view: either side must broaden. A sustained market-wide state repair with improving breadth would make the current caution too conservative; synchronized expansion in new lows, large-decline breadth, dispersion and support failures would make it too benign. Until one of those branches confirms, the late September 15 repair should be treated as effort that still carries a high next-session burden.
Sources
- Reuters — Bitcoin and crypto stocks remain down after US senate fails to advance regulatory bill (2026-09-15)
- Hut 8 — Hut 8 Fully Commercializes 1 GW Beacon Point AI Data Center Campus with Second 352 MW IT Lease (2026-07-20)
- Zscaler — Zscaler Announces Strong Fourth Quarter and Fiscal 2026 Financial Results (2026-09-03)
- Vertiv — Vertiv Announces Agreement to Acquire UtilityInnovation Group to Accelerate Time to Power for AI Data Centers (2026-09-02)
- Reuters / EIA — US power use to beat record highs in 2026 and 2027 as AI use surges, EIA says (2026-09-09)
- NuScale Power — NuScale Power and MillenniTEK Advance Manufacturing Technology for First-of-a-Kind Reactor Safety Component (2026-09-01)
- SEC — Oklo Inc. Form 8-K — up to $1.0 billion at-the-market equity program (2026-09-11)
- Carvana — Carvana Announces Record Second Quarter 2026 Results (2026-07-29)
Methodology / horizon note
Market Layers is a data-first research process focused on a 3–10 trading-day horizon. Fast price, breadth, damage and market-wide flow/depth evidence is evaluated before slower financial statements, delayed institutional-holdings context and weekly CFTC positioning. Sector and stock ranks are systematic research screens, not literal probabilities or personalized trade instructions. Public information is used after the quantitative observation to test mechanisms and counterevidence. Expected range, when available, is a non-directional high-to-low amplitude estimate rather than an upside target. CFTC data are weekly and can materially lag daily market changes.