Late Order-Flow Repair Reclaimed Neutral, but New-Low Damage Still Demands Confirmation
All three order-flow axes reclaimed neutral into the close, but breadth remained weak and 252-day new-low damage spiked above +2z, keeping the 3-10TD case selective rather than broadly risk-on.
Horizon: 3-10 trading days.
This research is designed for 3-10 trading-day swing setups. The signals and conclusions may not transfer to intraday trading or longer-horizon investing.
Late Order-Flow Repair Reclaimed Neutral, but New-Low Damage Still Demands Confirmation
Friday ended with a better order-flow state than the day's uneven price action would suggest, but the repair is not broad enough to dismiss the market's tail damage. The S&P 500 remains 0.69% above MA20 and less than 1% from its 252-day high, while the Nasdaq is 2.12% above MA20. Yet breadth is only 0.447 and a 252-day new-low measure has jumped to +2.38z. The important counterweight is that the share of stocks falling 3% or more is -0.80z and cross-sectional volatility is -0.92z. The weak tail is real; synchronized liquidation is not.
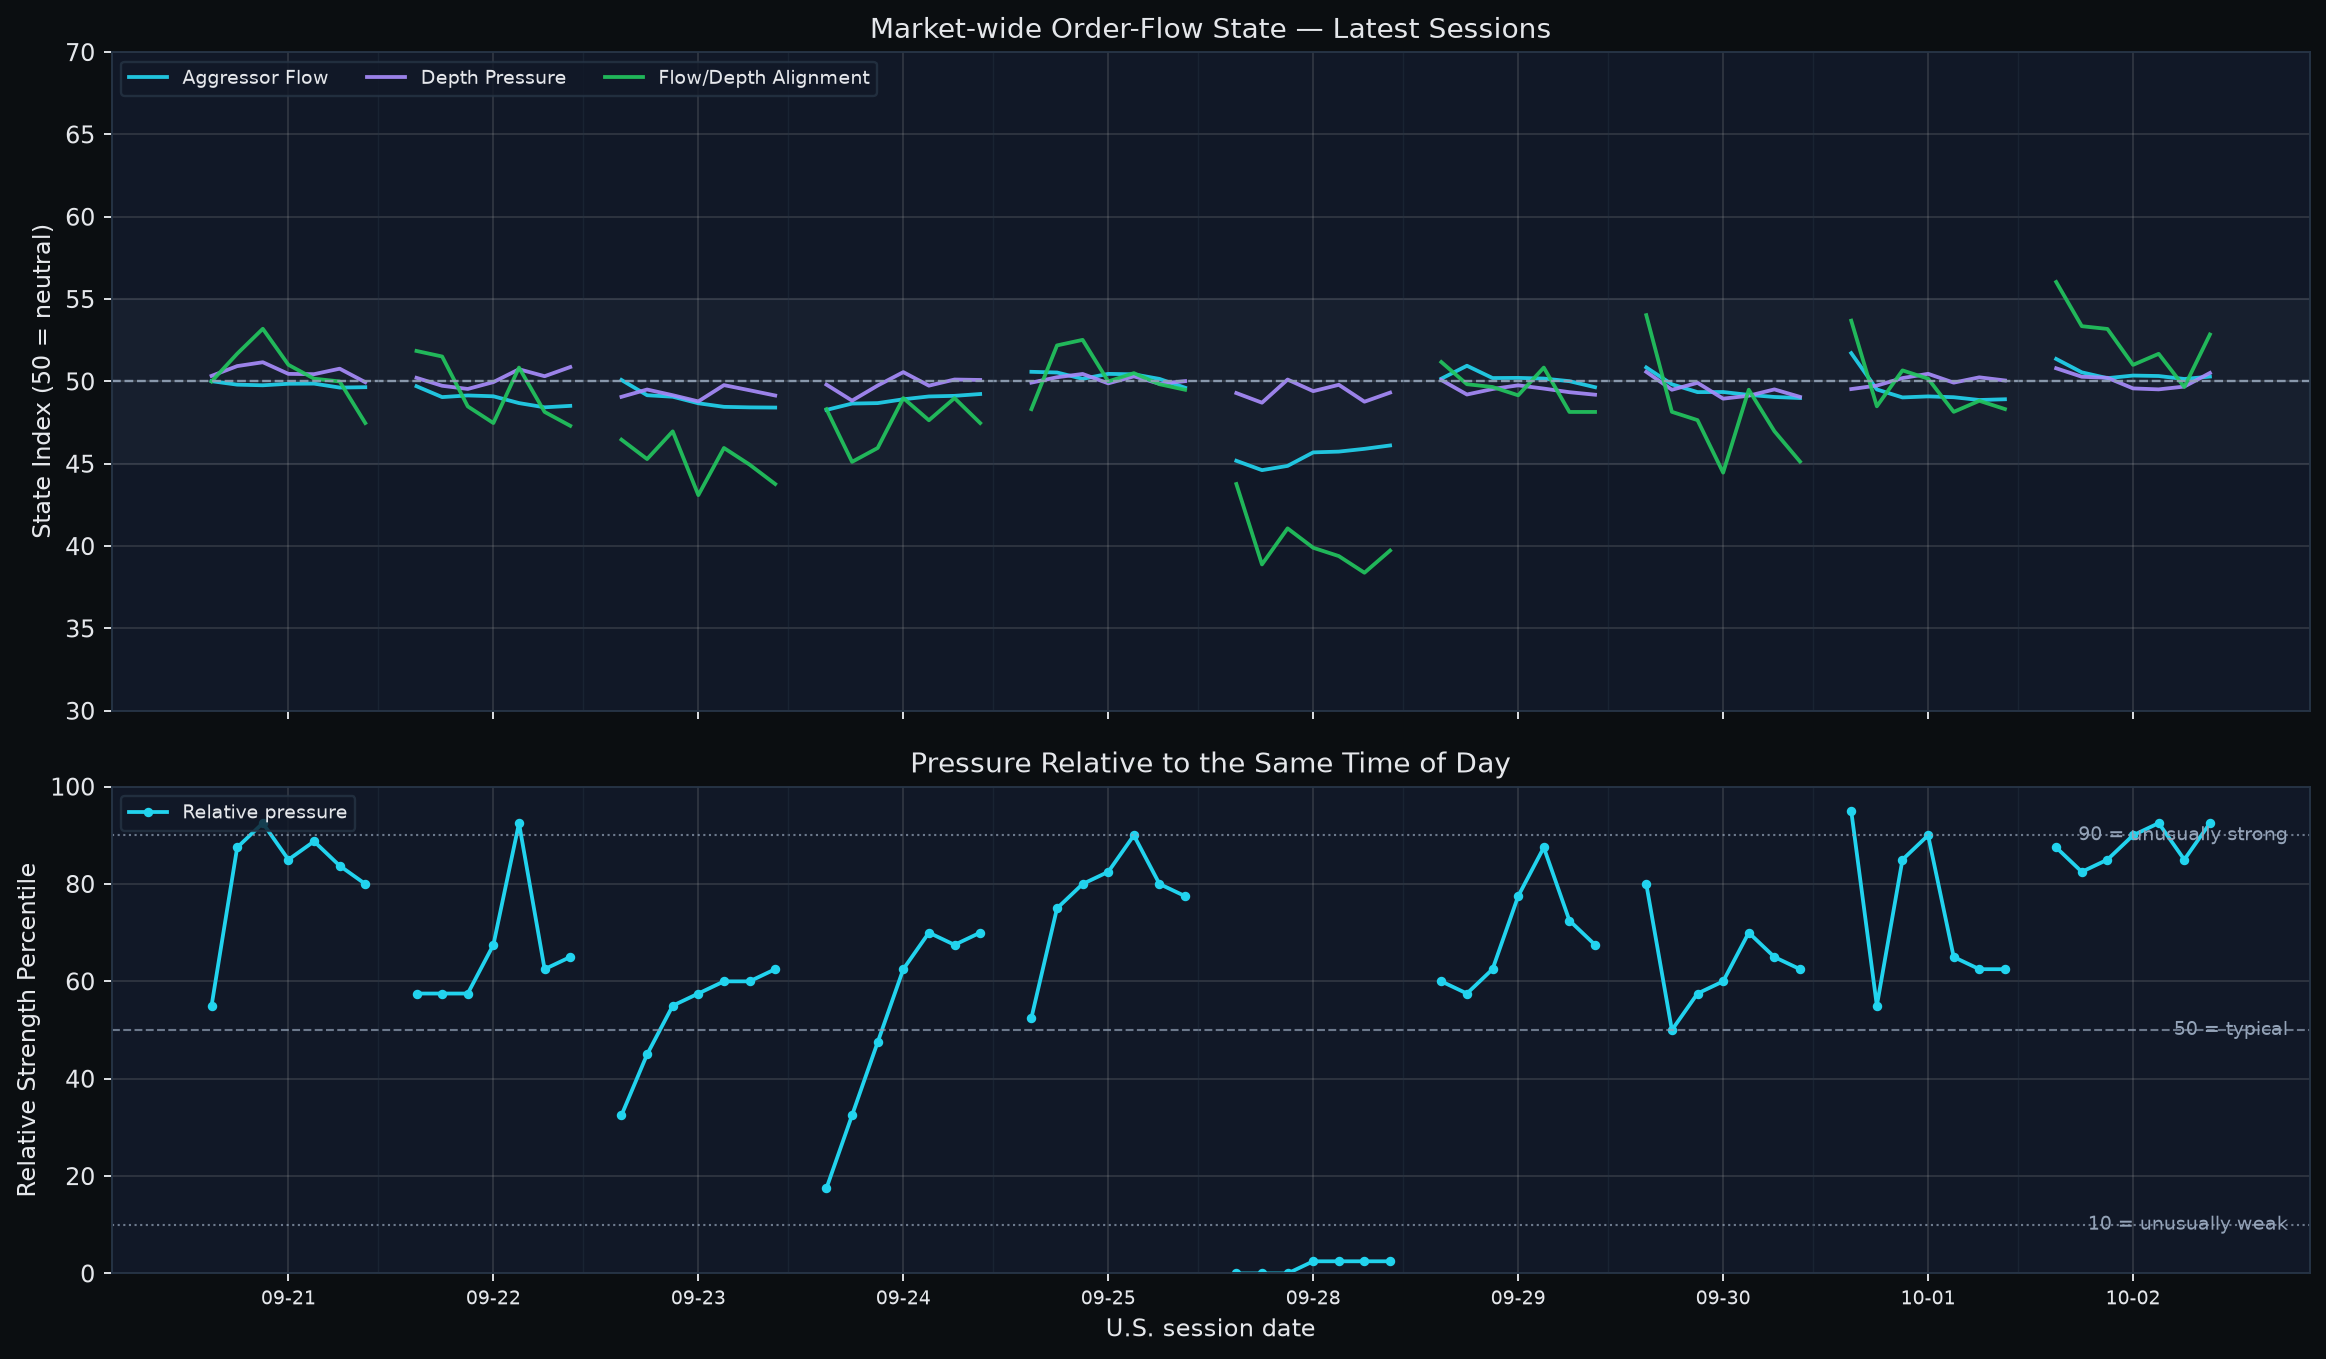
The intraday path was constructive in a different way. Aggressor Flow stayed above the 50 neutral reference at all seven checkpoints. Depth Pressure slipped below 50 during the middle of the day, and Alignment briefly lost neutral at 14:30. The final hour then repaired all three axes: Aggressor rose to 50.30, Depth to 50.51 and Alignment to 52.85. Bull-aligned breadth increased by 3.69 percentage points from 14:30 to the close, Bear-aligned breadth fell by 2.68 points, and sell-absorption-compatible breadth dropped sharply. This qualifies as a successful late state repair, not merely an upslope that remained below neutral.
That does not make the session a clean broad-risk-on signal. The equal-weight universe still lost about 0.39% from open to close and headline breadth remains below practical balance. The repair therefore reduces the next-session order-flow burden, but it does not remove the need for persistence. A constructive follow-through now requires the three state axes to stay above 50 through the early and midday checkpoints while breadth improves and the 252-day new-low spike stops expanding.
My 3-10TD base case is selectively constructive after a successful late order-flow repair, with confidence capped by weak breadth and localized long-horizon new-low damage. Sector leadership is also selective. Asset Management & Capital Markets is the cleanest Bull leader; Semiconductors and Enterprise Software are strong on the Bull side but also sit near the top of Bear risk; Autos and Midstream entered the eligible Top5 with narrow participation. The final publication list - INTC, BMNR, U, APLD, RIOT, MSTR, SMCI, ACN, BLK and MARA - all pass the strict recent-support layer, but their trend states and slower context differ materially.
How to read today's indicators
| Indicator | Reader scale | Interpretation |
|---|---|---|
| Market-wide order-flow state | Three component indices; 50 = neutral | Aggressor Flow, Depth Pressure and Flow/Depth Alignment answer different questions. Read confirmation or divergence across the three; they are not probabilities. |
| Same-time order-flow percentile | 0-100; 50 = same-time historical median | 90 is unusually strong and 10 unusually weak for that intraday slot. This is historical context, not event probability. |
| Flow x depth state breadth | Cross-sectional percentages | Bull/Bear aligned show joint direction; absorption-compatible states describe divergence only, not proven actor intent. |
| Market breadth | 0-1; practical balance ~0.50 | Above 0.50 means broader participation. Direction and slope show whether participation is improving or fading. |
| z-score | 0 = historical mean | |z| ~1 is notable and |z| ~2 is unusual. It is standardized distance, not probability. |
| Historical percentile | 0-100; 50 = median | 90+ is historically elevated. A percentile is not an event probability. |
| FLOW_SCORE_RANK | 0-1; 0.50 = median | 0.80+ is relatively strong slow context. It is confirmation/context, not a standalone entry signal. |
| Financial / 13F price divergence | Approx. -1 to +1; 0 = little gap | Positive means slow context is ahead of price; negative means price is ahead. +/-0.20 and +/-0.50 are reader bands only, not learned thresholds. |
| Expected next-session range | Non-directional high-low amplitude | Always pair the raw estimate with its same-day cross-sectional percentile. It is not an upside target. |
1. Price, breadth and damage: near the highs, but one tail measure has broken higher
| Layer | Current reading | Interpretation |
|---|---|---|
| S&P 500 | 7,722.72; +0.57% vs MA5; +0.69% vs MA20; close at 41% of daily range | Price remains above both short and medium averages, but the close was not near the daily high. |
| Nasdaq Composite | 27,190.86; +1.05% vs MA5; +2.12% vs MA20; close at 33% of daily range | Trend geometry is stronger than the S&P, but late price control was still mixed. |
| Market breadth | 0.447; 5TD change +0.014; 36th historical percentile | Participation improved slightly but remains below practical balance. |
| Breadth slope / McClellan | Slope +0.18z; McClellan -0.14z | Breadth momentum is roughly neutral rather than confirming the indexes. |
| New-low pressure | 20D +0.26z; 252D +2.38z | Long-horizon tail damage is unusual even while the shorter new-low window is not. |
| Propagation checks | Down-3% breadth -0.80z; cross-sectional vol -0.92z | The 252D new-low spike has not become synchronized broad downside damage. |
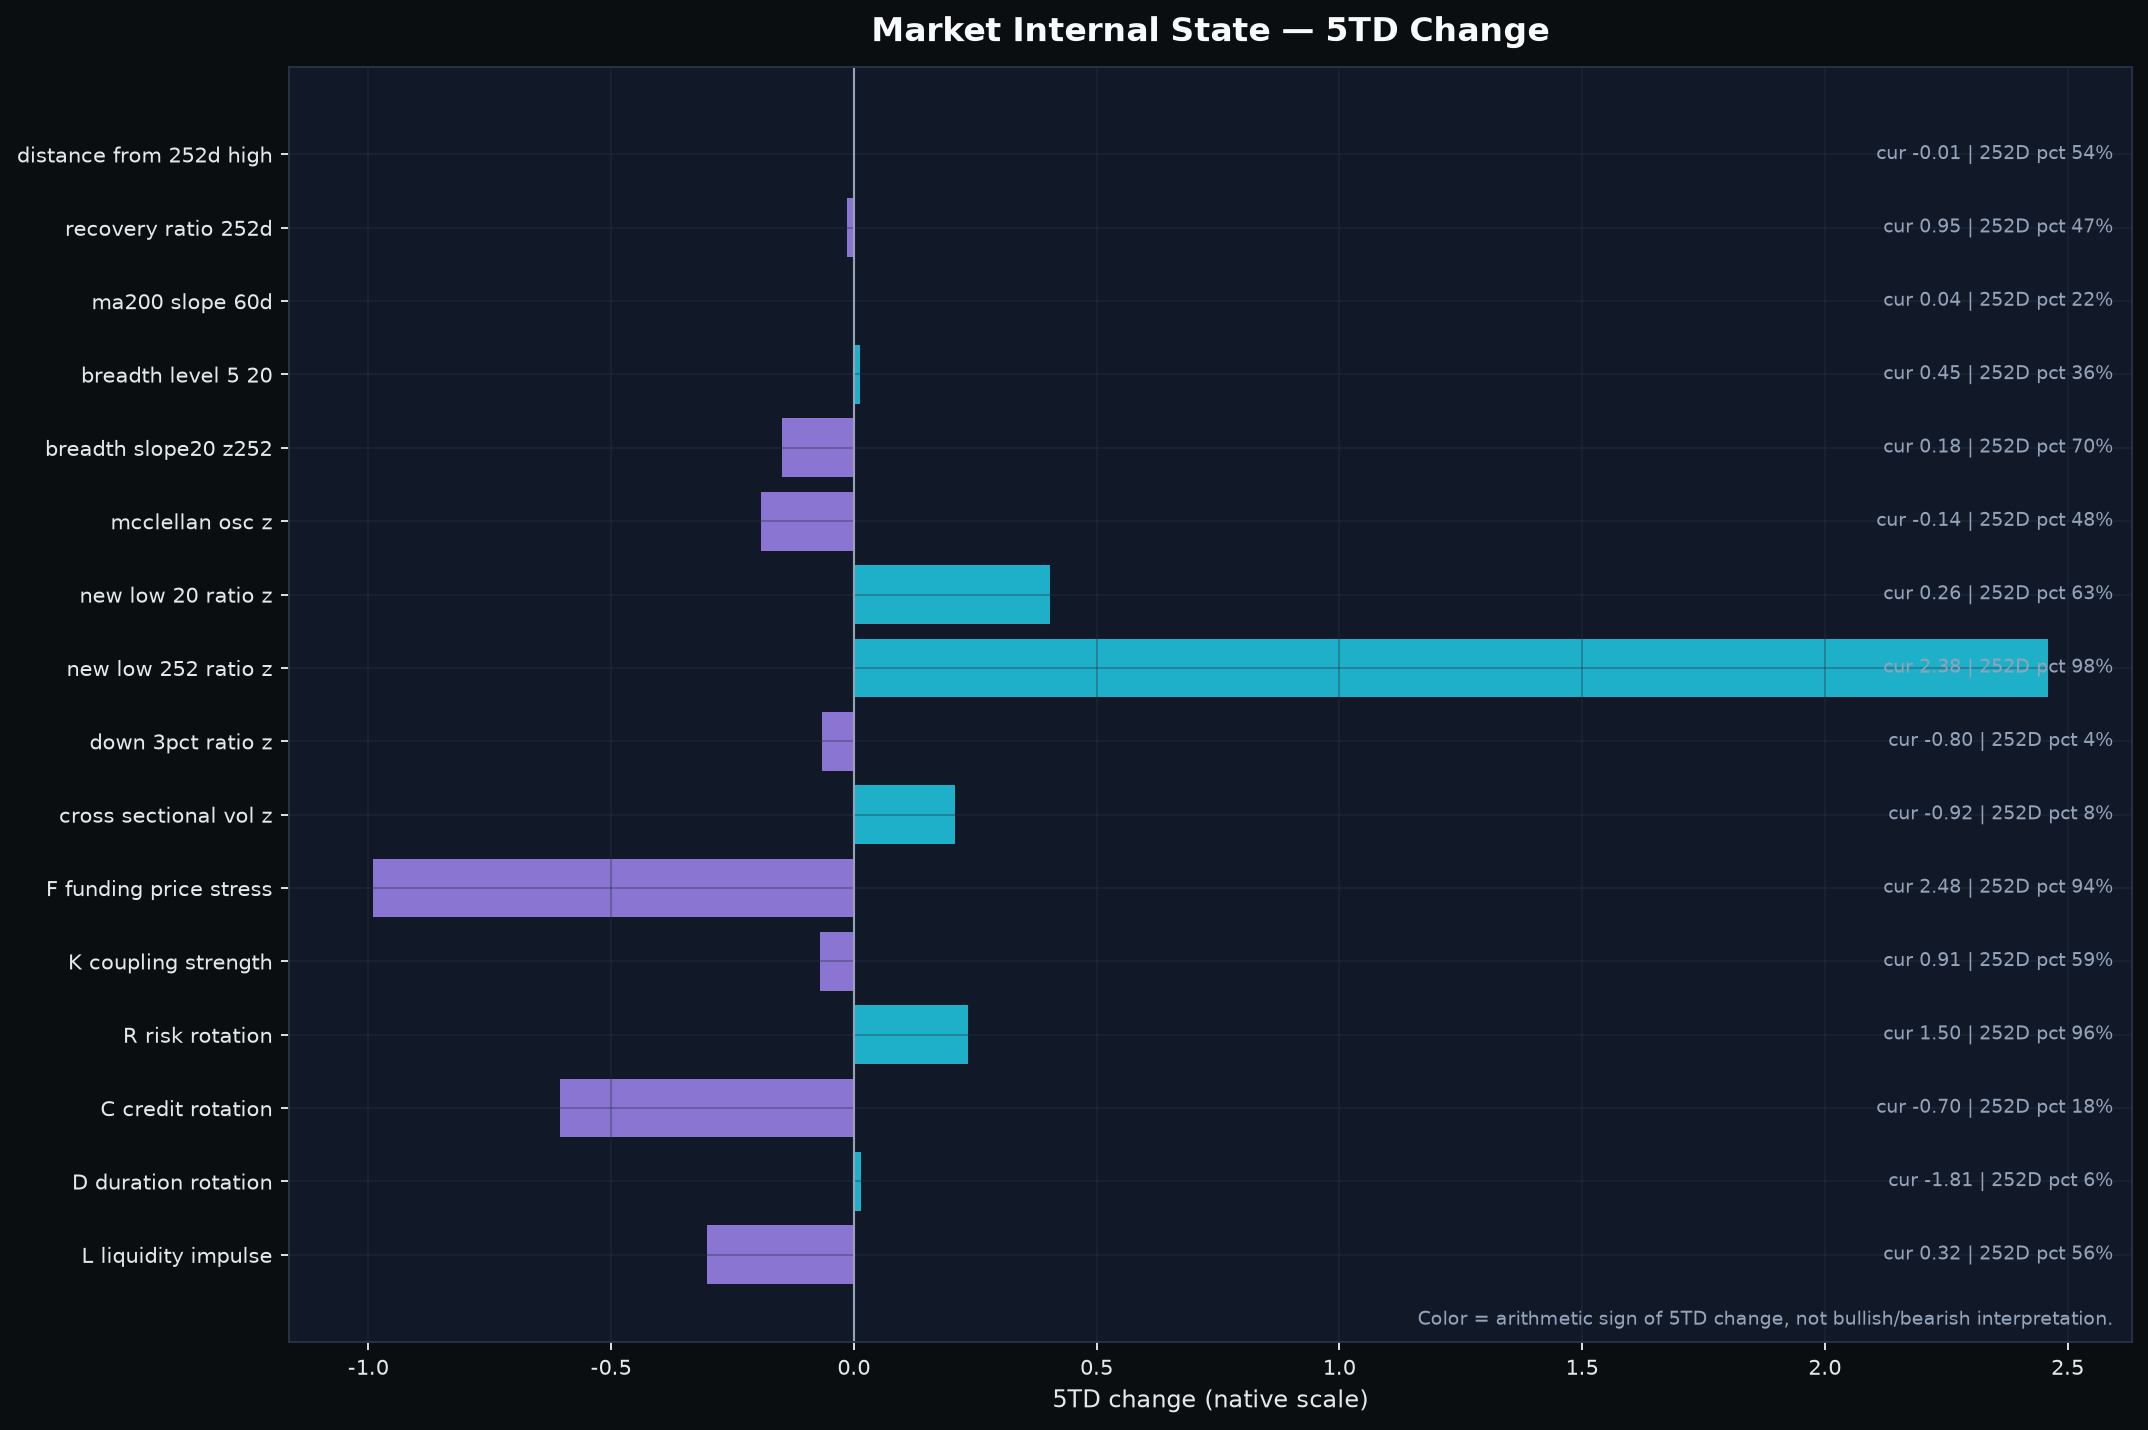
The broad price structure is healthier than the breadth data. Both major benchmarks are above MA5 and MA20, the Nasdaq's medium-term cushion is more than two percentage points, and the S&P is still only about 0.98% below its 252-day high. The long-term MA200 slope is also strongly positive. None of those observations describe a market already in a completed breakdown.
The weak spot is participation. Breadth at 0.447 is below the practical 0.50 balance area, and the McClellan-style measure is only around neutral. More importantly, long-horizon new-low damage is +2.38z and sits near the 98th percentile of its trailing distribution. That is a genuine tail warning because it says a subset of stocks is making unusually weak long-run price prints even while the benchmarks stay close to highs.
But the rest of the damage stack refuses to confirm a generalized liquidation. Twenty-day new-low pressure is only +0.26z, down-3% breadth is deeply below normal at -0.80z, and cross-sectional volatility is -0.92z. The market's current vulnerability is therefore localized long-horizon damage, not synchronized short-horizon stress. The systemic-warning state remains elevated, but its percentile is not a calibrated crash probability and should not override the observable absence of broad propagation.
Decision relevance: the constructive case strengthens if the 252-day new-low spike retreats while breadth moves toward 0.50 and the indexes hold MA20. The bearish falsifier is not simply one weak index day; it is the combination of expanding new lows, rising down-3% breadth, a jump in cross-sectional volatility and a loss of the repaired order-flow state.
2. Order flow: a real late repair, with a lower burden for the next session
| Time | Aggressor | Depth | Alignment | Same-time pct. | Bull aligned | Bear aligned | Buy absorption | Sell absorption | EW bar |
|---|---|---|---|---|---|---|---|---|---|
| 09:30 | 51.37 | 50.80 | 56.04 | 87.5 | 21.5% | 9.4% | 18.1% | 14.8% | +0.20% |
| 10:30 | 50.55 | 50.29 | 53.36 | 82.5 | 19.5% | 12.8% | 12.1% | 14.8% | -0.50% |
| 11:30 | 50.20 | 50.22 | 53.19 | 85.0 | 19.5% | 13.1% | 14.1% | 15.1% | ~0.00% |
| 12:30 | 50.36 | 49.58 | 51.01 | 90.0 | 18.5% | 16.4% | 13.4% | 18.8% | -0.09% |
| 13:30 | 50.33 | 49.52 | 51.68 | 92.5 | 17.8% | 14.4% | 13.8% | 16.4% | +0.07% |
| 14:30 | 50.15 | 49.69 | 49.66 | 85.0 | 15.1% | 15.8% | 12.4% | 18.5% | +0.14% |
| 15:30 | 50.30 | 50.51 | 52.85 | 92.5 | 18.8% | 13.1% | 15.8% | 11.7% | ~0.00% |
The session began with a strong-looking state. Aggressor Flow was 51.37, Depth 50.80 and Alignment 56.04; the same-time percentile was 87.5. The early fade was meaningful but not catastrophic. Aggressor remained just above 50 at 10:30 and stayed above neutral for every checkpoint. Depth weakened into the middle of the day, while Alignment stayed positive until the 14:30 checkpoint.
The midday pattern matters because it separates path deterioration from state loss. At 12:30 and 13:30, Depth was below 50 but Aggressor and Alignment remained above. At 14:30, Alignment briefly dipped to 49.66 while Depth was still 49.69. That was the point at which the intraday state looked most vulnerable: two of three axes were below neutral and Bull/Bear aligned breadth was nearly balanced.
The final hour then produced a broad repair rather than a cosmetic uptick. Aggressor rose by about 0.15 points, Depth by 0.83 and Alignment by 3.19. All three closed above 50. Bull-aligned breadth rose from 15.1% to 18.8%, Bear-aligned breadth fell from 15.8% to 13.1%, buy-absorption-compatible breadth increased and sell-absorption-compatible breadth fell by more than six percentage points. The close also sat at the 92.5th same-time percentile. On the contract's effort-versus-state test, this is a late repair with full neutral reclaim and directional breadth confirmation.
The counterevidence is price breadth. The equal-weight universe was still roughly -0.39% from open to close, and headline breadth remained weak. The order-flow repair therefore tells us that the closing microstructure improved; it does not prove the entire cross-section repaired. The next session inherits a lower repair burden, not zero burden. Confirmation now means sustaining all three axes above 50 through the early/midday sequence while equal-weight price and breadth stop lagging.
3. Cross-asset context: tight absolute money, an easing impulse, and a metals-led common mode
| Layer | Current evidence | Interpretation | Counterevidence / limit |
|---|---|---|---|
| F - price-of-money stress | State +2.26z; 5D shock -1.13z; 2Y -8.5bp over 5D; real 10Y -1.5bp | Absolute financing stress remains high, but the newest rate impulse is easing. | A high F level is still a valuation headwind; easing shock is not the same as easy money. |
| L - liquidity impulse | State +0.32z; 5D shock -0.20z | Liquidity is mildly positive but not accelerating. | This is not strong enough to override weak breadth or tail damage. |
| R - relative preference | 20D +0.304; short Treasury is the single active destination | The strongest 20D price-implied preference is toward short duration. | R is relative-price evidence, not observed dollar flow. |
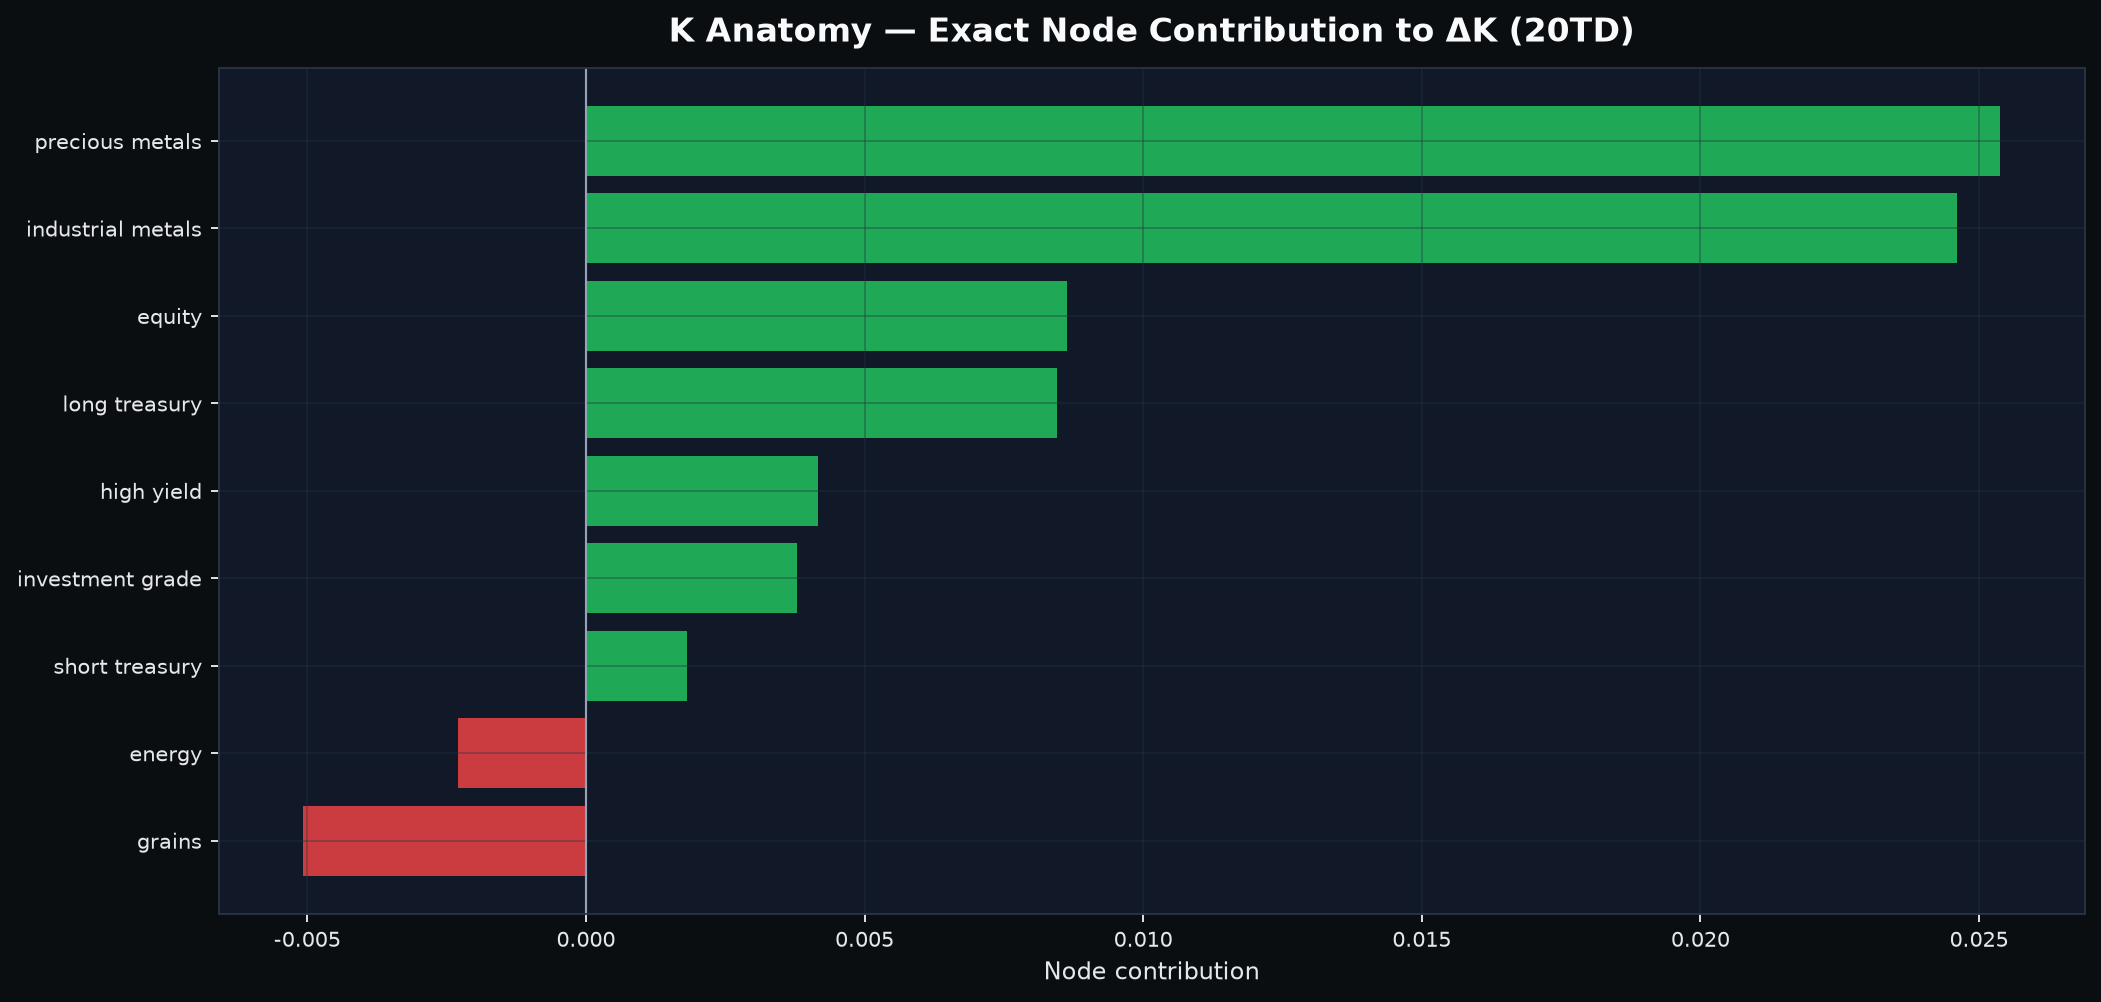
| K - common-mode coupling | Raw 0.504; +0.069 over 20D; +0.91z | Cross-asset co-movement strengthened. Precious and industrial metals explain most of the increase. | K measures coupling strength, not bullish or bearish direction for equities. |
| CFTC positioning | Sep. 29 report; 3TD snapshot age; equity ratio +29.4%; short-Treasury ratio -35.6% | Weekly positioning provides lagged confirmation/context; short-Treasury positioning moved less short over four reports while equities remain net long. | Fresh by official schedule does not mean same-day; later market sessions are outside the snapshot. |
Public macro context fits the distinction between a tight absolute rate level and an easing short-horizon impulse. The September U.S. payroll report showed only 29,000 new jobs against 90,000 expected, and Reuters reported that Treasury yields fell after the release before the market opened. That public fact does not create the private F signal, but it is consistent with the negative five-day F shock seen in the quantitative stack.
R is also easy to overread. The 20-day measure is positive at +0.304, and the current destination is short Treasuries. The CFTC comparison provides directionally compatible lagged context: the short-Treasury sleeve remains net short, but that short has been reduced over the last four reports. Because R is a relative-price construct and CFTC is weekly futures positioning, neither can be described as same-day dollar flow.
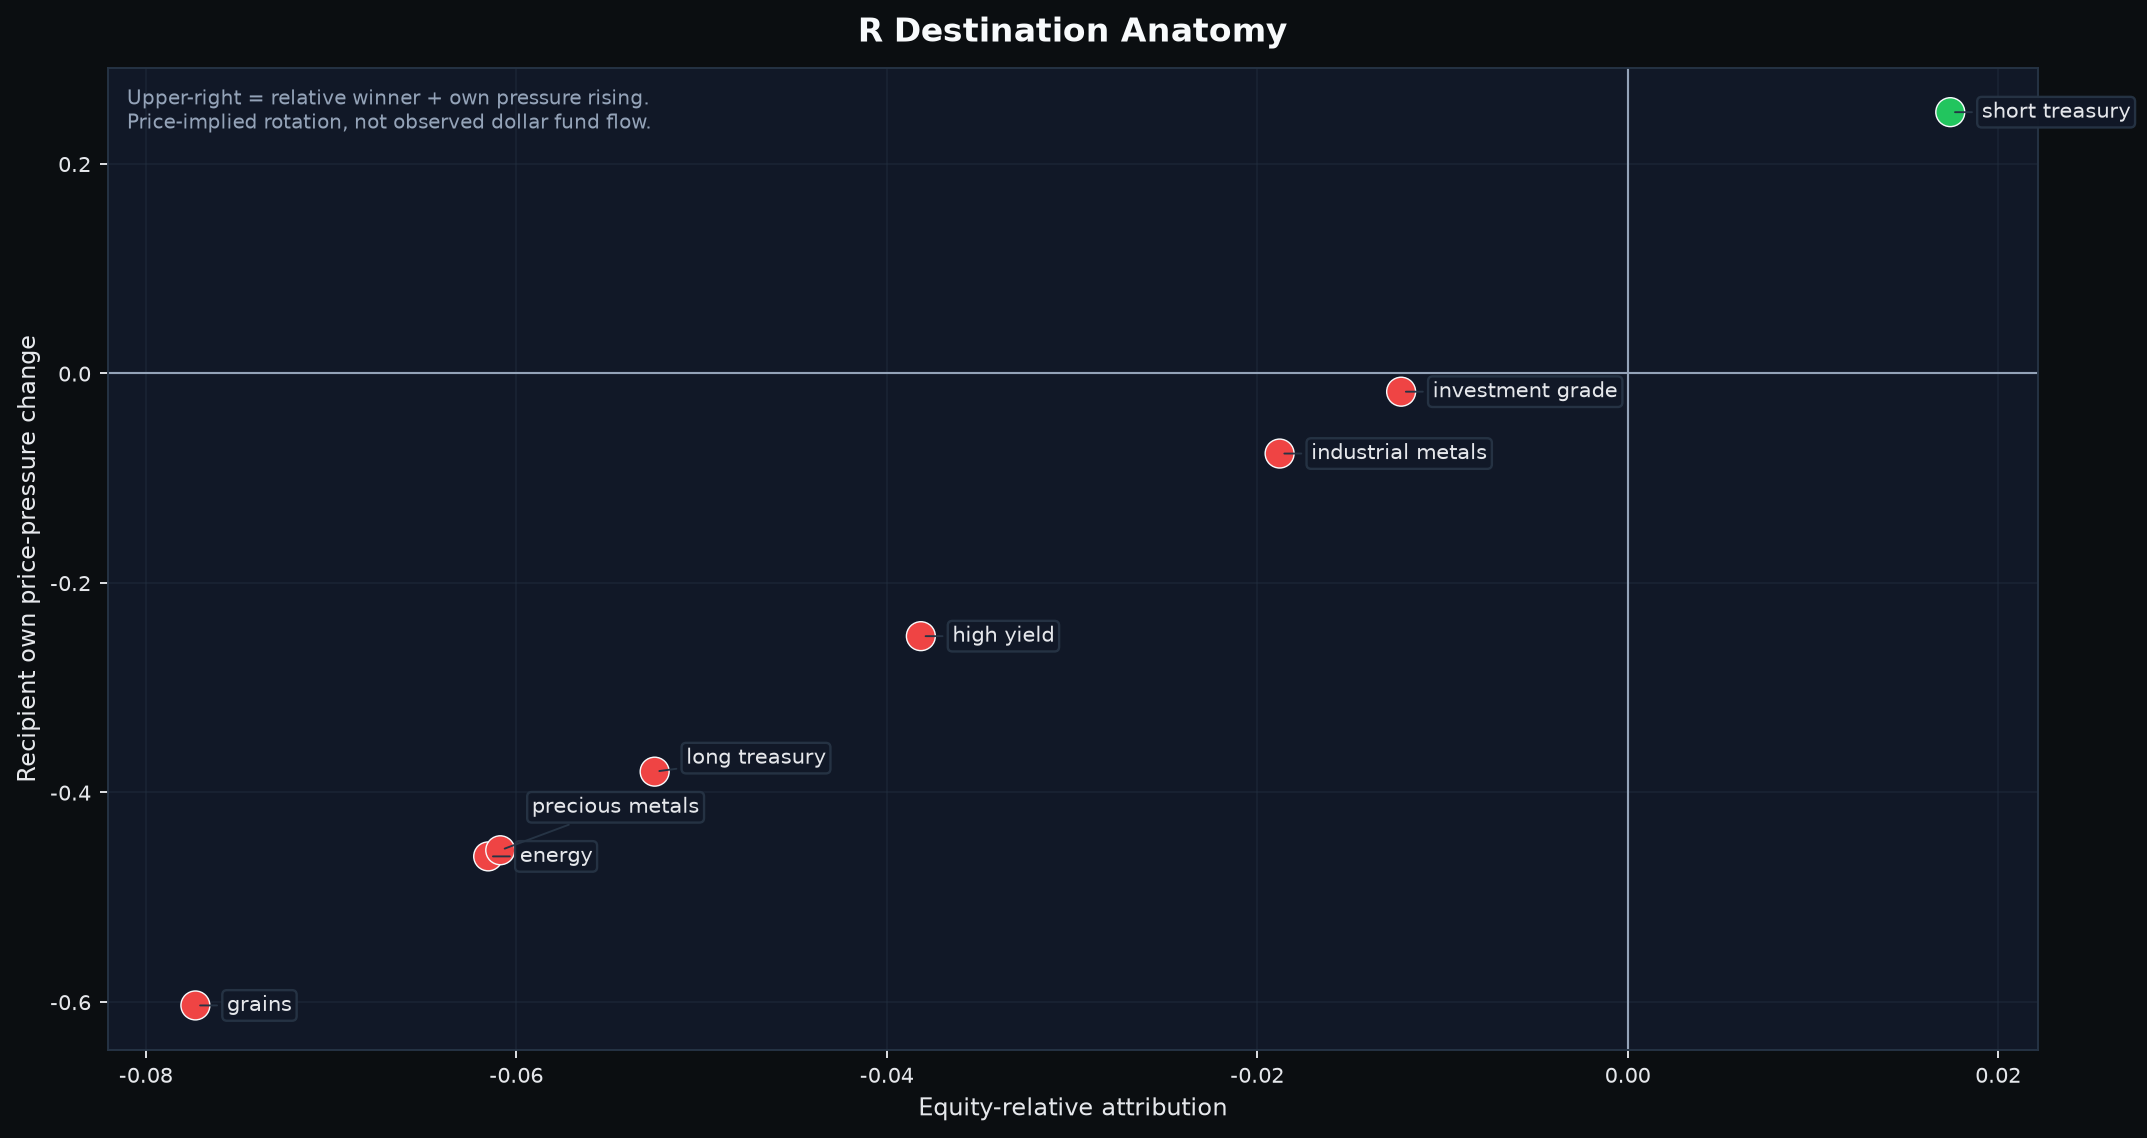
K has strengthened over 20 days, but the composition matters more than the headline. Precious metals contribute about 36.5% of the absolute 20-day K increase and industrial metals about 35.4%, while equity contributes only about 12.4%. That makes the current common mode more consistent with a macro-sensitive metals/duration configuration than an equity-led synchronized risk-on state.
The CFTC data are fresh by the official release schedule but still lag the article by three trading days because the Oct. 2 release reflects the Sep. 29 observation date. Equity positioning remains net long, short-Treasury positioning remains net short, and the four-report changes are mixed across sleeves. That is useful confirmation/context, not a reason to overwrite the daily market evidence.
4. Sector leadership: one clean leader, two major conflicts, two narrow entrants
| Bull eligible rank | Sector | Bear-risk rank | Balance state | Representative names | Public read |
|---|---|---|---|---|---|
| 1.0 | Asset Management & Capital Markets | 21 | Bull-dominant | CRCL, COIN, BLK, RIOT, HOOD, BMNR, MARA | Broadest clean leader, reinforced by crypto/capital-markets names. |
| 2.0 | Semiconductors & Tech Hardware | 1 | Two-sided/conflicted | CRDO, ASTS, CBRS, JBL, LITE, SMCI, INTC | Powerful Bull leadership but the highest Bear-risk score; read as conflict, not a clean sector bet. |
| 3.0 | Enterprise Software & IT Services | 3 | Two-sided/conflicted | FICO, MSTR, NOW, U, ACN, MDB, APLD | Another high-conviction two-sided sector with many selected stocks but substantial Bear-risk overlap. |
| 4.0 | Autos & Mobility | 5 | Two-sided/conflicted | RIVN, F, CVNA, TSLA, AZO, GM, ORLY | New Top5 entrant with narrow Bull participation and simultaneous Bear risk. |
| 5.0 | Midstream, Refining & Fossil Fuels | 12 | Bull-dominant | VLO, MPC, LNG, WMB, PSX, KMI | Bull-dominant but narrow, led mainly by VLO in the Bull Top30. |
The eligible Bull Top5 changed from the prior session. Asset Management, Semiconductors and Enterprise Software remained in the leading group. Autos entered at eligible #4 and Midstream/Refining entered at #5, while Healthcare and Internet/Media/Telecom fell out of the eligible Top5. Those are temporal observations from the five-session history; current ranks and balance states use the Oct. 2 quantitative sector snapshot.
| Sector | Current leading subcluster(s) | Key names | Economic linkage | Quant / price-support confirmation | Why now / public mechanism | Strongest counterevidence |
|---|---|---|---|---|---|---|
| Asset Management & Capital Markets | Crypto-linked capital markets, asset managers, digital-asset treasury/mining | CRCL, COIN, BLK, RIOT, HOOD, BMNR, MARA | Crypto-beta and capital-markets sensitivity | Seven Bull Top30 names; four final publication stocks sit in this sector | Same-day context (not a causal timing claim): Bitcoin and several crypto-linked U.S. equities were higher; BMNR/Strategy/Riot filings document direct crypto or infrastructure exposures. | Leadership is broad inside the sector, but high rate levels and crypto volatility can reverse quickly. |
| Semiconductors & Tech Hardware | AI connectivity, servers, compute infrastructure | CRDO, ASTS, CBRS, JBL, LITE, SMCI, INTC | AI infrastructure capex and high-speed connectivity | Seven Bull Top30 names, but Bear-risk rank #1 | Credo reported +114.7% YoY revenue; Supermicro is shipping Vera Rubin NVL72 racks; Intel continues to emphasize scalable AI infrastructure. | Bear-risk rank #1 and multiple names simultaneously appear in Bear Top30; AI financing stress is an external counterweight. |
| Enterprise Software & IT Services | AI/data-center infrastructure plus software platforms | FICO, MSTR, NOW, U, ACN, MDB, APLD | AI compute/data-center demand, enterprise software and digital-asset treasury exposure | Seven Bull Top30 names; Bear-risk rank #3 | APLD has 1.4 GW of contracted critical IT load; Unity announced day-one Meta VR support; Strategy remains a large Bitcoin-treasury vehicle. | MDB is Bear rank #2 and the sector remains two-sided; higher financing costs can pressure capital-intensive AI builds. |
| Autos & Mobility | EV deliveries and vehicle demand | RIVN, F, CVNA, TSLA | Vehicle delivery momentum and consumer demand | Only RIVN is Bull Top30 while TSLA is Bear Top30; current state is two-sided | Tesla and Rivian both reported stronger-than-expected Q3 deliveries before the session. | Rivian shares still fell after maintaining annual guidance, showing that good operating data did not translate uniformly into price. |
| Midstream, Refining & Fossil Fuels | Refining margins and refined-product tightness | VLO, MPC, LNG, WMB, PSX, KMI | Tight gasoline/diesel/jet-fuel product balances | VLO is the only Bull Top30 representative; Bear-risk rank #12 | China suspended October oil-product exports outside Hong Kong/Macau, a public backdrop supportive of non-China refining margins. | The sector signal is narrow, and emergency stock releases or weaker product demand can compress margins. |
Asset Management & Capital Markets is the cleanest current leader because its Bull rank is #1 while Bear risk is only #21 in the current authoritative packet. The leadership is not a one-stock artifact: CRCL, COIN, BLK, RIOT, HOOD, BMNR and MARA all sit in the Bull Top30. Same-day public crypto context was also constructive, with Bitcoin and several listed crypto-linked equities higher. It is treated as contemporaneous context, not as a causal explanation for the sector rank, and it does not create the quantitative rank.
Semiconductors and Enterprise Software require the opposite reading. Both are genuine Bull leaders, but their Bear-risk ranks are #1 and #3. Credo's very strong revenue growth, Supermicro's Vera Rubin shipments, Intel's AI-infrastructure positioning and Applied Digital's contracted data-center load show why AI infrastructure remains an economically coherent demand cluster. Yet the two-sided rankings and stress in AI-related financing are equally material. Leadership here is powerful but not clean.
Autos entered the Top5 on a day when Tesla and Rivian reported stronger-than-expected Q3 deliveries before the U.S. open. That gives a credible public timing mechanism, but the internal sector map remains narrow and conflicted: RIVN is the only Bull Top30 representative while TSLA is also Bear Top30. Rivian's share-price weakness despite record deliveries and unchanged guidance is a useful control against treating good operating data as automatic price confirmation.
Midstream, Refining & Fossil Fuels is Bull-dominant but even narrower. VLO is the only Bull Top30 name. China's suspension of October refined-product exports was known before Friday's session and is plausibly supportive of non-China refining margins, but the signal still needs broader constituent confirmation. Emergency fuel releases and softer product demand are the clearest external counterweights.
5. Stocks: strict support is common; trend and slow context are not
The table below preserves the mechanically selected publication order. `Selection tier/role` is display/context metadata; it does not override membership or order. Bull and Bear ranks are shown separately with the full 296-name denominator.
| Stock | Sector | Selection tier/role | Bull rank (of 296) | Bear rank (of 296) | Recent support confirmation | Live S1 distance | Vs MA20 | 5D return | Financial / delayed 13F context |
|---|---|---|---|---|---|---|---|---|---|
| INTC | Semiconductors & Tech Hardware | B | 28 of 296 | 33 of 296 | 2026-10-01 - Bullish Same Day Center Reclaim | +0.13% / 0.03 ATR | +6.89% | -2.98% | Fin 0.86 / 13F 0.81; div +0.48/+0.60 |
| BMNR | Asset Management & Capital Markets | B | 19 of 296 | 67 of 296 | 2026-10-01 - Bullish Same Day Center Reclaim | +0.22% / 0.03 ATR | +1.37% | -4.68% | n/a |
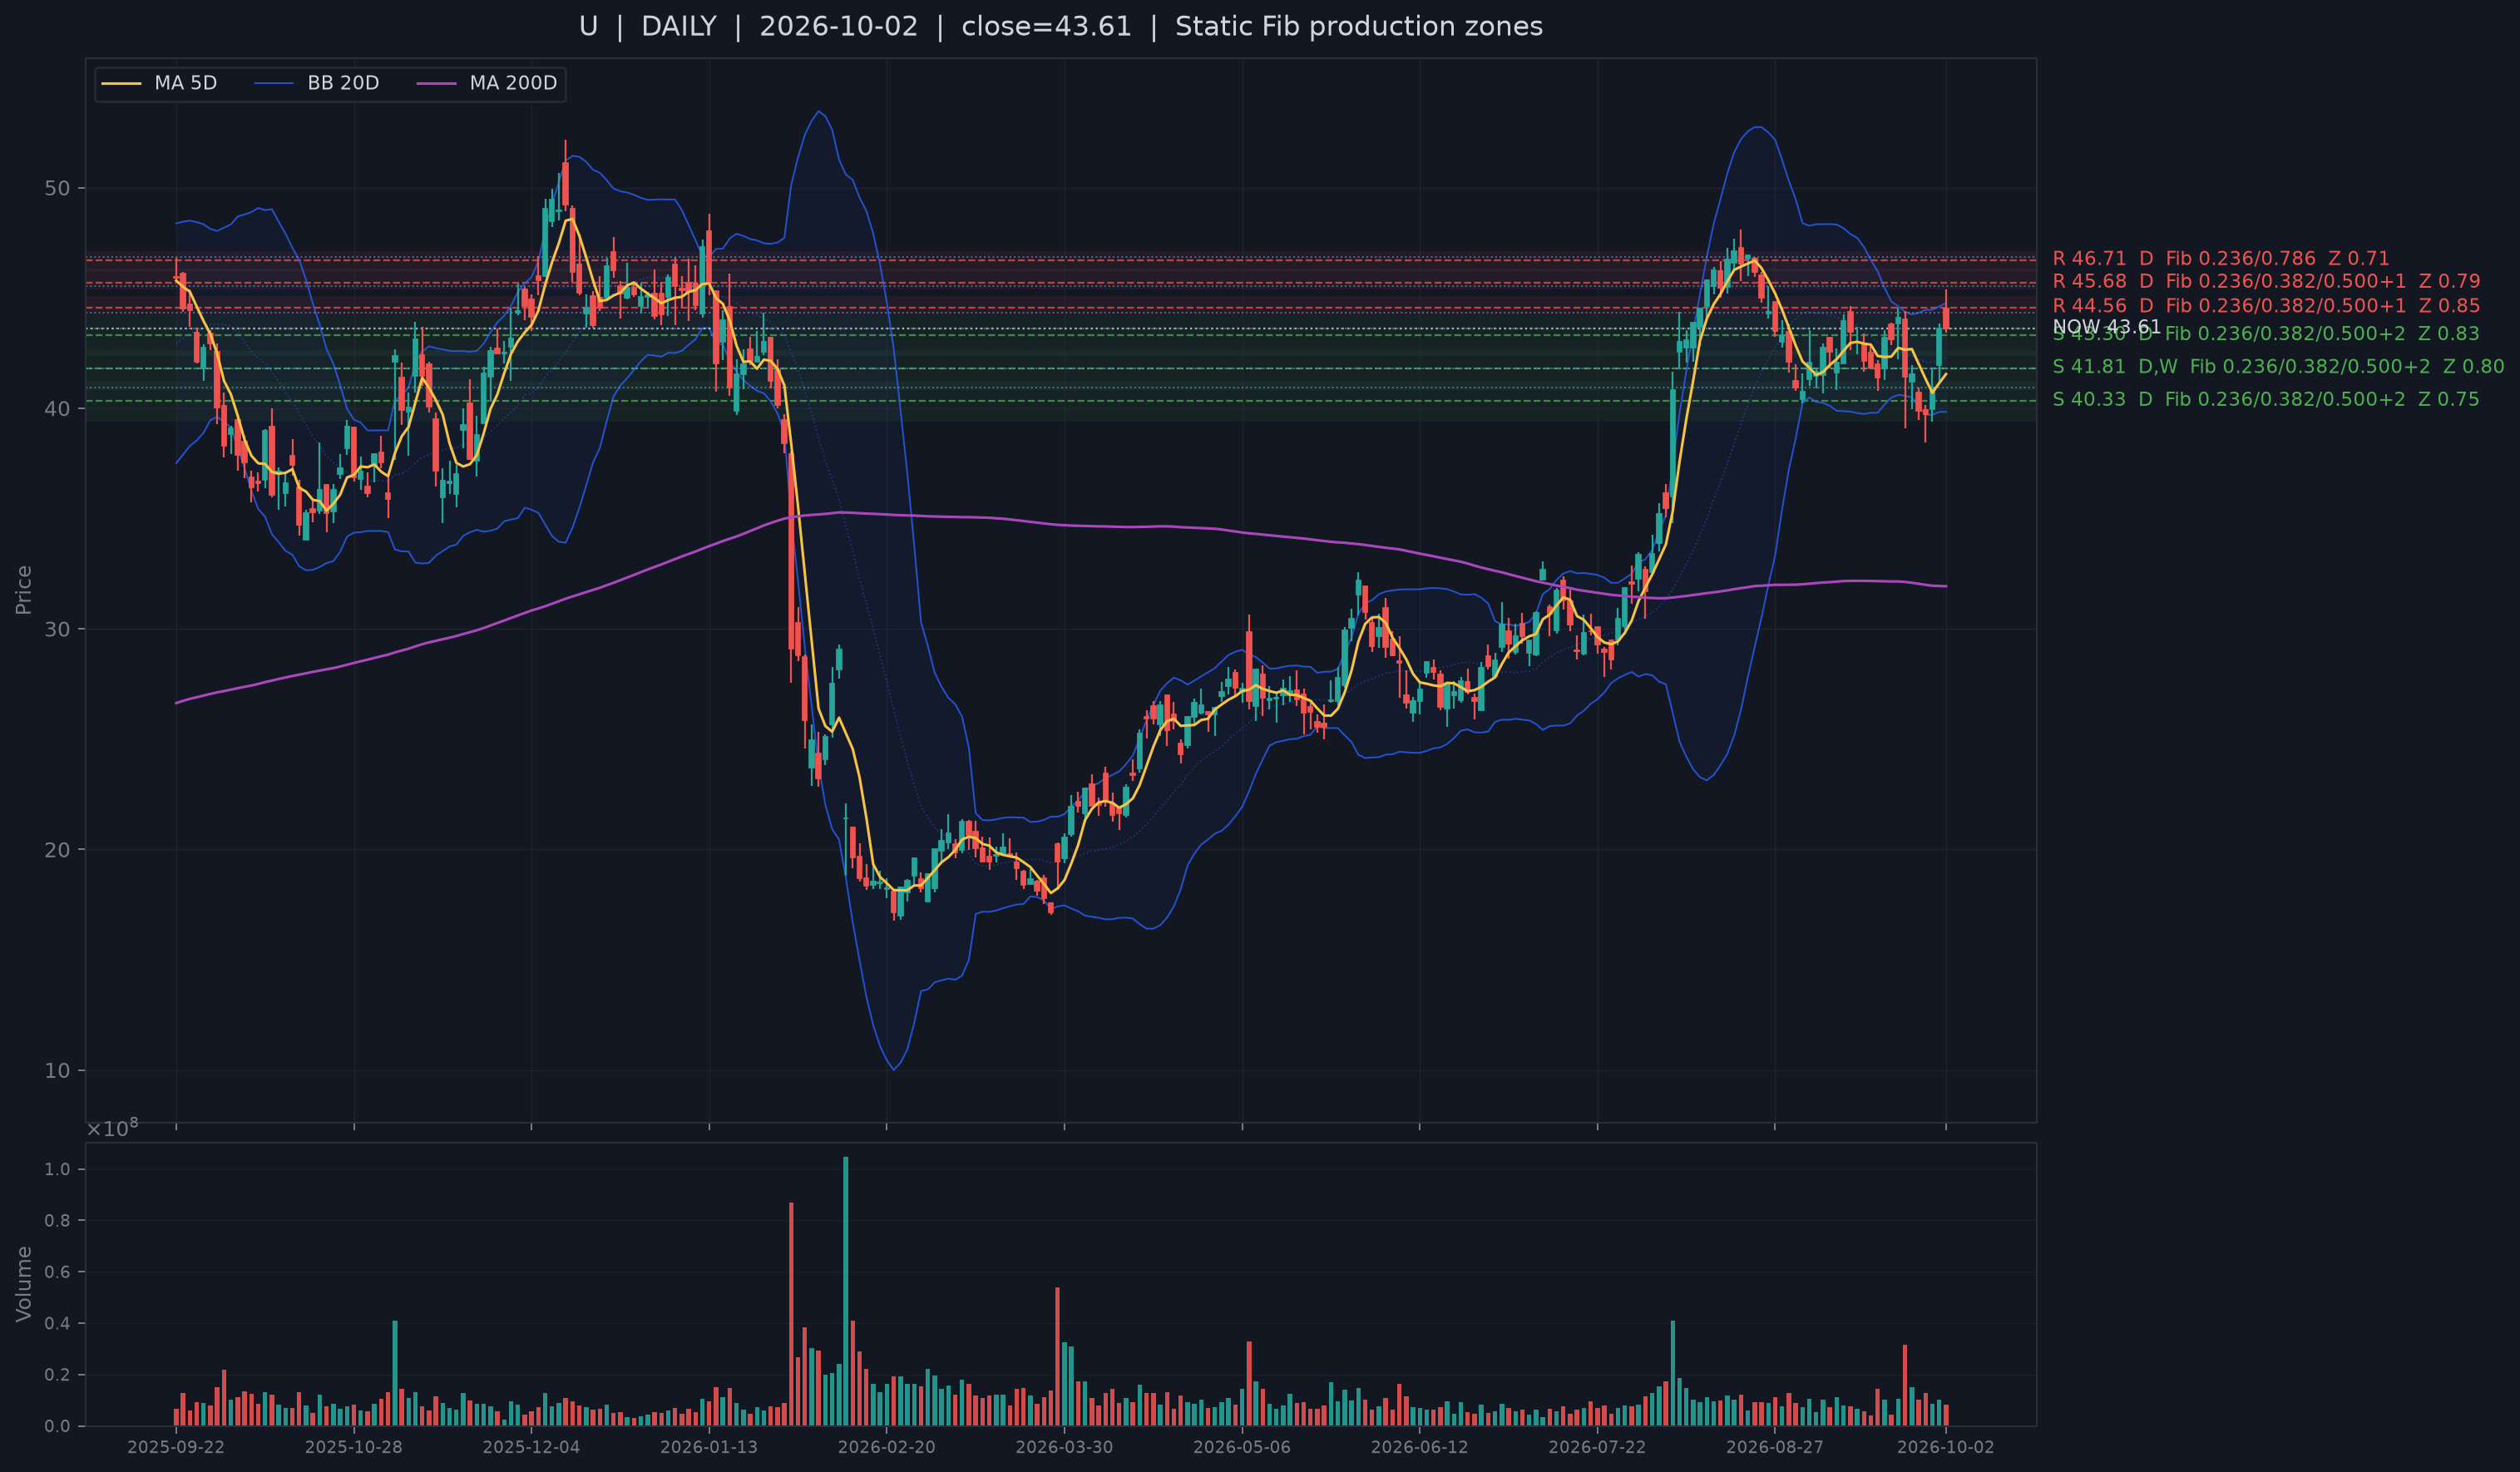
| U | Enterprise Software & IT Services | B | 25 of 296 | 43 of 296 | 2026-09-30 - Bullish Same Day Center Reclaim | +0.71% / 0.15 ATR | +3.11% | +4.96% | Fin 0.83 / 13F 0.04; div -0.29/-0.71 |
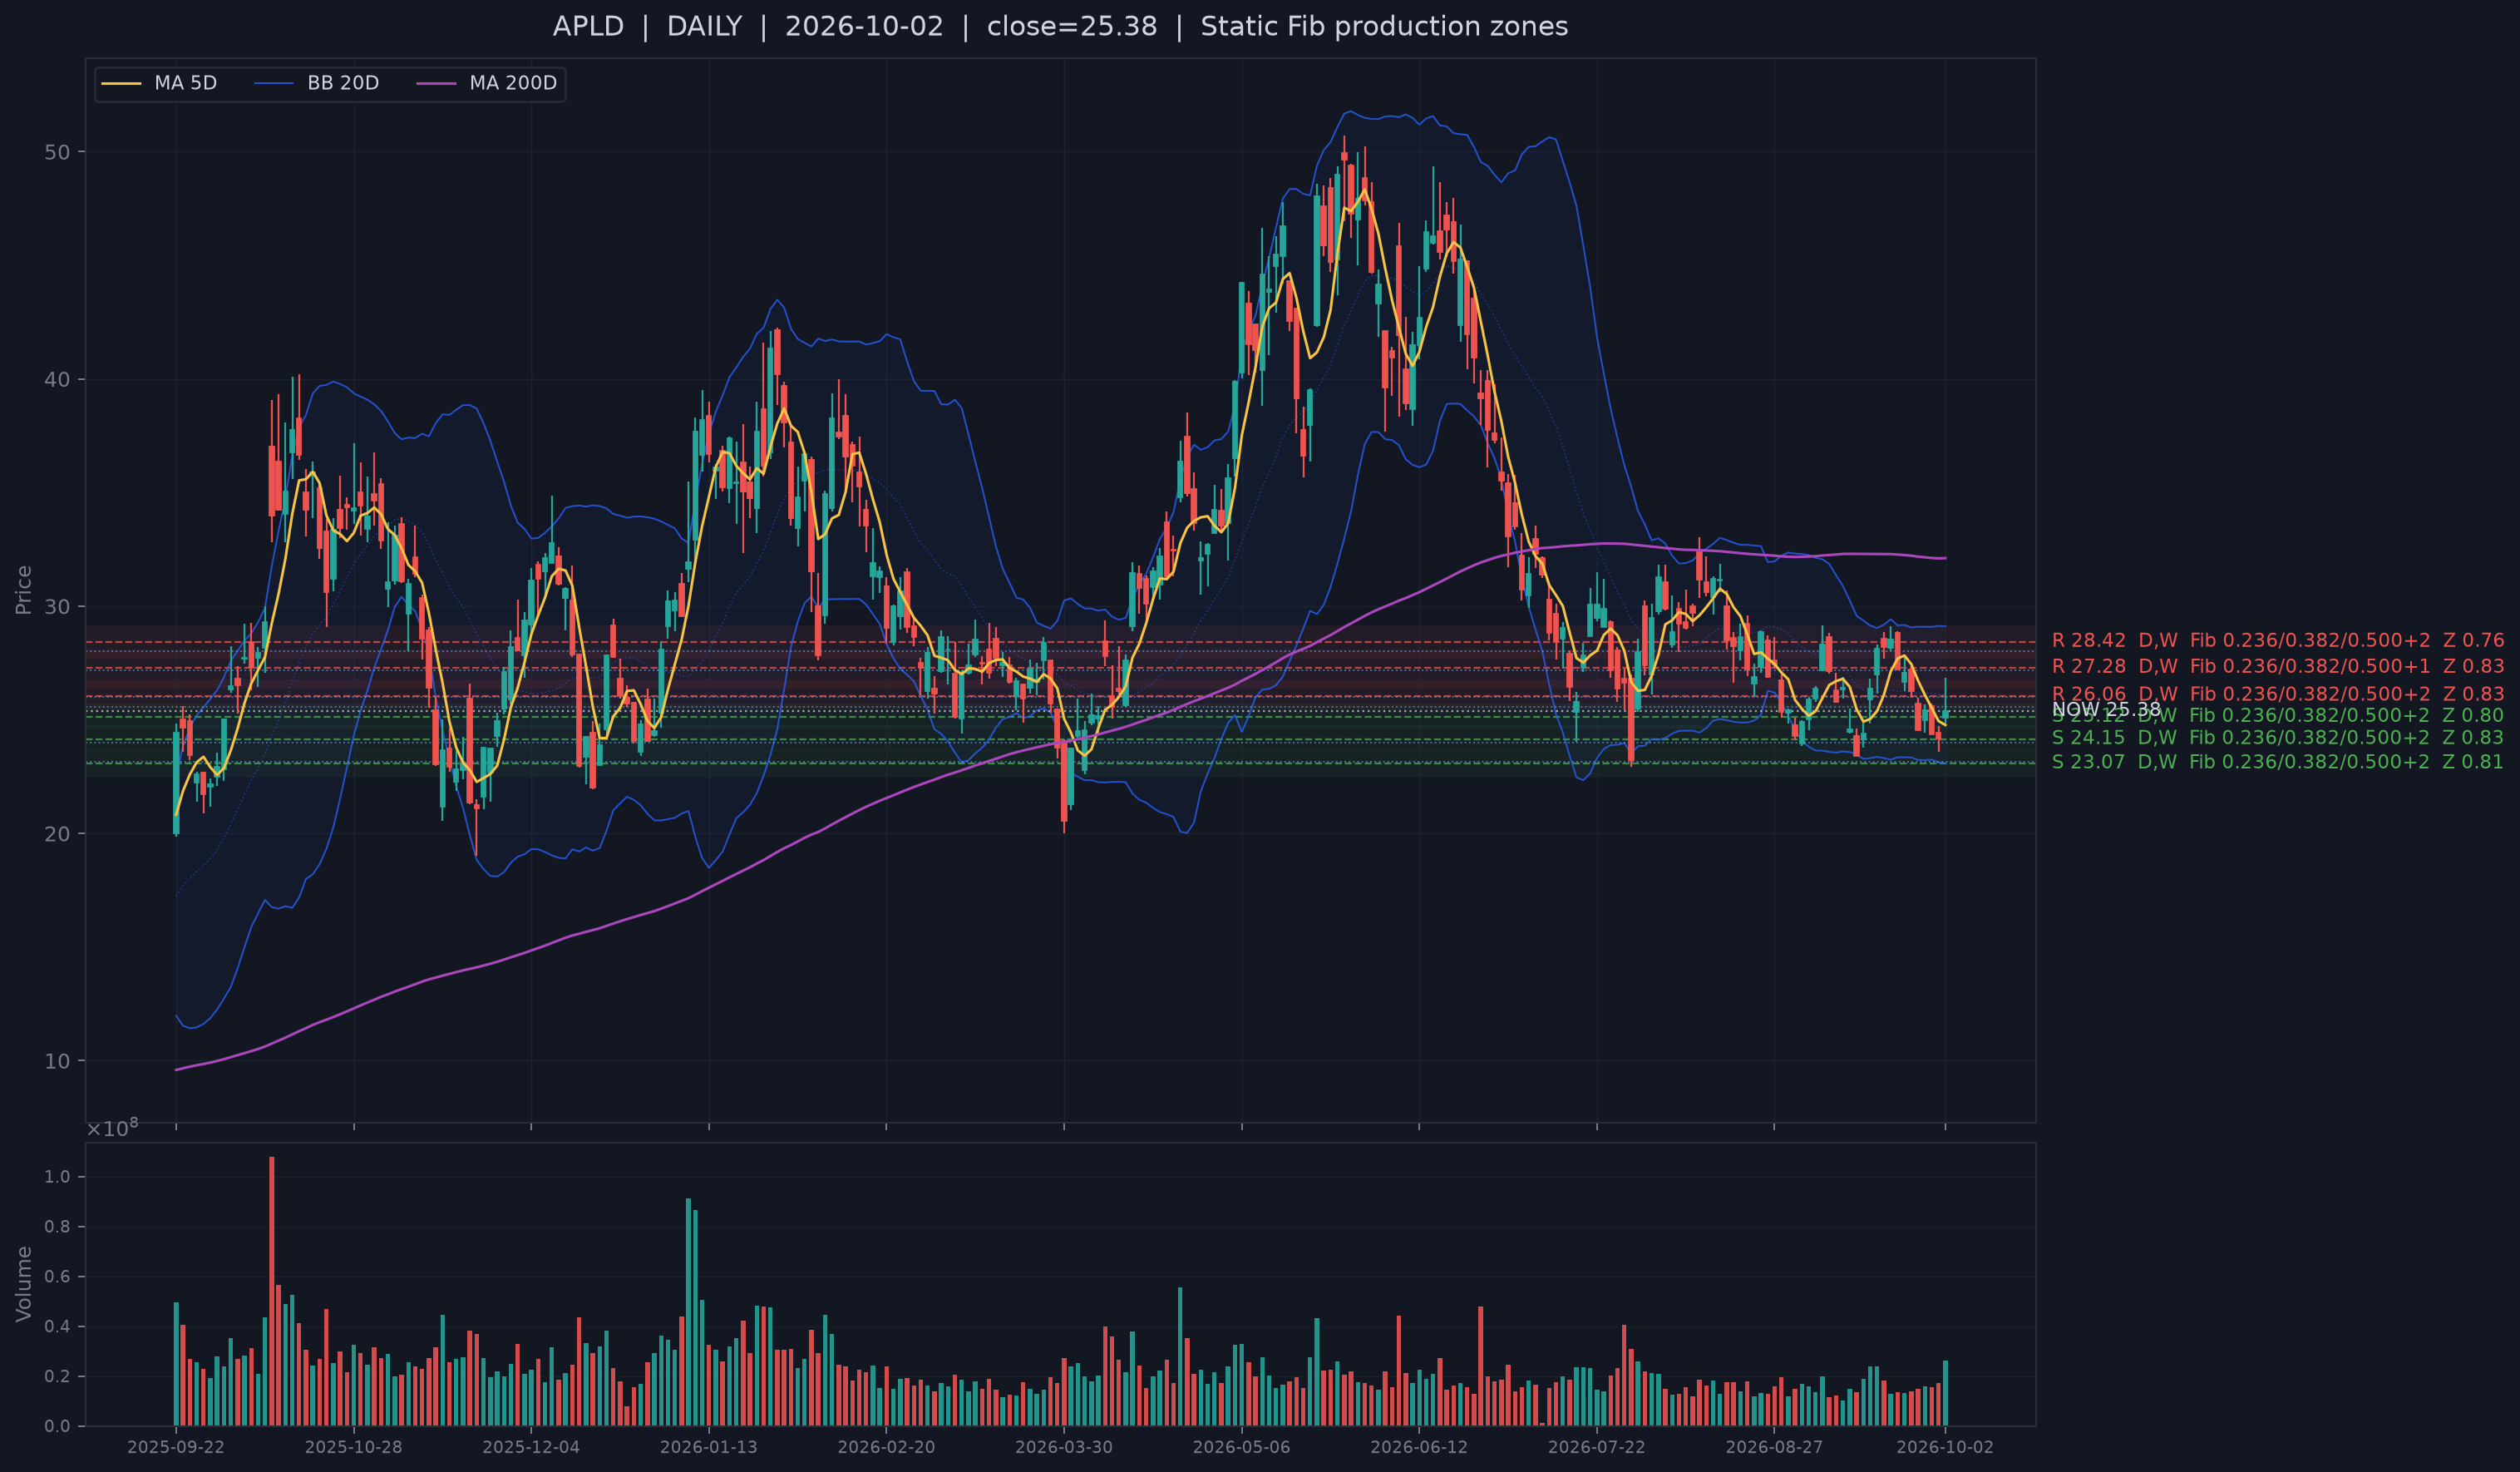
| APLD | Enterprise Software & IT Services | B | 30 of 296 | 47 of 296 | 2026-10-02 - Bullish Same Day Center Reclaim | +1.03% / 0.15 ATR | -2.76% | -3.31% | Fin 0.20 / 13F 0.45; div +0.37/+0.43 |
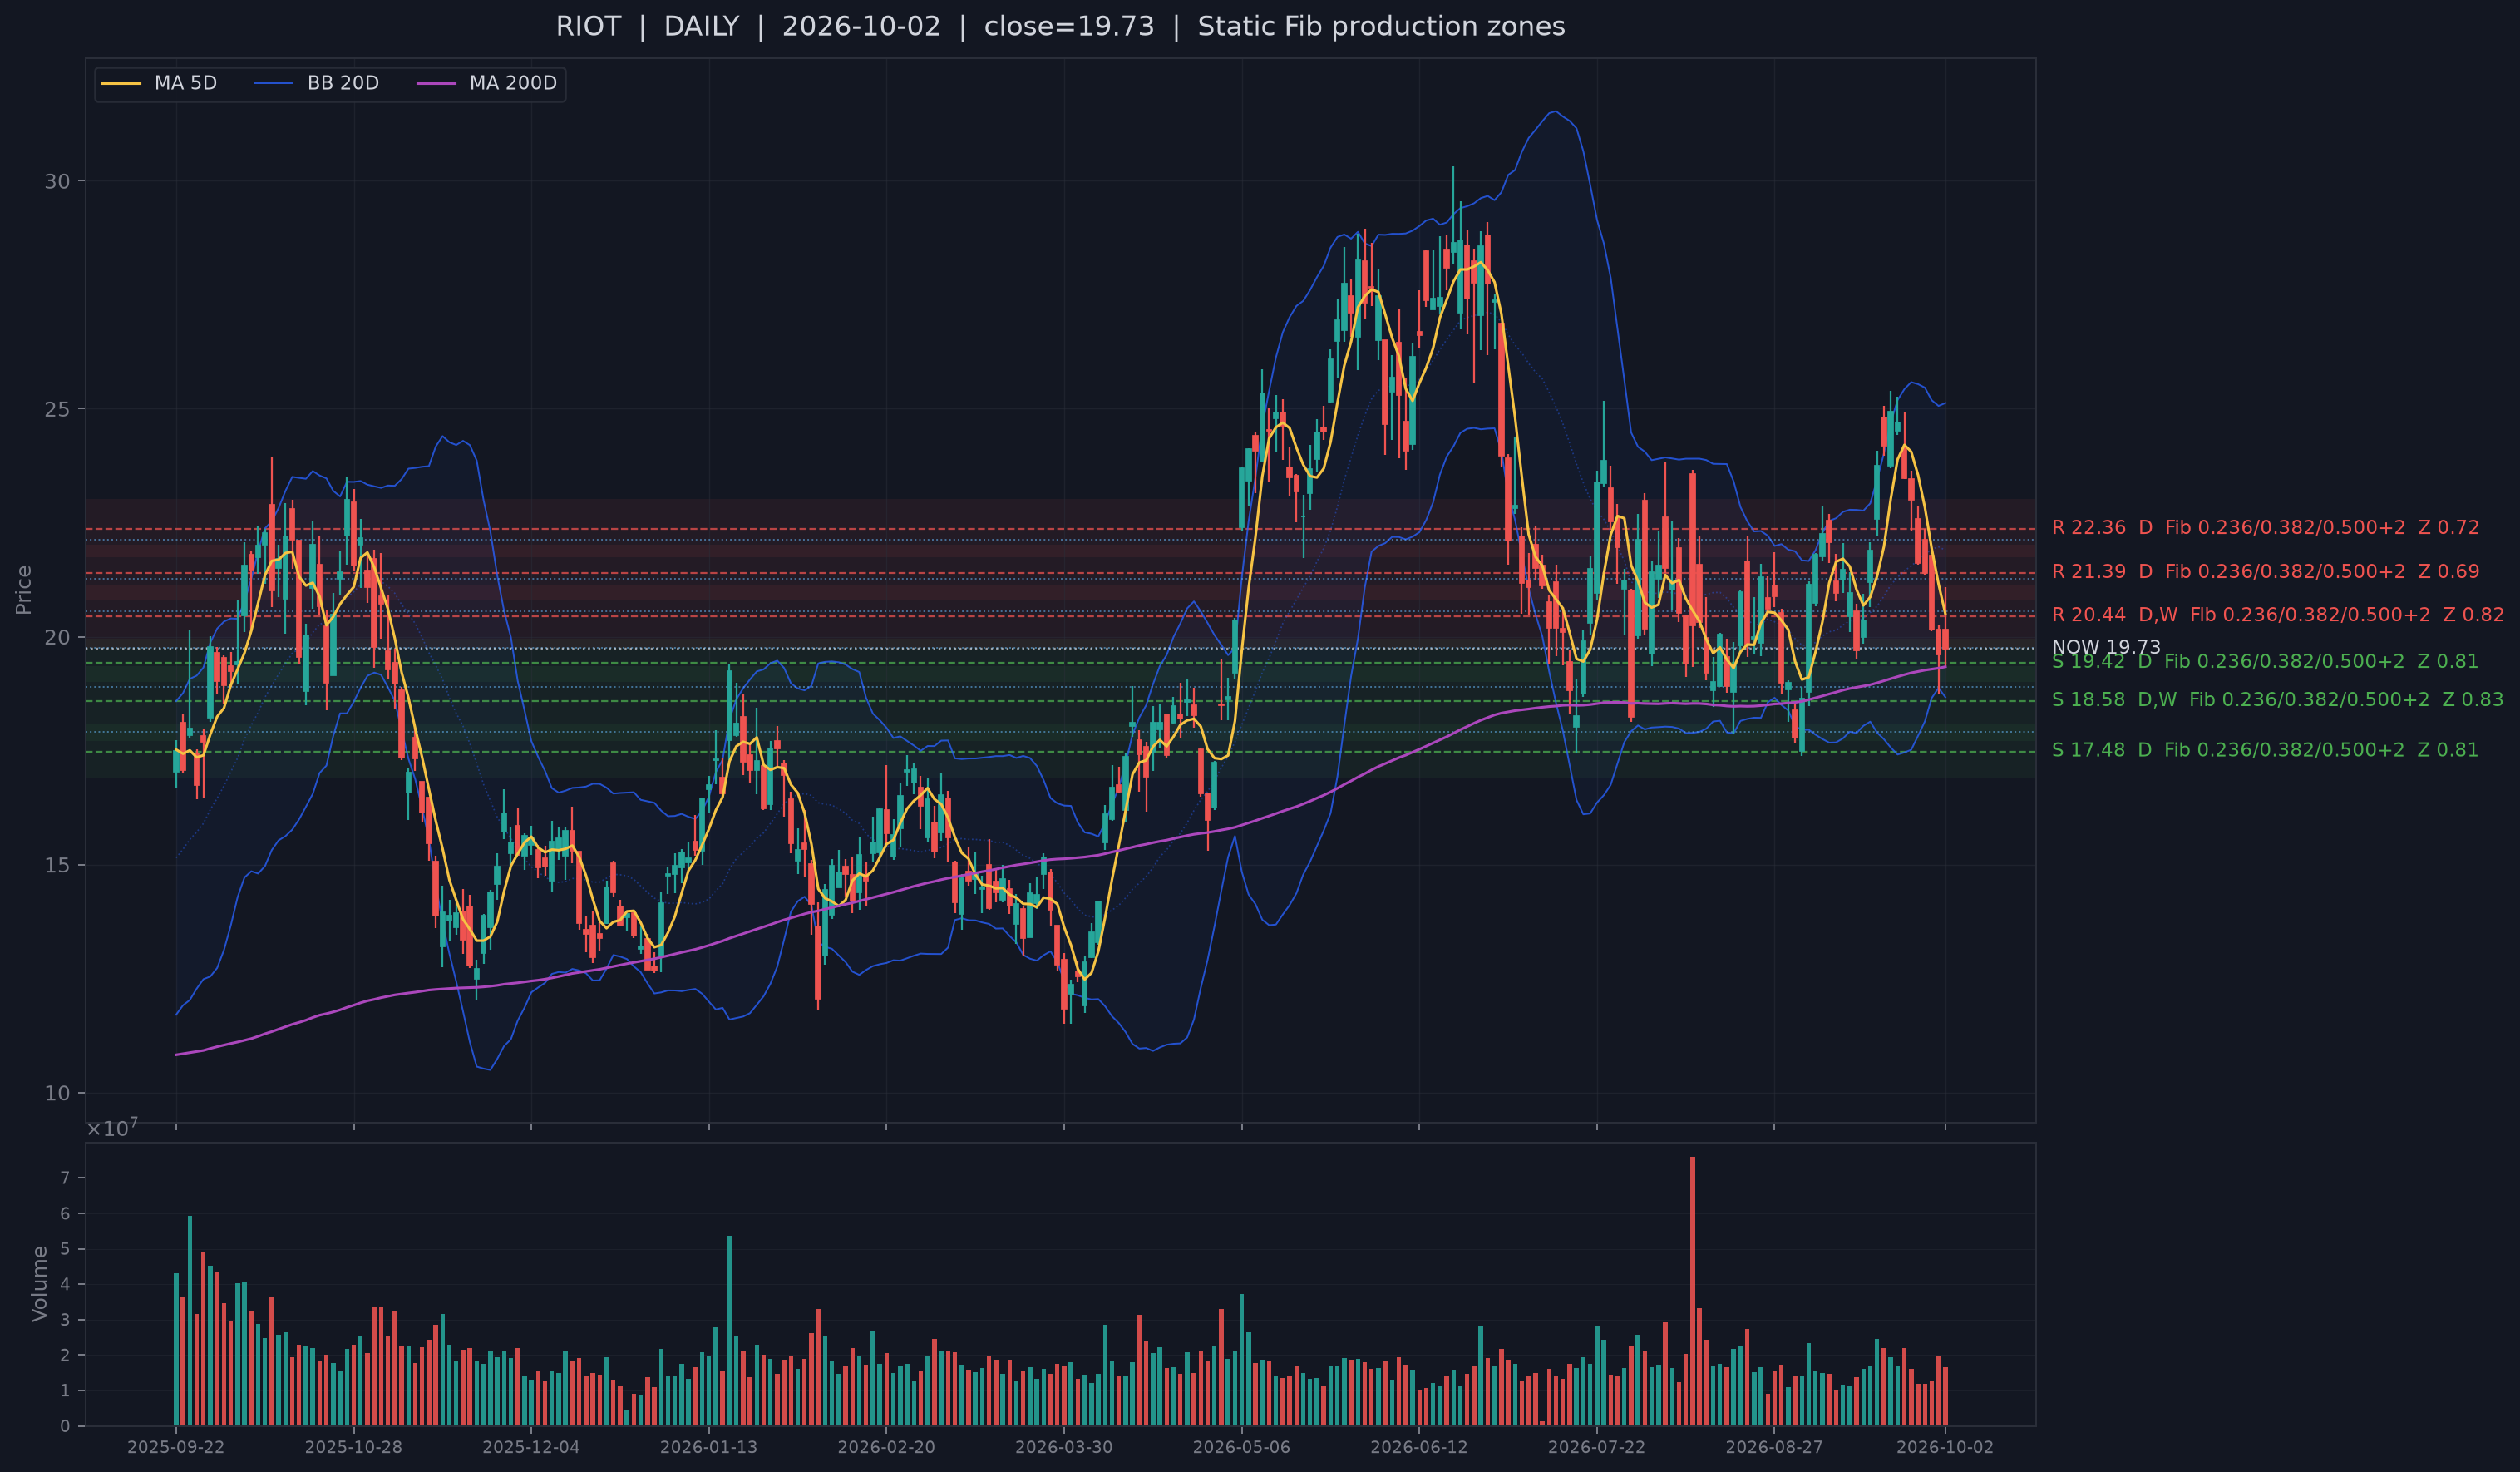
| RIOT | Asset Management & Capital Markets | A+ | 12 of 296 | 129 of 296 | 2026-10-02 - Bearish Wick Next Day Center Reclaim | +1.59% / 0.20 ATR | -9.90% | -14.22% | Fin 0.48 / 13F 0.40; div +0.43/+0.35 |
| MSTR | Enterprise Software & IT Services | A | 3 of 296 | 58 of 296 | 2026-10-01 - Bullish Same Day Center Reclaim | +2.48% / 0.42 ATR | +8.33% | +0.88% | Fin 0.27 / 13F 0.34; div +0.24/+0.19 |
| SMCI | Semiconductors & Tech Hardware | B | 24 of 296 | 42 of 296 | 2026-10-02 - Bullish Same Day Center Reclaim | +2.45% / 0.46 ATR | +8.77% | +0.99% | Fin 0.05 / 13F 0.23; div +0.10/+0.13 |
| ACN | Enterprise Software & IT Services | B | 26 of 296 | 53 of 296 | 2026-09-30 - Bullish Same Day Center Reclaim | +2.73% / 0.53 ATR | +7.34% | +12.94% | Fin 0.25 / 13F 0.33; div -0.15/-0.19 |
| BLK | Asset Management & Capital Markets | A | 7 of 296 | 289 of 296 | 2026-10-01 - Bullish Same Day Center Reclaim | +1.20% / 0.55 ATR | -1.04% | -2.46% | Fin 0.18 / 13F 0.17; div -0.38/-0.48 |
| MARA | Asset Management & Capital Markets | B | 22 of 296 | 111 of 296 | 2026-10-02 - Bearish Wick Next Day Center Reclaim | +4.41% / 0.56 ATR | -6.70% | -10.52% | Fin 0.01 / 13F 0.32; div +0.11/+0.28 |
The first contrast is support plus trend. INTC is only 0.03 ATR above live S1 and remains 6.89% above MA20; its Financial and delayed-13F ranks are both strong. SMCI is 8.77% above MA20, MSTR 8.33%, ACN 7.34%, U 3.11% and BMNR 1.37%. These names show that a strict support pass can coexist with a medium-term trend cushion rather than requiring a trend-repair thesis.
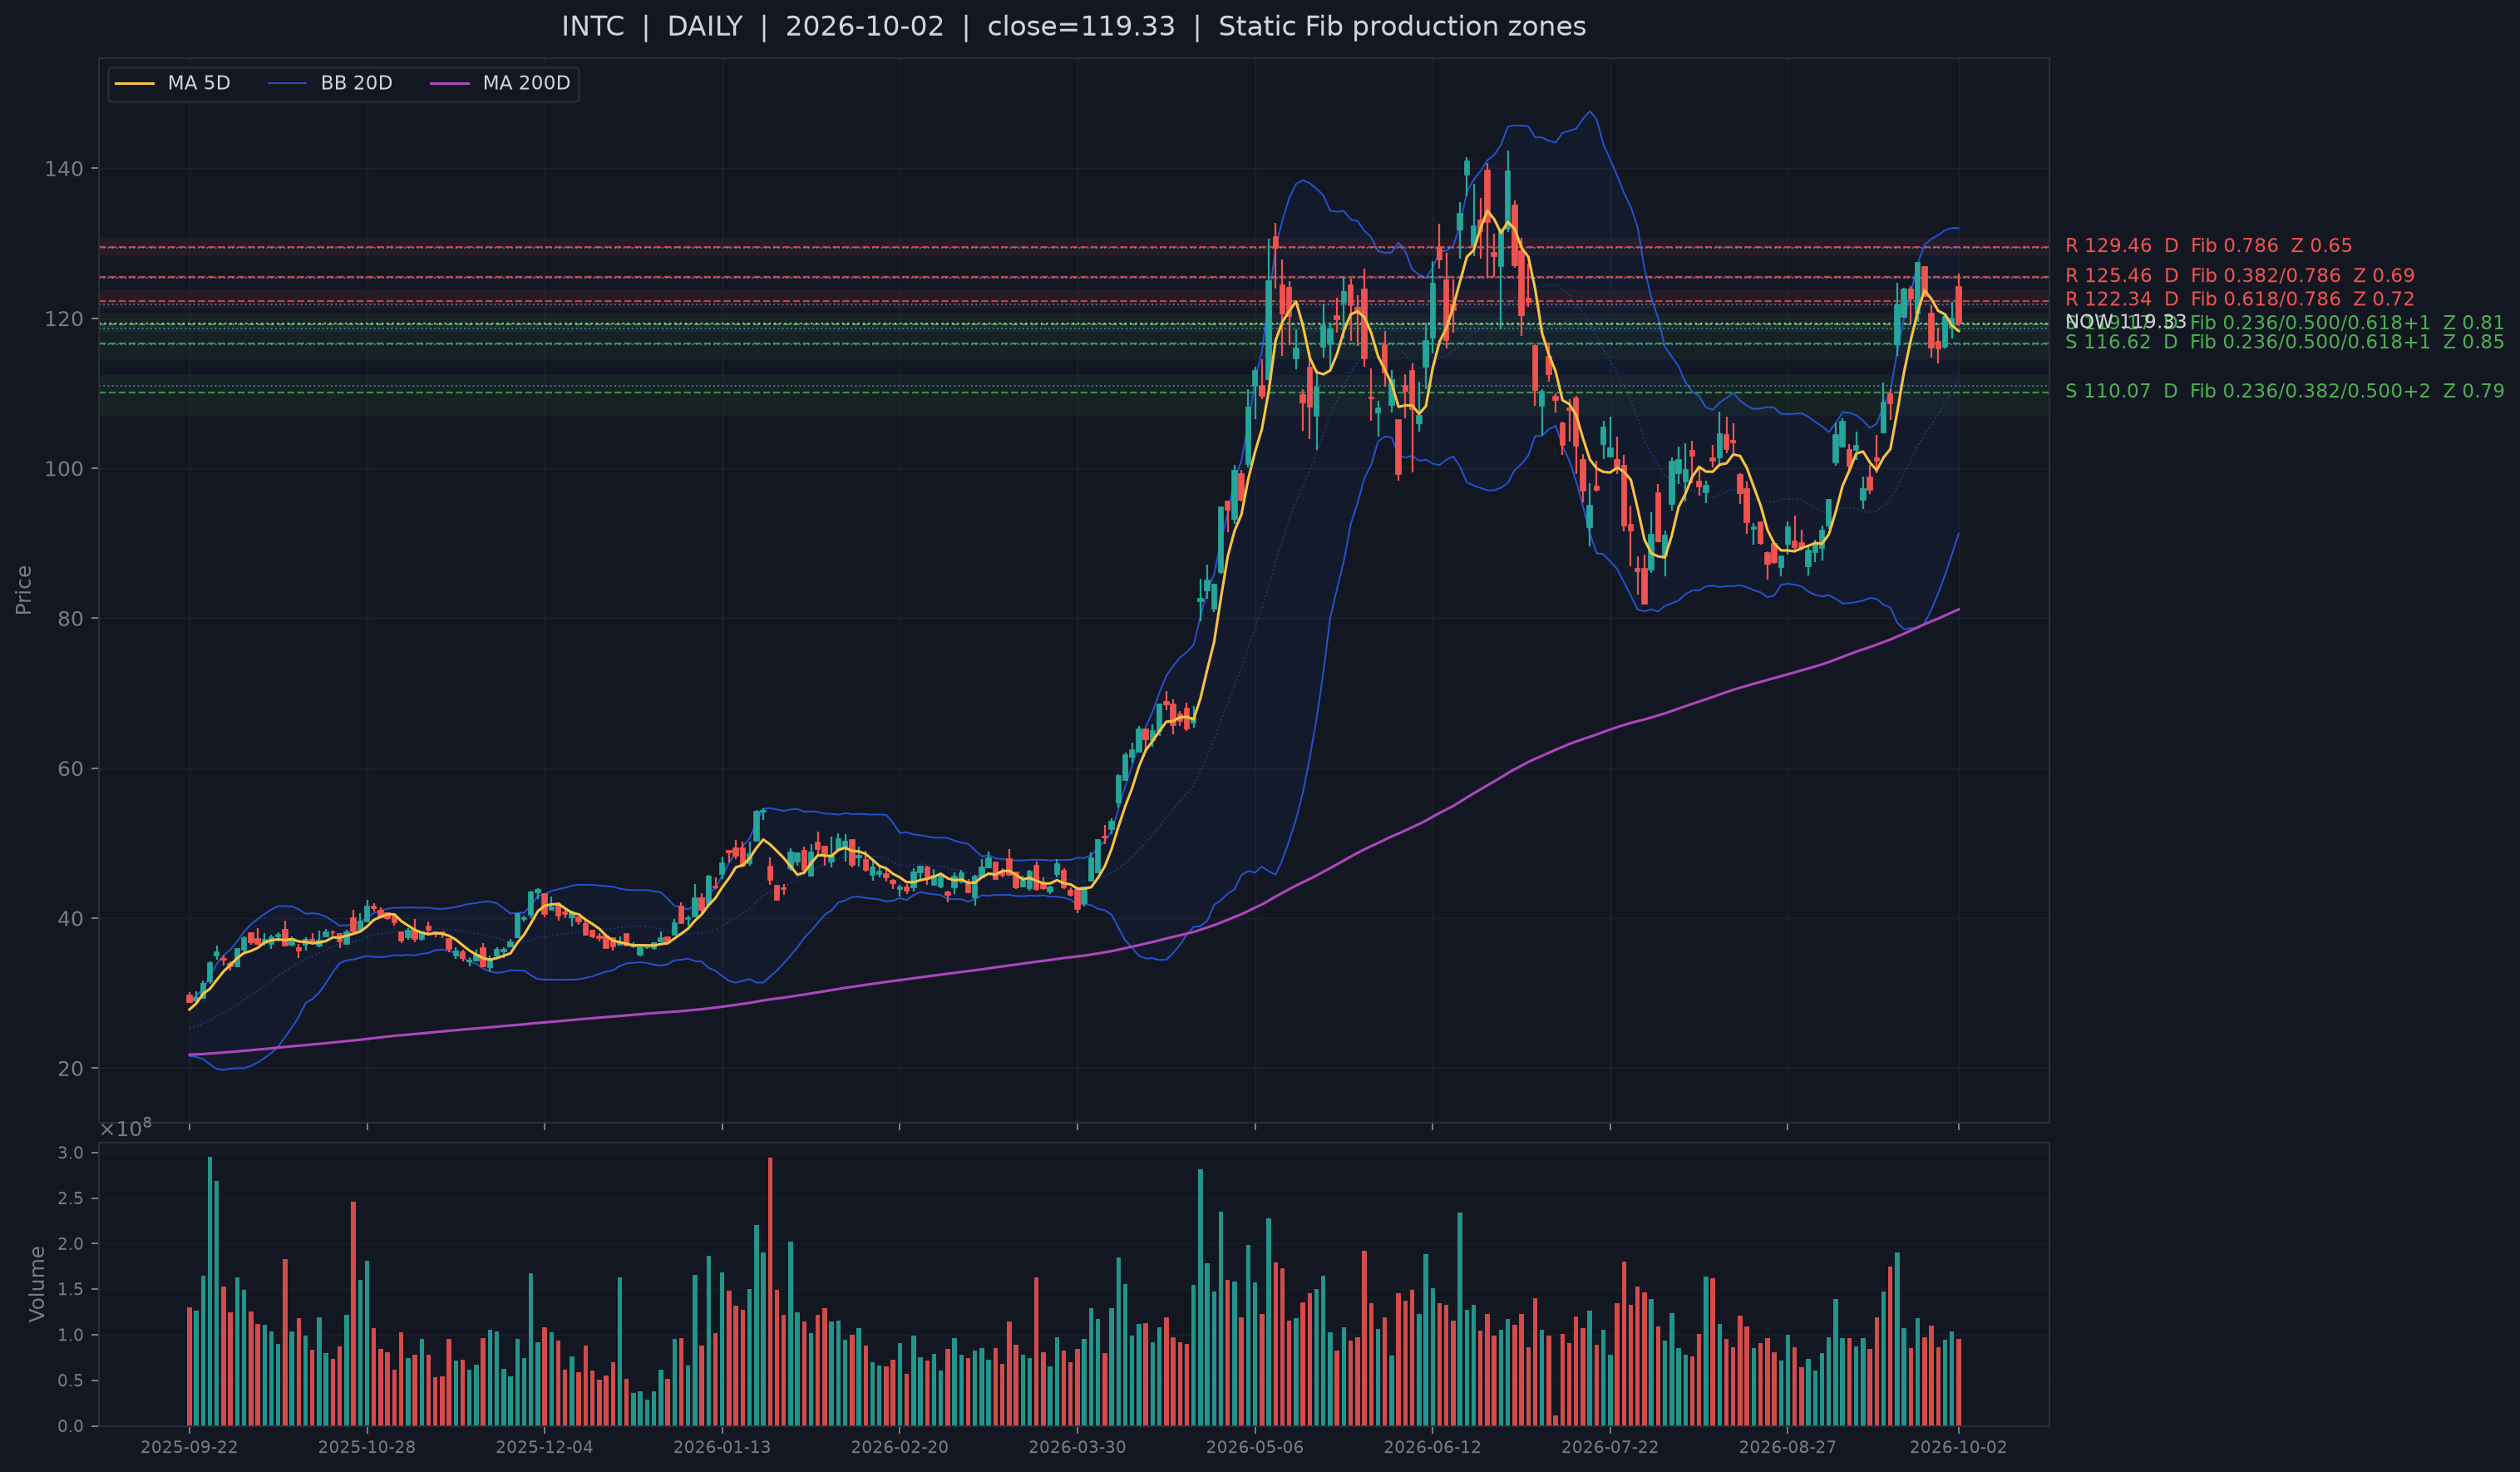
INTC is the clearest local example. Its support confirmation is one trading day old, the close is almost exactly on live S1, and the MA20 cushion remains positive. Intel's public AI-infrastructure material supplies a plausible business channel without changing the quantitative order. The risk is sector-level: Semiconductors are simultaneously Bull #2 and Bear-risk #1, so even the strongest local setup inherits a conflicted sector backdrop.
The second contrast is fresh support without repaired trend. APLD and RIOT both confirmed support on Oct. 2, but they remain 2.76% and 9.90% below MA20. MARA is also 6.70% below MA20. APLD has substantial contracted AI-data-center load, and RIOT has long-duration contracted AI/data-center capacity, but those business facts do not erase the price-repair burden. A secondary single-name context layer available for APLD is mixed; it is kept neutral and explicitly does not override the primary recent-support selection/order.
The third contrast is support plus strong price with slower-context disagreement. U is 0.15 ATR above live S1 and 3.11% above MA20. Its Financial rank is high at 0.83, but delayed-13F rank is only 0.04 and both divergence measures are negative, meaning price has run ahead of the slower institutional layer. Unity's Meta VR support is a real business development, but the slow-context split argues against converting that news into an unqualified confirmation signal.
The fourth contrast is the crypto-linked cluster. BMNR is extremely close to S1 and above MA20; MSTR is farther from S1 but has an 8.33% MA20 cushion; RIOT and MARA are much more damaged on the medium-term trend. Public filings confirm very different operating channels: BMNR is an Ether-treasury vehicle, Strategy is primarily a Bitcoin-treasury vehicle, and RIOT combines mining with contracted AI data-center capacity. The shared crypto sensitivity helps explain sector co-movement, but it does not make the four setups interchangeable.
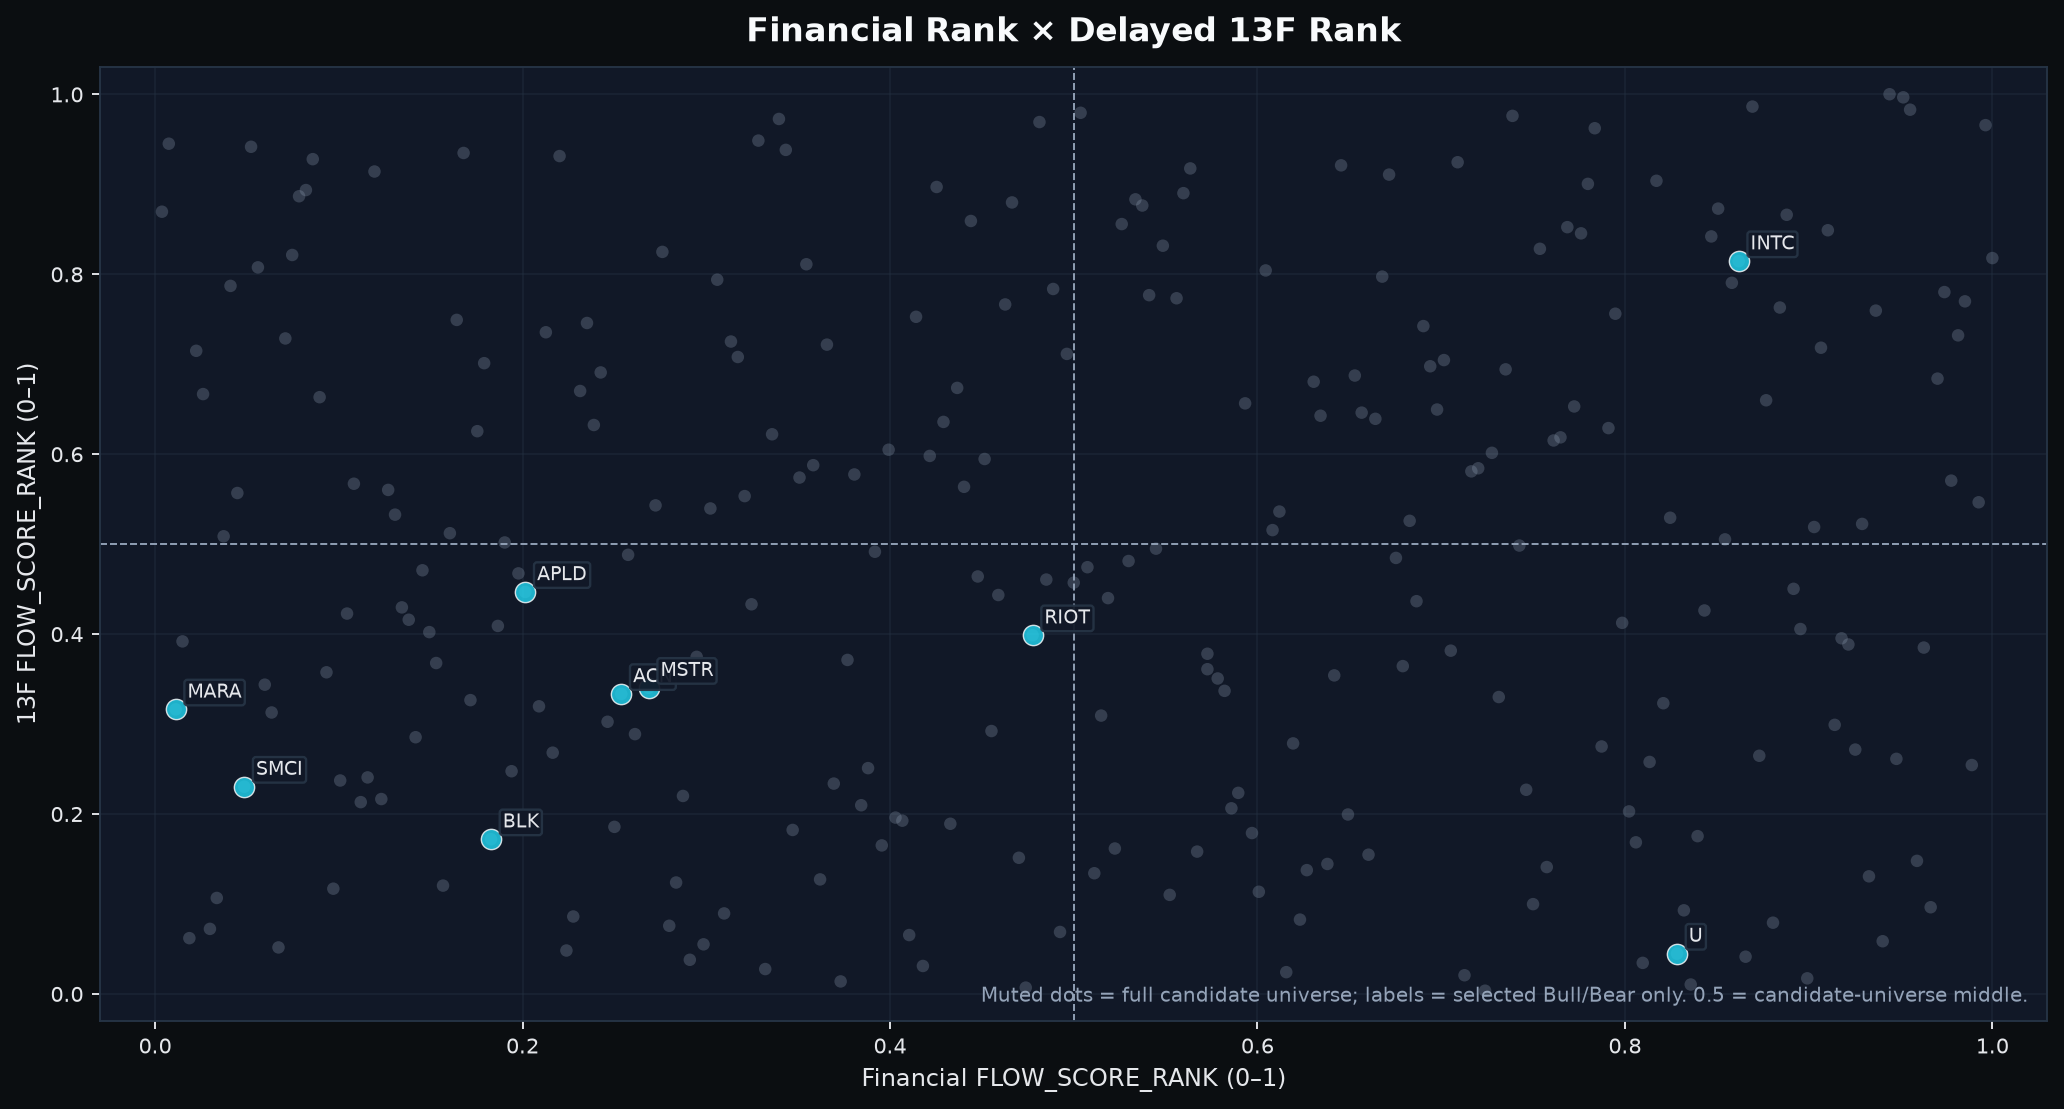
BLK and ACN illustrate why the full table matters even when no chart is shown. BLK is only 1.20% above S1 but still slightly below MA20, while ACN is farther from S1 yet well above MA20. The publication order remains a mechanical function of the upstream recent-support contract, not a discretionary ranking of business quality, news or medium-term trend.
6. What would change the thesis?
Base case: selectively constructive over 3-10 trading days after a successful late order-flow state repair, but with moderate confidence because breadth remains below balance and 252-day new-low damage is unusually high. This is a setup-selection environment, not evidence that the entire market has repaired.
Strengtheners: all three order-flow axes remain above 50 through the first half of the next session; Bull-aligned breadth stays ahead of Bear-aligned breadth; market breadth moves toward or above 0.50; the 252-day new-low z-score retreats; and the current support-confirmed stocks hold live S1 while the below-MA20 names begin actual trend repair.
Falsifiers: the late repair fails immediately and Aggressor/Depth/Alignment lose 50 together; the new-low spike spreads into down-3% breadth and cross-sectional volatility; the indexes lose MA20; or two-sided sector risk expands while current leaders fail their strict support zones.
One macro caveat remains: the pre-open jobs report eased the fresh rate impulse, but absolute F remains above +2z. A renewed positive F shock would raise the confirmation burden again even if Friday's closing order-flow repair persists.
Sources
Methodology note: The analysis begins with the current quantitative evidence stack and only then uses dated public facts to test mechanisms, timing and counterevidence. Session-causal statements use information available by the relevant regular-session cutoff. Public research does not add, remove or rerank stocks or sectors. CFTC data are weekly and explicitly treated as lagged context. Price-implied rotation is not described as observed fund flow. Internal formulas, model weights and private construction details are not published.
- Reuters - Soft September jobs report sends markets higher (Oct. 2, 2026) - Pre-open macro context: payroll growth of 29,000 versus 90,000 expected and lower Treasury yields after the release.
- CFTC - Commitments of Traders release schedule - Official weekly cadence and Tuesday-observation/Friday-release timing.
- Reuters syndication via Boursorama - Crypto-linked U.S. stocks rise with Bitcoin (Oct. 2, 2026) - Same-day public context for crypto-linked Asset Management names; not used to rerank stocks.
- SEC / BitMine - ETH holdings exceed 6 million tokens (Sep. 28, 2026) - Business-context confirmation for BMNR crypto-treasury exposure.
- Strategy - Acquires 1,665 BTC (Sep. 28, 2026) - Business-context confirmation for MSTR Bitcoin-treasury exposure.
- Riot Platforms - Q2 2026 strategic highlights (Aug. 10, 2026) - Business-context confirmation for RIOT mining and AI-data-center capacity.
- Credo - Fiscal Q1 2027 results (Sep. 1, 2026) - Semiconductor leadership mechanism: data-connectivity demand and revenue growth.
- Supermicro - Shipping NVIDIA Vera Rubin NVL72 racks (Sep. 23, 2026) - AI-infrastructure deployment context for SMCI and the semiconductor/hardware cluster.
- Intel - AI Infra Summit 2026 (Aug. 26, 2026) - Business-context confirmation for INTC AI-infrastructure exposure.
- Applied Digital - FY2026 results (2026) - Enterprise/AI-infrastructure context: 1.4 GW contracted critical IT load and long-term leases.
- Unity - Day-one support for Meta VR Glasses (Sep. 24, 2026) - Business-context confirmation for U; not used to override the quantitative order.
- Reuters - AI financing strains remain a counterweight (Sep. 29, 2026) - Counterevidence for AI-infrastructure leadership: higher-cost financing and stress in AI-related debt.
- Reuters - Tesla Q3 deliveries beat forecasts (Oct. 2, 2026) - Pre-open same-day public fact for the Autos sector.
- Reuters - Rivian Q3 deliveries hit a record (Oct. 2, 2026) - Pre-open same-day public fact and counterevidence: record deliveries but maintained annual guidance.
- Reuters - Chinese refiners suspend October fuel exports (Oct. 1, 2026) - Pre-session backdrop for refining margins and product-market tightness.
Disclosure: Market Layers is provided for informational and research purposes only and does not constitute investment advice.